Industries
Business Distribution by Industry in Igumale
| Industry Description | Number of Establishments |
|---|---|
| Education | 9 |
Igumale Facts
| Area | 0.2 km² |
| Population | 14,250 |
| Male Population | 7,138 (50.1%) |
| Female Population | 7,112 (49.9%) |
| Population change (1975 to 2020) | +173.3% |
| Population change (2000 to 2020) | +47.5% |
| Median Age | 16.3 years (Male: 15.5, Female: 17.1) |
| Local Time | |
| Timezone | West Africa Time |
| Lat & Lng | 6.79792, 7.96794 |
| Postal Codes | 973107 |
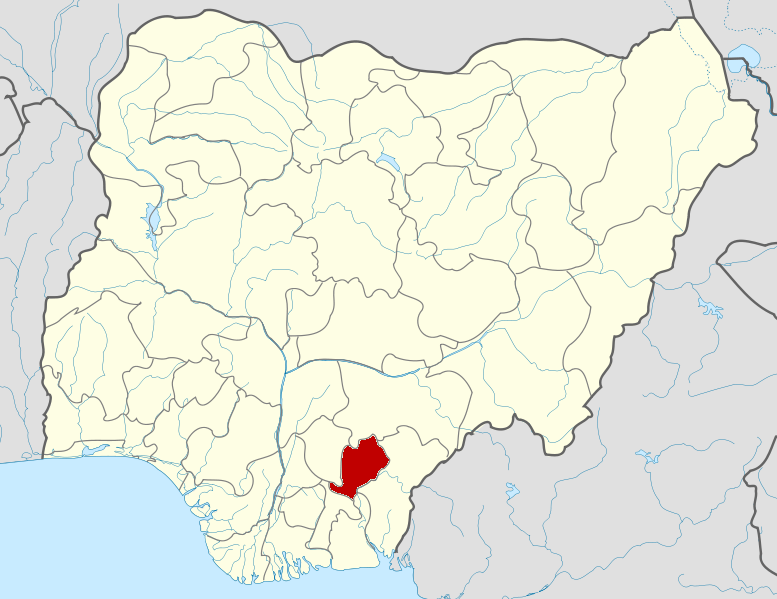
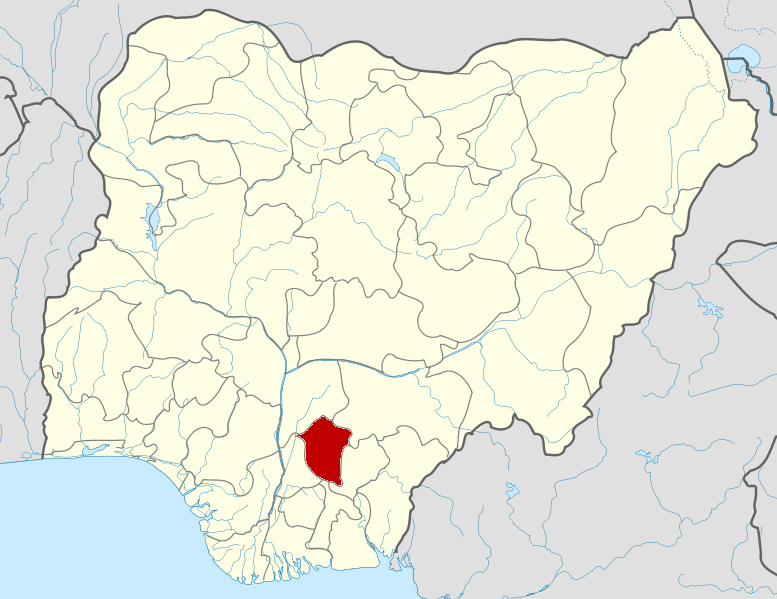
Map of Igumale
Interactive Map
Igumale Population
Years 1975 to 2030
| Data | 1975 | 1990 | 2000 | 2015 | 2020 | 2025* | 2030* |
|---|---|---|---|---|---|---|---|
| Population | 5,215 | 7,950 | 9,658 | 8,276 | 14,250 | 14,091 | 14,524 |
| Population Density | 27,813.3 / km² | 42,400 / km² | 51,509.3 / km² | 44,138.7 / km² | 76,000 / km² | 75,152 / km² | 77,461.3 / km² |
* Projected
Sources: JRC (European Commission's Joint Research Centre) work on the GHS built-up gridIgumale Population change from 2000 to 2020
Increase of 47.5% from year 2000 to 2020
| Location | Change since 1975 | Change since 1990 | Change since 2000 |
|---|---|---|---|
| Igumale | +173.3% | +79.2% | +47.5% |
| Benué (state) | — | — | — |
| Nigeria | — | — | — |
Sources: JRC (European Commission's Joint Research Centre) work on the GHS built-up grid
Igumale Median Age
Median Age: 16.3 years
| Location | Median Age | Median Age (Female) | Median Age (Male) |
|---|---|---|---|
| Igumale | 16.3 yrs | 17.1 yrs | 15.5 yrs |
| Benué (state) | 16.9 yrs | 17.3 yrs | 16.4 yrs |
| Nigeria | 18.9 yrs | 19.3 yrs | 18.5 yrs |
Sources: CIESIN (Center for International Earth Science Information Network)
Igumale Population Density
Population Density: 76,000 / km²
| Location | Population | Area | Density |
|---|---|---|---|
| Igumale | 14,250 | 0.188 km² | 76,000 / km² |
| Benué (state) | 5.3 million | 30,768.4 km² | 172 / km² |
| Nigeria | 182 million | 909,042.9 km² | 200 / km² |
Sources: JRC (European Commission's Joint Research Centre) work on the GHS built-up grid
Igumale Historical and Projected Population
Estimated Population from 1100 to 2100
Sources:
- JRC (European Commission's Joint Research Centre) work on the GHS built-up grid
- CIESIN (Center for International Earth Science Information Network)
- [Link] Klein Goldewijk, K., Beusen, A., Doelman, J., and Stehfest, E.: Anthropogenic land use estimates for the Holocene – HYDE 3.2, Earth Syst. Sci. Data, 9, 927–953, https://doi.org/10.5194/essd-9-927-2017, 2017.
Human Development Index (HDI)
Statistic composite index of life expectancy, education, and per capita income.
Source: [Link] Kummu, M., Taka, M. &Guillaume, J. Gridded global datasets for Gross Domestic Product and Human Development Index over 1990–2015. Sci Data 5, 180004 (2018) doi:10.1038/sdata.2018.4
Igumale CO2 Emissions
Carbon Dioxide (CO2) Emissions Per Capita in Tonnes Per Year
| Location | CO2 Emissions | CO2 Emissions Per Capita | CO2 Emissions Intensity |
|---|---|---|---|
| Igumale | 7,466 tn | 0.52 tn | 39,818.6 tons/km² |
| Benué (state) | 2,782,047 tn | 0.52 tn | 90.4 tons/km² |
| Nigeria | 86,705,254 tn | 0.48 tn | 95.4 tons/km² |
Sources: [Link] Moran, D., Kanemoto K; Jiborn, M., Wood, R., Többen, J., and Seto, K.C. (2018) Carbon footprints of 13,000 cities. Environmental Research Letters DOI: 10.1088/1748-9326/aac72a
Igumale CO2 Emissions
| 2013 CO2 emissions (tonnes/year) | 7,466 tn |
| 2013 CO2 emissions (tonnes/year) per capita | 0.52 tn |
| 2013 CO2 emissions intensity (tonnes/km²/year) | 39,818.6 tons/km² |

About Our Data
The data on this page is estimated using a number of publicly available tools and resources. It is provided without warranty, and could contain inaccuracies. Use at your own risk.