Categories in Kabba
Industries
Business Distribution by Industry in Kabba
| Industry Description | Number of Establishments |
|---|---|
| Churches | 38 |
| Education | 26 |
| Gas station | 24 |
| Hotels and motels | 24 |
| Shopping other | 22 |
| Shopping | 20 |
| Hospitals | 17 |
| Beauty salons | 16 |
| Restaurants | 13 |
| Public administration | 10 |
| Pharmacies and drug stores | 10 |
| Clothing stores | 9 |
| Cafes | 9 |
| Religion | 8 |
| Car repair | 8 |
| Corporate management | 8 |
Kabba Facts
| Area | 6.4 km² |
| Population | 66,265 |
| Male Population | 33,293 (50.2%) |
| Female Population | 32,972 (49.8%) |
| Population change (1975 to 2020) | +233.3% |
| Population change (2000 to 2020) | -12.5% |
| Median Age | 17.2 years (Male: 16.8, Female: 17.5) |
| Local Time | |
| Timezone | West Africa Time |
| Lat & Lng | 7.82719, 6.07502 |
| Postal Codes | 261101, 261211, 261221, 261231, 261261, More |
Map of Kabba
Interactive Map
Kabba Population
Years 1975 to 2030
| Data | 1975 | 1990 | 2000 | 2015 | 2020 | 2025* | 2030* |
|---|---|---|---|---|---|---|---|
| Population | 19,881 | 70,067 | 75,692 | 67,259 | 66,265 | 71,495 | 76,641 |
| Population Density | 3,118.6 / km² | 10,990.9 / km² | 11,873.3 / km² | 10,550.4 / km² | 10,394.5 / km² | 11,214.9 / km² | 12,022.1 / km² |
Kabba Population change from 2000 to 2020
Decrease of 12.5% from year 2000 to 2020
| Location | Change since 1975 | Change since 1990 | Change since 2000 |
|---|---|---|---|
| Kabba | +233.3% | -5.4% | -12.5% |
| Kogi | — | — | — |
| Nigeria | — | — | — |
Kabba Median Age
Median Age: 17.2 years
| Location | Median Age | Median Age (Female) | Median Age (Male) |
|---|---|---|---|
| Kabba | 17.2 yrs | 17.5 yrs | 16.8 yrs |
| Kogi | 17.3 yrs | 17.9 yrs | 16.7 yrs |
| Nigeria | 18.9 yrs | 19.3 yrs | 18.5 yrs |
Kabba Population Density
Population Density: 10,395 / km²
| Location | Population | Area | Density |
|---|---|---|---|
| Kabba | 66,265 | 6.4 km² | 10,395 / km² |
| Kogi | 4.1 million | 29,048.2 km² | 141 / km² |
| Nigeria | 182 million | 909,042.9 km² | 200 / km² |
Kabba Historical and Projected Population
Estimated Population from 1300 to 2100
- JRC (European Commission's Joint Research Centre) work on the GHS built-up grid
- CIESIN (Center for International Earth Science Information Network)
- [Link] Klein Goldewijk, K., Beusen, A., Doelman, J., and Stehfest, E.: Anthropogenic land use estimates for the Holocene – HYDE 3.2, Earth Syst. Sci. Data, 9, 927–953, https://doi.org/10.5194/essd-9-927-2017, 2017.
Area Codes
Percentage Area Codes used by businesses in Kabba
Human Development Index (HDI)
Statistic composite index of life expectancy, education, and per capita income.
Kabba CO2 Emissions
Carbon Dioxide (CO2) Emissions Per Capita in Tonnes Per Year
| Location | CO2 Emissions | CO2 Emissions Per Capita | CO2 Emissions Intensity |
|---|---|---|---|
| Kabba | 33,623 tn | 0.51 tn | 5,274.2 tons/km² |
| Kogi | 1,953,426 tn | 0.48 tn | 67.2 tons/km² |
| Nigeria | 86,705,254 tn | 0.48 tn | 95.4 tons/km² |
| 2013 CO2 emissions (tonnes/year) | 33,623 tn |
| 2013 CO2 emissions (tonnes/year) per capita | 0.51 tn |
| 2013 CO2 emissions intensity (tonnes/km²/year) | 5,274.2 tons/km² |
Kabba
Kabba is a town in Kogi State in mid west Nigeria. It lies near the Osse River, at the intersection of roads from Lokoja, Okene, Ogidi, Ado-Ekiti, and Egbe. The town is near Abuja. John Olorunfemi Onaiyekan, of the Roman Catholic Archdiocese of Abuj..
Kabba Wikipedia Page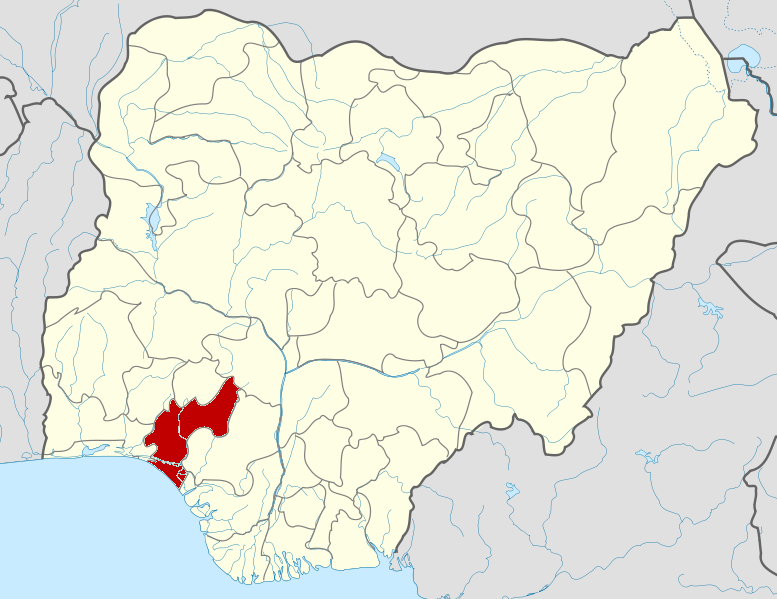


About Our Data
The data on this page is estimated using a number of publicly available tools and resources. It is provided without warranty, and could contain inaccuracies. Use at your own risk.