Otukpo Facts
| Area | 9.9 km² |
| Population | 210,105 |
| Male Population | 107,739 (51.3%) |
| Female Population | 102,366 (48.7%) |
| Population change (1975 to 2020) | +115.9% |
| Population change (2000 to 2020) | +44.9% |
| Median Age | 17.4 years (Male: 16.9, Female: 17.9) |
| Local Time | |
| Timezone | West Africa Time |
| Lat & Lng | 7.19140, 8.13330 |
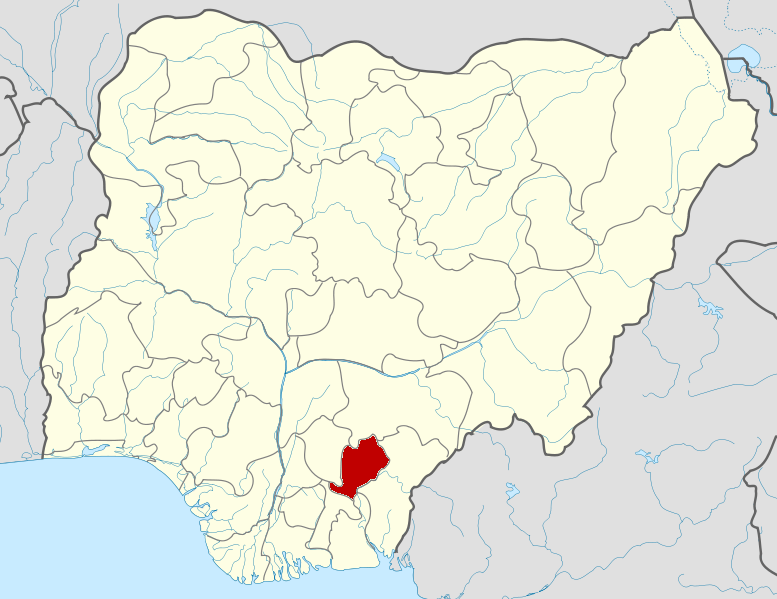
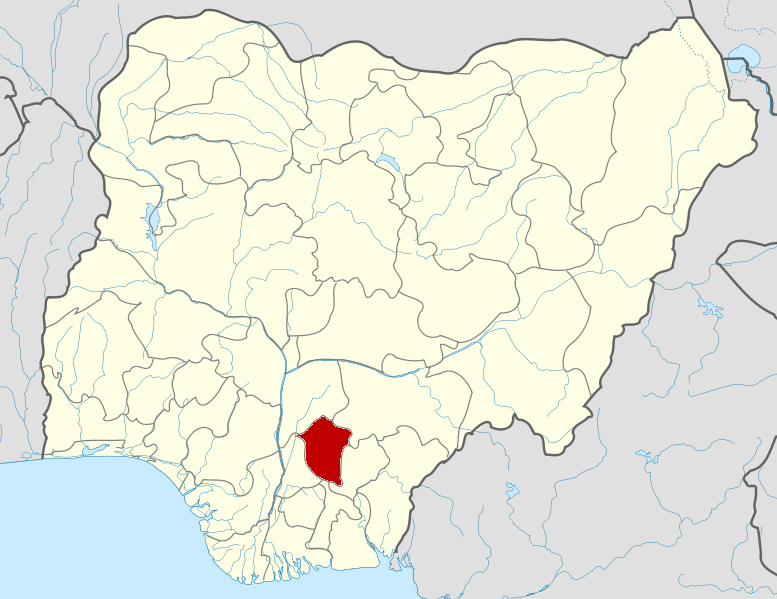
Map of Otukpo
Interactive Map
Otukpo Population
Years 1975 to 2020
| Data | 1975 | 1990 | 2000 | 2015 | 2020 |
|---|---|---|---|---|---|
| Population | 97,320 | 129,388 | 145,048 | 186,472 | 210,105 |
| Population Density | 9,855.2 / km² | 13,102.6 / km² | 14,688.4 / km² | 18,883.2 / km² | 21,276.5 / km² |
Sources: JRC (European Commission's Joint Research Centre) work on the GHS built-up grid
Otukpo Population change from 2000 to 2015
Increase of 28.6% from year 2000 to 2015
| Location | Change since 1975 | Change since 1990 | Change since 2000 |
|---|---|---|---|
| Otukpo | +91.6% | +44.1% | +28.6% |
| Benué (state) | +169.1% | +82.3% | +43.9% |
| Nigeria | +186.7% | +90.6% | +48.3% |
Sources: JRC (European Commission's Joint Research Centre) work on the GHS built-up grid
Otukpo Median Age
Median Age: 17.4 years
| Location | Median Age | Median Age (Female) | Median Age (Male) |
|---|---|---|---|
| Otukpo | 17.4 yrs | 17.9 yrs | 16.9 yrs |
| Benué (state) | 16.9 yrs | 17.3 yrs | 16.4 yrs |
| Nigeria | 18.9 yrs | 19.3 yrs | 18.5 yrs |
Sources: CIESIN (Center for International Earth Science Information Network)
Otukpo Population Density
Population Density: 21,277 / km²
| Location | Population | Area | Density |
|---|---|---|---|
| Otukpo | 210,105 | 9.9 km² | 21,277 / km² |
| Benué (state) | 5.3 million | 30,768.4 km² | 172 / km² |
| Nigeria | 182 million | 909,042.9 km² | 200 / km² |
Sources: JRC (European Commission's Joint Research Centre) work on the GHS built-up grid
Otukpo Historical and Projected Population
Estimated Population from 1600 to 2100
Sources:
- JRC (European Commission's Joint Research Centre) work on the GHS built-up grid
- CIESIN (Center for International Earth Science Information Network)
- [Link] Klein Goldewijk, K., Beusen, A., Doelman, J., and Stehfest, E.: Anthropogenic land use estimates for the Holocene – HYDE 3.2, Earth Syst. Sci. Data, 9, 927–953, https://doi.org/10.5194/essd-9-927-2017, 2017.
Human Development Index (HDI)
Statistic composite index of life expectancy, education, and per capita income.
Source: [Link] Kummu, M., Taka, M. &Guillaume, J. Gridded global datasets for Gross Domestic Product and Human Development Index over 1990–2015. Sci Data 5, 180004 (2018) doi:10.1038/sdata.2018.4
Otukpo CO2 Emissions
Carbon Dioxide (CO2) Emissions Per Capita in Tonnes Per Year
| Location | CO2 Emissions | CO2 Emissions Per Capita | CO2 Emissions Intensity |
|---|---|---|---|
| Otukpo | 116,210 tn | 0.55 tn | 11,768.1 tons/km² |
| Benué (state) | 2,782,047 tn | 0.52 tn | 90.4 tons/km² |
| Nigeria | 86,705,254 tn | 0.48 tn | 95.4 tons/km² |
Sources: [Link] Moran, D., Kanemoto K; Jiborn, M., Wood, R., Többen, J., and Seto, K.C. (2018) Carbon footprints of 13,000 cities. Environmental Research Letters DOI: 10.1088/1748-9326/aac72a
Otukpo CO2 Emissions
| 2013 CO2 emissions (tonnes/year) | 116,210 tn |
| 2013 CO2 emissions (tonnes/year) per capita | 0.55 tn |
| 2013 CO2 emissions intensity (tonnes/km²/year) | 11,768.1 tons/km² |
Otukpo
Otukpo is a town in Benue State, Nigeria located in the Middle Belt Region of Nigeria. It is also the eponymous name of a subgroup of the Idoma people. Otukpo is the headquarters of the Otukpo Local Government Area. It was the headquarters of the for..
Otukpo Wikipedia Page
About Our Data
The data on this page is estimated using a number of publicly available tools and resources. It is provided without warranty, and could contain inaccuracies. Use at your own risk.