Industries
Business Distribution by Industry in Uzebba
Uzebba Facts
| Area | 2.1 km² |
| Population | 17,598 |
| Male Population | 9,017 (51.2%) |
| Female Population | 8,581 (48.8%) |
| Population change (1975 to 2020) | +227.3% |
| Population change (2000 to 2020) | -38.1% |
| Median Age | 20.7 years (Male: 20.1, Female: 21.4) |
| Local Time | |
| Timezone | West Africa Time |
| Lat & Lng | 6.99472, 5.90496 |
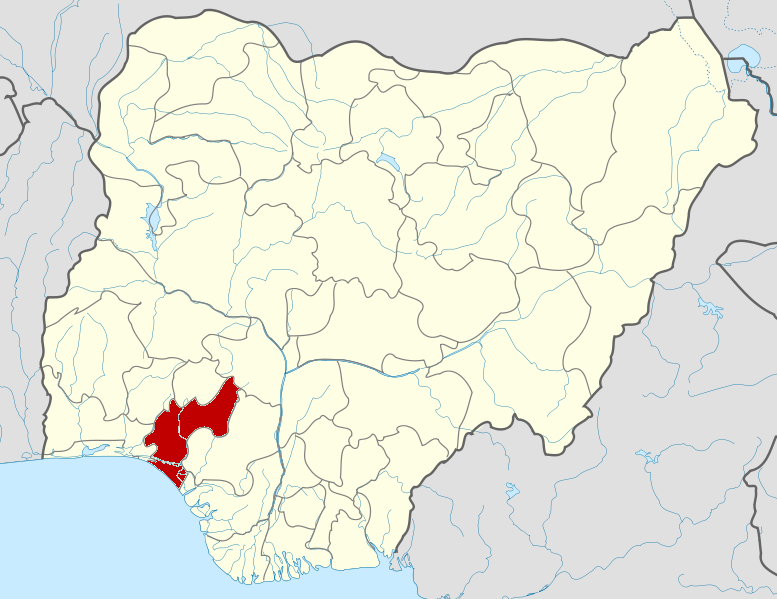
Map of Uzebba
Interactive Map
Uzebba Population
Years 1975 to 2030
| Data | 1975 | 1990 | 2000 | 2015 | 2020 | 2025* | 2030* |
|---|---|---|---|---|---|---|---|
| Population | 5,376 | 21,170 | 28,410 | 33,872 | 17,598 | 19,053 | 20,449 |
| Population Density | 2,606.5 / km² | 10,264.2 / km² | 13,774.5 / km² | 16,422.8 / km² | 8,532.4 / km² | 9,237.8 / km² | 9,914.7 / km² |
Uzebba Population change from 2000 to 2020
Decrease of 38.1% from year 2000 to 2020
| Location | Change since 1975 | Change since 1990 | Change since 2000 |
|---|---|---|---|
| Uzebba | +227.3% | -16.9% | -38.1% |
| Edo (state) | — | — | — |
| Nigeria | — | — | — |
Uzebba Median Age
Median Age: 20.7 years
| Location | Median Age | Median Age (Female) | Median Age (Male) |
|---|---|---|---|
| Uzebba | 20.7 yrs | 21.4 yrs | 20.1 yrs |
| Edo (state) | 20.9 yrs | 21.3 yrs | 20.4 yrs |
| Nigeria | 18.9 yrs | 19.3 yrs | 18.5 yrs |
Uzebba Population Density
Population Density: 8,532 / km²
| Location | Population | Area | Density |
|---|---|---|---|
| Uzebba | 17,598 | 2.063 km² | 8,532 / km² |
| Edo (state) | 4.1 million | 19,555.6 km² | 208 / km² |
| Nigeria | 182 million | 909,042.9 km² | 200 / km² |
Uzebba Historical and Projected Population
Estimated Population from 700 to 2100
- JRC (European Commission's Joint Research Centre) work on the GHS built-up grid
- CIESIN (Center for International Earth Science Information Network)
- [Link] Klein Goldewijk, K., Beusen, A., Doelman, J., and Stehfest, E.: Anthropogenic land use estimates for the Holocene – HYDE 3.2, Earth Syst. Sci. Data, 9, 927–953, https://doi.org/10.5194/essd-9-927-2017, 2017.
Human Development Index (HDI)
Statistic composite index of life expectancy, education, and per capita income.
Uzebba CO2 Emissions
Carbon Dioxide (CO2) Emissions Per Capita in Tonnes Per Year
| Location | CO2 Emissions | CO2 Emissions Per Capita | CO2 Emissions Intensity |
|---|---|---|---|
| Uzebba | 9,399 tn | 0.53 tn | 4,557.3 tons/km² |
| Edo (state) | 2,191,731 tn | 0.54 tn | 112.1 tons/km² |
| Nigeria | 86,705,254 tn | 0.48 tn | 95.4 tons/km² |
| 2013 CO2 emissions (tonnes/year) | 9,399 tn |
| 2013 CO2 emissions (tonnes/year) per capita | 0.53 tn |
| 2013 CO2 emissions intensity (tonnes/km²/year) | 4,557.3 tons/km² |
Natural Hazards Risk
Relative risk out of 10
| Hazard | Risk Level |
|---|---|
| Drought | Medium (4) |
* Risk, particularly concerning flood or landslide, may not be for the entire area.
- Dilley, M., R.S. Chen, U. Deichmann, A.L. Lerner-Lam, M. Arnold, J. Agwe, P. Buys, O. Kjekstad, B. Lyon, and G. Yetman. 2005. Natural Disaster Hotspots: A Global Risk Analysis. Washington, D.C.: World Bank. https://doi.org/10.1596/0-8213-5930-4.
- Center for Hazards and Risk Research - CHRR - Columbia University, Center for International Earth Science Information Network - CIESIN - Columbia University, and International Research Institute for Climate and Society - IRI - Columbia University. 2005. Global Drought Hazard Frequency and Distribution. Palisades, NY: NASA Socioeconomic Data and Applications Center (SEDAC). https://doi.org/10.7927/H4VX0DFT.
Uzebba
Uzebba is a village in the Owan local council of Edo State, Nigeria. Uzebba, along with its neighbouring towns and villages, Uhuse-Osi, Uhuse-Oke in Owan, Etsakor, and Akoko Edo, are known as Afemai. They collectively make up Edo-North Senatorial Dis..
Uzebba Wikipedia Page

About Our Data
The data on this page is estimated using a number of publicly available tools and resources. It is provided without warranty, and could contain inaccuracies. Use at your own risk.