Categories in Mateare
Industries
Business Distribution by Industry in Mateare
| Industry Description | Number of Establishments |
|---|---|
| Grocery stores and supermarkets | 29 |
| Churches | 28 |
| Restaurants | 16 |
| Shopping | 15 |
| Public parks | 8 |
| Education | 8 |
| Clothing stores | 8 |
| Pharmacies and drug stores | 7 |
| Religion | 7 |
| Food delivery services | 6 |
| Motorcycle repair | 6 |
| Hardware store | 6 |
| Bars, pubs and taverns | 6 |
| Car repair | 6 |
| Barbers | 6 |
Mateare Facts
| Area | 443.3 km² |
| Population | 40,164 |
| Male Population | 19,895 (49.5%) |
| Female Population | 20,269 (50.5%) |
| Population change (1975 to 2020) | +653.5% |
| Population change (2000 to 2020) | +82.2% |
| Median Age | 20.4 years (Male: 19.8, Female: 20.9) |
| GDP per capita (PPP) | $7,533 (2022) |
| Local Time | |
| Timezone | Central Standard Time |
| Lat & Lng | 12.23512, -86.42809 |
Map of Mateare
Interactive Map
Mateare Population
Years 1975 to 2030
| Data | 1975 | 1990 | 2000 | 2015 | 2020 | 2025* | 2030* |
|---|---|---|---|---|---|---|---|
| Population | 5,330 | 13,056 | 22,043 | 42,421 | 40,164 | 42,480 | 44,009 |
| Population Density | 12 / km² | 29.5 / km² | 49.7 / km² | 95.7 / km² | 90.6 / km² | 95.8 / km² | 99.3 / km² |
Mateare Population change from 2000 to 2020
Increase of 82.2% from year 2000 to 2020
| Location | Change since 1975 | Change since 1990 | Change since 2000 |
|---|---|---|---|
| Mateare | +653.5% | +207.6% | +82.2% |
| Managua Department | — | — | — |
| Nicaragua | — | — | — |
Mateare Median Age
Median Age: 20.4 years
| Location | Median Age | Median Age (Female) | Median Age (Male) |
|---|---|---|---|
| Mateare | 20.4 yrs | 20.9 yrs | 19.8 yrs |
| Managua Department | 22.9 yrs | 23.8 yrs | 21.9 yrs |
| Nicaragua | 20.4 yrs | 21.2 yrs | 19.7 yrs |
Mateare Population Density
Population Density: 90.6 / km²
| Location | Population | Area | Density |
|---|---|---|---|
| Mateare | 40,164 | 443.3 km² | 90.6 / km² |
| Managua Department | 1.4 million | 3,487.2 km² | 403 / km² |
| Nicaragua | 6.1 million | 128,508.4 km² | 47.1 / km² |
Mateare Historical and Projected Population
Estimated Population from 1930 to 2100
- JRC (European Commission's Joint Research Centre) work on the GHS built-up grid
- CIESIN (Center for International Earth Science Information Network)
- [Link] Klein Goldewijk, K., Beusen, A., Doelman, J., and Stehfest, E.: Anthropogenic land use estimates for the Holocene – HYDE 3.2, Earth Syst. Sci. Data, 9, 927–953, https://doi.org/10.5194/essd-9-927-2017, 2017.
Human Development Index (HDI)
Statistic composite index of life expectancy, education, and per capita income.
Mateare Gross Domestic Product (GDP)
GDP per capita, PPP (constant 2017 international $)
| Data | 1990 | 1995 | 2000 | 2005 | 2010 | 2015 | 2020 | 2022 |
|---|---|---|---|---|---|---|---|---|
| GDP per capita | $4,748 | $4,318 | $5,964 | $6,428 | $5,925 | $6,772 | $6,866 | $7,533 |
| Total GDP | $40.9M | $62.8M | $97.3M | $129M | $144.8M | $171.8M | $214M | $258.6M |
Mateare CO2 Emissions
Carbon Dioxide (CO2) Emissions Per Capita in Tonnes Per Year
| Location | CO2 Emissions | CO2 Emissions Per Capita | CO2 Emissions Intensity |
|---|---|---|---|
| Mateare | 50,356 tn | 1.25 tn | 113.6 tons/km² |
| Managua Department | 1,728,254 tn | 1.23 tn | 495.6 tons/km² |
| Nicaragua | 5,658,022 tn | 0.93 tn | 44 tons/km² |
| 2013 CO2 emissions (tonnes/year) | 50,356 tn |
| 2013 CO2 emissions (tonnes/year) per capita | 1.25 tn |
| 2013 CO2 emissions intensity (tonnes/km²/year) | 113.6 tons/km² |
Natural Hazards Risk
Relative risk out of 10
| Hazard | Risk Level |
|---|---|
| Drought | High (9) |
| Flood | High (8) |
| Earthquake | High (8) |
| Landslide | Medium (6) |
| Volcano | Medium (5) |
* Risk, particularly concerning flood or landslide, may not be for the entire area.
- Dilley, M., R.S. Chen, U. Deichmann, A.L. Lerner-Lam, M. Arnold, J. Agwe, P. Buys, O. Kjekstad, B. Lyon, and G. Yetman. 2005. Natural Disaster Hotspots: A Global Risk Analysis. Washington, D.C.: World Bank. https://doi.org/10.1596/0-8213-5930-4.
- Center for Hazards and Risk Research - CHRR - Columbia University, Center for International Earth Science Information Network - CIESIN - Columbia University, and Norwegian Geotechnical Institute - NGI. 2005. Global Landslide Hazard Distribution. Palisades, NY: NASA Socioeconomic Data and Applications Center (SEDAC). https://doi.org/10.7927/H4P848VZ.
- Center for Hazards and Risk Research - CHRR - Columbia University, Center for International Earth Science Information Network - CIESIN - Columbia University, and International Research Institute for Climate and Society - IRI - Columbia University. 2005. Global Drought Hazard Frequency and Distribution. Palisades, NY: NASA Socioeconomic Data and Applications Center (SEDAC). https://doi.org/10.7927/H4VX0DFT.
- Center for Hazards and Risk Research - CHRR - Columbia University, Center for International Earth Science Information Network - CIESIN - Columbia University. 2005. Global Flood Hazard Frequency and Distribution. Palisades, NY: NASA Socioeconomic Data and Applications Center (SEDAC). https://doi.org/10.7927/H4668B3D.
- Center for Hazards and Risk Research - CHRR - Columbia University, Center for International Earth Science Information Network - CIESIN - Columbia University. 2005. Global Volcano Hazard Frequency and Distribution. Palisades, NY: NASA Socioeconomic Data and Applications Center (SEDAC). https://doi.org/10.7927/H4BR8Q45.
- Center for Hazards and Risk Research - CHRR - Columbia University, Center for International Earth Science Information Network - CIESIN - Columbia University. 2005. Global Earthquake Hazard Distribution - Peak Ground Acceleration. Palisades, NY: NASA Socioeconomic Data and Applications Center (SEDAC). https://doi.org/10.7927/H4BZ63ZS.
Recent Nearby Earthquakes
Magnitude 3.0 and greater
| Date▼ | Time↕ | Magnitude↕ | Distance↕ | Depth↕ | Location↕ | Link |
|---|---|---|---|---|---|---|
| 1/31/18 | 12:09 AM | 4.5 | 25.6 km | 134,900 m | 6km SSE of La Paz Centro, Nicaragua | usgs.gov |
| 1/2/18 | 9:40 AM | 4.6 | 27.2 km | 133,920 m | 7km S of La Paz Centro, Nicaragua | usgs.gov |
| 8/28/17 | 9:40 PM | 4.2 | 31.6 km | 146,360 m | 2km E of El Crucero, Nicaragua | usgs.gov |
| 9/28/16 | 4:50 PM | 4.8 | 26.6 km | 10,000 m | 17km NE of La Paz Centro, Nicaragua | usgs.gov |
| 9/28/16 | 4:48 PM | 5.5 | 24.7 km | 7,560 m | 20km NNE of Nagarote, Nicaragua | usgs.gov |
| 9/15/16 | 7:45 AM | 4.2 | 23.8 km | 1,390 m | 16km ENE of La Paz Centro, Nicaragua | usgs.gov |
| 9/15/16 | 7:14 AM | 4.4 | 28.9 km | 2,710 m | 21km NE of La Paz Centro, Nicaragua | usgs.gov |
| 9/15/16 | 6:02 AM | 4.6 | 29.4 km | 10,000 m | 20km NE of La Paz Centro, Nicaragua | usgs.gov |
| 9/15/16 | 5:57 AM | 5.7 | 32.5 km | 10,000 m | 11km NNE of La Paz Centro, Nicaragua | usgs.gov |
| 6/22/16 | 5:24 AM | 4.5 | 14.3 km | 193,030 m | 6km SW of Ciudad Sandino, Nicaragua | usgs.gov |
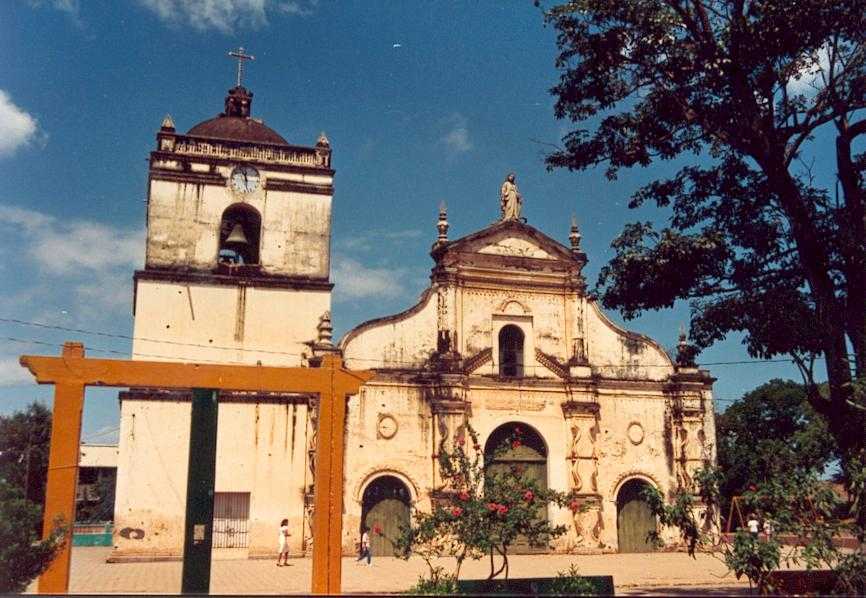
Mateare
Mateare is a municipality in the Managua department of Nicaragua. Mateare is 328 km² and has an estimated population of 27,000.
Mateare Wikipedia Page

About Our Data
The data on this page is estimated using a number of publicly available tools and resources. It is provided without warranty, and could contain inaccuracies. Use at your own risk.