Categories in Nagarote
Industries
Business Distribution by Industry in Nagarote
| Industry Description | Number of Establishments | Average Google Rating |
|---|---|---|
| Restaurants | 9 | 4.1 |
| Public parks | 5 | — |
Nagarote Facts
| Area | 547.3 km² |
| Population | 35,927 |
| Male Population | 17,928 (49.9%) |
| Female Population | 17,999 (50.1%) |
| Population change (1975 to 2020) | +81.7% |
| Population change (2000 to 2020) | +12.9% |
| Median Age | 22.4 years (Male: 21.8, Female: 23.1) |
| Neighborhoods | La Cumplida |
| Local Time | |
| Timezone | Central Standard Time |
| Lat & Lng | 12.26593, -86.56474 |
Map of Nagarote
Interactive Map
Nagarote Population
Years 1975 to 2020
| Data | 1975 | 1990 | 2000 | 2015 | 2020 |
|---|---|---|---|---|---|
| Population | 19,778 | 27,714 | 31,836 | 34,273 | 35,927 |
| Population Density | 36.1 / km² | 50.6 / km² | 58.2 / km² | 62.6 / km² | 65.6 / km² |
Nagarote Population change from 2000 to 2015
Increase of 7.7% from year 2000 to 2015
| Location | Change since 1975 | Change since 1990 | Change since 2000 |
|---|---|---|---|
| Nagarote | +73.3% | +23.7% | +7.7% |
| León Department | +44.1% | +10% | +0.2% |
| Nicaragua | +117.4% | +46.7% | +21% |
Nagarote Median Age
Median Age: 22.4 years
| Location | Median Age | Median Age (Female) | Median Age (Male) |
|---|---|---|---|
| Nagarote | 22.4 yrs | 23.1 yrs | 21.8 yrs |
| León Department | 21.9 yrs | 22.9 yrs | 20.8 yrs |
| Nicaragua | 20.4 yrs | 21.2 yrs | 19.7 yrs |
Nagarote Population Density
Population Density: 65.6 / km²
| Location | Population | Area | Density |
|---|---|---|---|
| Nagarote | 35,927 | 547.3 km² | 65.6 / km² |
| León Department | 364,425 | 5,110 km² | 71.3 / km² |
| Nicaragua | 6.1 million | 128,508.4 km² | 47.1 / km² |
Nagarote Historical and Projected Population
Estimated Population from 0 to 2100
- JRC (European Commission's Joint Research Centre) work on the GHS built-up grid
- CIESIN (Center for International Earth Science Information Network)
- [Link] Klein Goldewijk, K., Beusen, A., Doelman, J., and Stehfest, E.: Anthropogenic land use estimates for the Holocene – HYDE 3.2, Earth Syst. Sci. Data, 9, 927–953, https://doi.org/10.5194/essd-9-927-2017, 2017.
Price Distribution
Business distribution by price for Nagarote
Human Development Index (HDI)
Statistic composite index of life expectancy, education, and per capita income.
Nagarote CO2 Emissions
Carbon Dioxide (CO2) Emissions Per Capita in Tonnes Per Year
| Location | CO2 Emissions | CO2 Emissions Per Capita | CO2 Emissions Intensity |
|---|---|---|---|
| Nagarote | 39,270 tn | 1.09 tn | 71.8 tons/km² |
| León Department | 395,084 tn | 1.08 tn | 77.3 tons/km² |
| Nicaragua | 5,658,022 tn | 0.93 tn | 44 tons/km² |
| 2013 CO2 emissions (tonnes/year) | 39,270 tn |
| 2013 CO2 emissions (tonnes/year) per capita | 1.09 tn |
| 2013 CO2 emissions intensity (tonnes/km²/year) | 71.8 tons/km² |
Natural Hazards Risk
Relative risk out of 10
| Hazard | Risk Level |
|---|---|
| Drought | High (9) |
| Flood | High (8) |
| Earthquake | High (8.4) |
| Cyclone | Medium (5) |
| Landslide | Medium (6) |
| Volcano | Medium (5) |
* Risk, particularly concerning flood or landslide, may not be for the entire area.
- Dilley, M., R.S. Chen, U. Deichmann, A.L. Lerner-Lam, M. Arnold, J. Agwe, P. Buys, O. Kjekstad, B. Lyon, and G. Yetman. 2005. Natural Disaster Hotspots: A Global Risk Analysis. Washington, D.C.: World Bank. https://doi.org/10.1596/0-8213-5930-4.
- Center for Hazards and Risk Research - CHRR - Columbia University, Center for International Earth Science Information Network - CIESIN - Columbia University, and Norwegian Geotechnical Institute - NGI. 2005. Global Landslide Hazard Distribution. Palisades, NY: NASA Socioeconomic Data and Applications Center (SEDAC). https://doi.org/10.7927/H4P848VZ.
- Center for Hazards and Risk Research - CHRR - Columbia University, Center for International Earth Science Information Network - CIESIN - Columbia University, International Bank for Reconstruction and Development - The World Bank, and United Nations Environment Programme Global Resource Information Database Geneva - UNEP/GRID-Geneva. 2005. Global Cyclone Hazard Frequency and Distribution. Palisades, NY: NASA Socioeconomic Data and Applications Center (SEDAC). https://doi.org/10.7927/H4CZ353K.
- Center for Hazards and Risk Research - CHRR - Columbia University, Center for International Earth Science Information Network - CIESIN - Columbia University, and International Research Institute for Climate and Society - IRI - Columbia University. 2005. Global Drought Hazard Frequency and Distribution. Palisades, NY: NASA Socioeconomic Data and Applications Center (SEDAC). https://doi.org/10.7927/H4VX0DFT.
- Center for Hazards and Risk Research - CHRR - Columbia University, Center for International Earth Science Information Network - CIESIN - Columbia University. 2005. Global Flood Hazard Frequency and Distribution. Palisades, NY: NASA Socioeconomic Data and Applications Center (SEDAC). https://doi.org/10.7927/H4668B3D.
- Center for Hazards and Risk Research - CHRR - Columbia University, Center for International Earth Science Information Network - CIESIN - Columbia University. 2005. Global Volcano Hazard Frequency and Distribution. Palisades, NY: NASA Socioeconomic Data and Applications Center (SEDAC). https://doi.org/10.7927/H4BR8Q45.
- Center for Hazards and Risk Research - CHRR - Columbia University, Center for International Earth Science Information Network - CIESIN - Columbia University. 2005. Global Earthquake Hazard Distribution - Peak Ground Acceleration. Palisades, NY: NASA Socioeconomic Data and Applications Center (SEDAC). https://doi.org/10.7927/H4BZ63ZS.
Recent Nearby Earthquakes
Magnitude 3.0 and greater
| Date▼ | Time↕ | Magnitude↕ | Distance↕ | Depth↕ | Location↕ | Link |
|---|---|---|---|---|---|---|
| 3/24/19 | 4:19 PM | 4.5 | 31.4 km | 145,760 m | 8km SE of Leon, Nicaragua | usgs.gov |
| 3/24/19 | 9:30 AM | 5.3 | 30.4 km | 93,730 m | 30km SW of Nagarote, Nicaragua | usgs.gov |
| 9/12/18 | 6:29 AM | 5.4 | 25.2 km | 103,000 m | 20km SW of La Paz Centro, Nicaragua | usgs.gov |
| 1/31/18 | 12:09 AM | 4.5 | 10.3 km | 134,900 m | 6km SSE of La Paz Centro, Nicaragua | usgs.gov |
| 1/2/18 | 9:40 AM | 4.6 | 12.1 km | 133,920 m | 7km S of La Paz Centro, Nicaragua | usgs.gov |
| 8/20/17 | 3:39 PM | 4.9 | 24.1 km | 162,640 m | 9km WNW of La Paz Centro, Nicaragua | usgs.gov |
| 6/18/17 | 2:45 AM | 4.1 | 30.1 km | 74,460 m | 26km SSW of La Paz Centro, Nicaragua | usgs.gov |
| 9/28/16 | 4:50 PM | 4.8 | 19.4 km | 10,000 m | 17km NE of La Paz Centro, Nicaragua | usgs.gov |
| 9/28/16 | 4:48 PM | 5.5 | 20.2 km | 7,560 m | 20km NNE of Nagarote, Nicaragua | usgs.gov |
| 9/15/16 | 7:45 AM | 4.2 | 16.9 km | 1,390 m | 16km ENE of La Paz Centro, Nicaragua | usgs.gov |
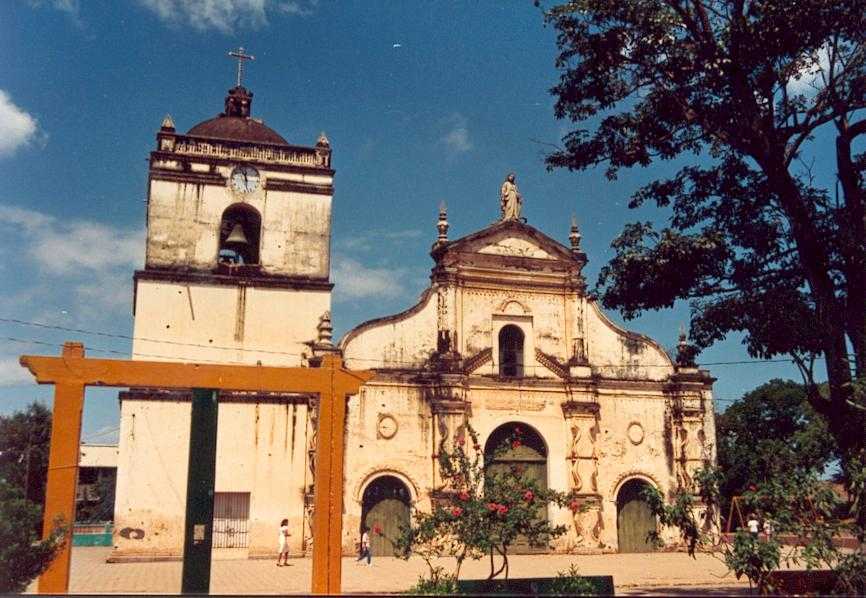
Nagarote
Nagarote (Spanish pronunciation: [naɣaˈɾote]) is a municipality in the León department of Nicaragua with a population of approximately 32,000 people. city of Nagarote itself is home to about 18,000 people whilst the rural areas surrounding it are in..
Nagarote Wikipedia Page

About Our Data
The data on this page is estimated using a number of publicly available tools and resources. It is provided without warranty, and could contain inaccuracies. Use at your own risk.