Categories in Drogeham
Industries
Business Distribution by Industry in Drogeham
| Industry Description | Number of Establishments | Average Google Rating |
|---|---|---|
| General contractors | 17 | 4 |
| Shopping | 14 | 4.2 |
| Other construction | 14 | 4.8 |
| Beauty salons | 10 | 4.9 |
Drogeham Facts
| Area | 10.5 km² |
| Population | 2,022 |
| Male Population | 1,026 (50.7%) |
| Female Population | 996 (49.3%) |
| Population change (1975 to 2020) | +30.8% |
| Population change (2000 to 2020) | +10.3% |
| Median Age | 40.5 years (Male: 39.6, Female: 41.4) |
| Local Time | |
| Timezone | Central European Summer Time |
| Lat & Lng | 53.20213, 6.11183 |
| Postal Codes | 9289 |
Map of Drogeham
Interactive Map
Drogeham Population
Years 1975 to 2020
| Data | 1975 | 1990 | 2000 | 2015 | 2020 |
|---|---|---|---|---|---|
| Population | 1,546 | 1,664 | 1,833 | 1,987 | 2,022 |
| Population Density | 147.2 / km² | 158.5 / km² | 174.6 / km² | 189.2 / km² | 192.6 / km² |
Drogeham Population change from 2000 to 2015
Increase of 8.4% from year 2000 to 2015
| Location | Change since 1975 | Change since 1990 | Change since 2000 |
|---|---|---|---|
| Drogeham | +28.5% | +19.4% | +8.4% |
| Friesland | +18.8% | +9.6% | +4.1% |
| Netherlands | +24.3% | +13.4% | +6.5% |
Drogeham Median Age
Median Age: 40.5 years
| Location | Median Age | Median Age (Female) | Median Age (Male) |
|---|---|---|---|
| Drogeham | 40.5 yrs | 41.4 yrs | 39.6 yrs |
| Friesland | 41.9 yrs | 42.9 yrs | 41 yrs |
| Netherlands | 41 yrs | 41.7 yrs | 40.2 yrs |
Drogeham Population Density
Population Density: 193 / km²
| Location | Population | Area | Density |
|---|---|---|---|
| Drogeham | 2,022 | 10.5 km² | 193 / km² |
| Friesland | 653,256 | 5,751.4 km² | 114 / km² |
| Netherlands | 16.9 million | 41,398.3 km² | 409 / km² |
Drogeham Historical and Projected Population
Estimated Population from 0 to 2100
- JRC (European Commission's Joint Research Centre) work on the GHS built-up grid
- CIESIN (Center for International Earth Science Information Network)
- [Link] Klein Goldewijk, K., Beusen, A., Doelman, J., and Stehfest, E.: Anthropogenic land use estimates for the Holocene – HYDE 3.2, Earth Syst. Sci. Data, 9, 927–953, https://doi.org/10.5194/essd-9-927-2017, 2017.
Area Codes
Percentage Area Codes used by businesses in Drogeham
Human Development Index (HDI)
Statistic composite index of life expectancy, education, and per capita income.
Drogeham CO2 Emissions
Carbon Dioxide (CO2) Emissions Per Capita in Tonnes Per Year
| Location | CO2 Emissions | CO2 Emissions Per Capita | CO2 Emissions Intensity |
|---|---|---|---|
| Drogeham | 22,264 tn | 11.01 tn | 2,120.4 tons/km² |
| Friesland | 4,518,084 tn | 6.92 tn | 785.6 tons/km² |
| Netherlands | 167,743,568 tn | 9.91 tn | 4,051.9 tons/km² |
| 2013 CO2 emissions (tonnes/year) | 22,264 tn |
| 2013 CO2 emissions (tonnes/year) per capita | 11.01 tn |
| 2013 CO2 emissions intensity (tonnes/km²/year) | 2,120.4 tons/km² |
Recent Nearby Earthquakes
Magnitude 3.0 and greater
| Date▼ | Time↕ | Magnitude↕ | Distance↕ | Depth↕ | Location↕ | Link |
|---|---|---|---|---|---|---|
| 5/22/19 | 3:48 AM | 3.2 | 38.1 km | 10,000 m | 8km NNE of Winsum, Netherlands | usgs.gov |
| 2/7/13 | 11:19 PM | 3.4 | 41.2 km | 10,000 m | 11km NNE of Winsum, Netherlands | usgs.gov |
| 8/16/12 | 8:30 PM | 3.4 | 45.5 km | 3,000 m | The Netherlands | usgs.gov |
| 10/30/08 | 5:54 AM | 3.3 | 38.1 km | 3,000 m | The Netherlands | usgs.gov |
| 8/8/06 | 5:03 AM | 3.8 | 33.5 km | 10,000 m | The Netherlands | usgs.gov |
| 6/21/04 | 11:32 PM | 3 | 43.4 km | 5,000 m | The Netherlands | usgs.gov |
| 11/10/03 | 12:22 AM | 3.1 | 24.1 km | 10,000 m | The Netherlands | usgs.gov |
| 2/19/97 | 9:53 PM | 3 | 48.5 km | 5,000 m | The Netherlands | usgs.gov |
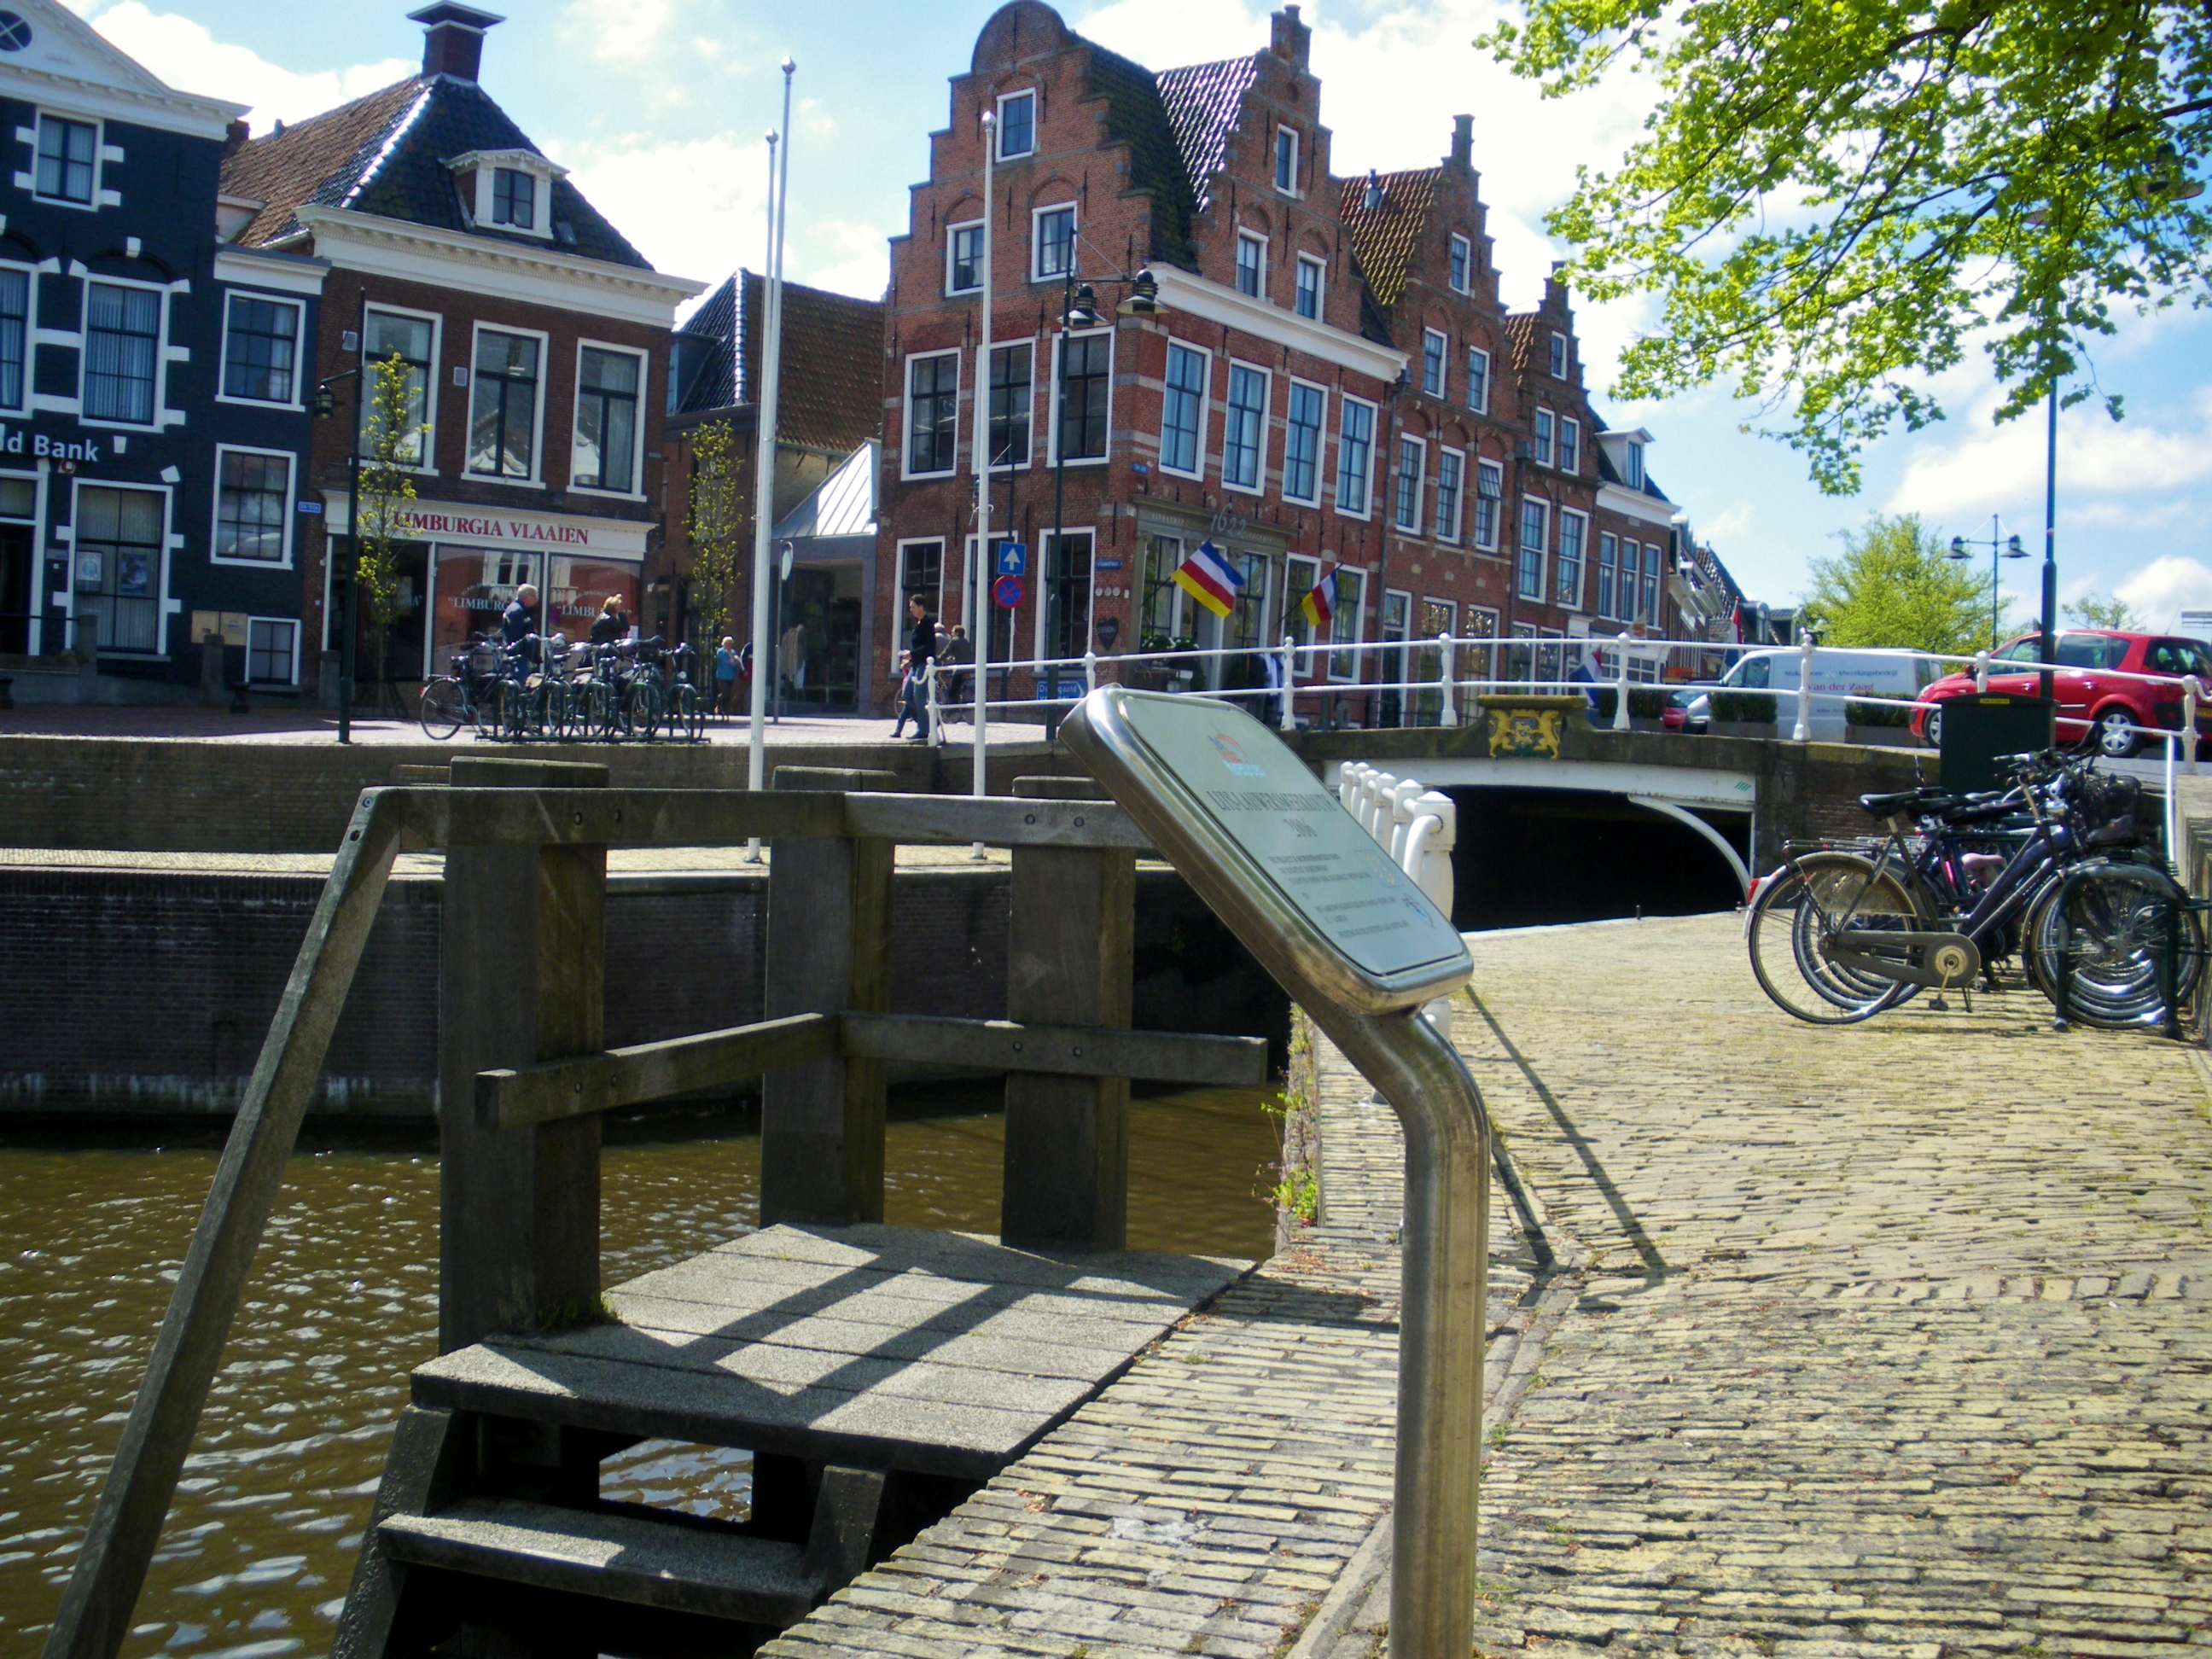
Drogeham
Drogeham (West Frisian: Droegeham) is a small town of about 1,600 inhabitants in the Dutch province of Friesland. It is in a rural area of the municipality of Achtkarspelen. Agriculture still plays an important part in the town, but small-scale indus..
Drogeham Wikipedia Page
About Our Data
The data on this page is estimated using a number of publicly available tools and resources. It is provided without warranty, and could contain inaccuracies. Use at your own risk.