Categories in Kimswerd
Industries
Business Distribution by Industry in Kimswerd
| Industry Description | Number of Establishments | Average Google Rating |
|---|---|---|
| Other construction | 7 | 4.9 |
| General contractors | 6 | 5 |
Kimswerd Facts
| Area | 0.2 km² |
| Population | 218 |
| Male Population | 109 (50.0%) |
| Female Population | 109 (50.0%) |
| Population change (1975 to 2020) | -18.7% |
| Population change (2000 to 2020) | -8.4% |
| Median Age | 42.4 years (Male: 41.6, Female: 43.1) |
| Area Codes | 517 |
| Local Time | |
| Timezone | Central European Summer Time |
| Lat & Lng | 53.14122, 5.43752 |
| Postal Codes | 8821 |
Map of Kimswerd
Interactive Map
Kimswerd Population
Years 1975 to 2020
| Data | 1975 | 1990 | 2000 | 2015 | 2020 |
|---|---|---|---|---|---|
| Population | 268 | 274 | 238 | 213 | 218 |
| Population Density | 1,429.3 / km² | 1,461.3 / km² | 1,269.3 / km² | 1,136 / km² | 1,162.7 / km² |
Sources: JRC (European Commission's Joint Research Centre) work on the GHS built-up grid
Kimswerd Population change from 2000 to 2015
Decrease of 10.5% from year 2000 to 2015
| Location | Change since 1975 | Change since 1990 | Change since 2000 |
|---|---|---|---|
| Kimswerd | -20.5% | -22.3% | -10.5% |
| Friesland | +18.8% | +9.6% | +4.1% |
| Netherlands | +24.3% | +13.4% | +6.5% |
Sources: JRC (European Commission's Joint Research Centre) work on the GHS built-up grid
Kimswerd Median Age
Median Age: 42.4 years
| Location | Median Age | Median Age (Female) | Median Age (Male) |
|---|---|---|---|
| Kimswerd | 42.4 yrs | 43.1 yrs | 41.6 yrs |
| Friesland | 41.9 yrs | 42.9 yrs | 41 yrs |
| Netherlands | 41 yrs | 41.7 yrs | 40.2 yrs |
Sources: CIESIN (Center for International Earth Science Information Network)
Kimswerd Population Density
Population Density: 1,163 / km²
| Location | Population | Area | Density |
|---|---|---|---|
| Kimswerd | 218 | 0.188 km² | 1,163 / km² |
| Friesland | 653,256 | 5,751.4 km² | 114 / km² |
| Netherlands | 16.9 million | 41,398.3 km² | 409 / km² |
Sources: JRC (European Commission's Joint Research Centre) work on the GHS built-up grid
Kimswerd Historical and Projected Population
Estimated Population from 0 to 2100
Sources:
- JRC (European Commission's Joint Research Centre) work on the GHS built-up grid
- CIESIN (Center for International Earth Science Information Network)
- [Link] Klein Goldewijk, K., Beusen, A., Doelman, J., and Stehfest, E.: Anthropogenic land use estimates for the Holocene – HYDE 3.2, Earth Syst. Sci. Data, 9, 927–953, https://doi.org/10.5194/essd-9-927-2017, 2017.
Human Development Index (HDI)
Statistic composite index of life expectancy, education, and per capita income.
Source: [Link] Kummu, M., Taka, M. &Guillaume, J. Gridded global datasets for Gross Domestic Product and Human Development Index over 1990–2015. Sci Data 5, 180004 (2018) doi:10.1038/sdata.2018.4
Kimswerd CO2 Emissions
Carbon Dioxide (CO2) Emissions Per Capita in Tonnes Per Year
| Location | CO2 Emissions | CO2 Emissions Per Capita | CO2 Emissions Intensity |
|---|---|---|---|
| Kimswerd | 2,470 tn | 11.33 tn | 13,172.7 tons/km² |
| Friesland | 4,518,084 tn | 6.92 tn | 785.6 tons/km² |
| Netherlands | 167,743,568 tn | 9.91 tn | 4,051.9 tons/km² |
Sources: [Link] Moran, D., Kanemoto K; Jiborn, M., Wood, R., Többen, J., and Seto, K.C. (2018) Carbon footprints of 13,000 cities. Environmental Research Letters DOI: 10.1088/1748-9326/aac72a
Kimswerd CO2 Emissions
| 2013 CO2 emissions (tonnes/year) | 2,470 tn |
| 2013 CO2 emissions (tonnes/year) per capita | 11.33 tn |
| 2013 CO2 emissions intensity (tonnes/km²/year) | 13,172.7 tons/km² |
Recent Nearby Earthquakes
Magnitude 3.0 and greater
| Date▼ | Time↕ | Magnitude↕ | Distance↕ | Depth↕ | Location↕ | Link |
|---|---|---|---|---|---|---|
| 5/22/19 | 3:48 AM | 3.2 | 81.6 km | 10,000 m | 8km NNE of Winsum, Netherlands | usgs.gov |
| 2/7/13 | 11:19 PM | 3.4 | 84.5 km | 10,000 m | 11km NNE of Winsum, Netherlands | usgs.gov |
| 8/16/12 | 8:30 PM | 3.4 | 90.6 km | 3,000 m | The Netherlands | usgs.gov |
| 10/30/08 | 5:54 AM | 3.3 | 82.1 km | 3,000 m | The Netherlands | usgs.gov |
| 8/8/06 | 5:03 AM | 3.8 | 77.4 km | 10,000 m | The Netherlands | usgs.gov |
| 6/21/04 | 11:32 PM | 3 | 72.7 km | 5,000 m | The Netherlands | usgs.gov |
| 11/10/03 | 12:22 AM | 3.1 | 64.3 km | 10,000 m | The Netherlands | usgs.gov |
| 9/10/01 | 4:30 AM | 3.4 | 99.5 km | 10,000 m | The Netherlands | usgs.gov |
| 9/9/01 | 6:58 AM | 3.8 | 85.4 km | 10,000 m | The Netherlands | usgs.gov |
| 2/19/97 | 9:53 PM | 3 | 88.8 km | 5,000 m | The Netherlands | usgs.gov |
Source: U.S. Geological Survey (USGS)
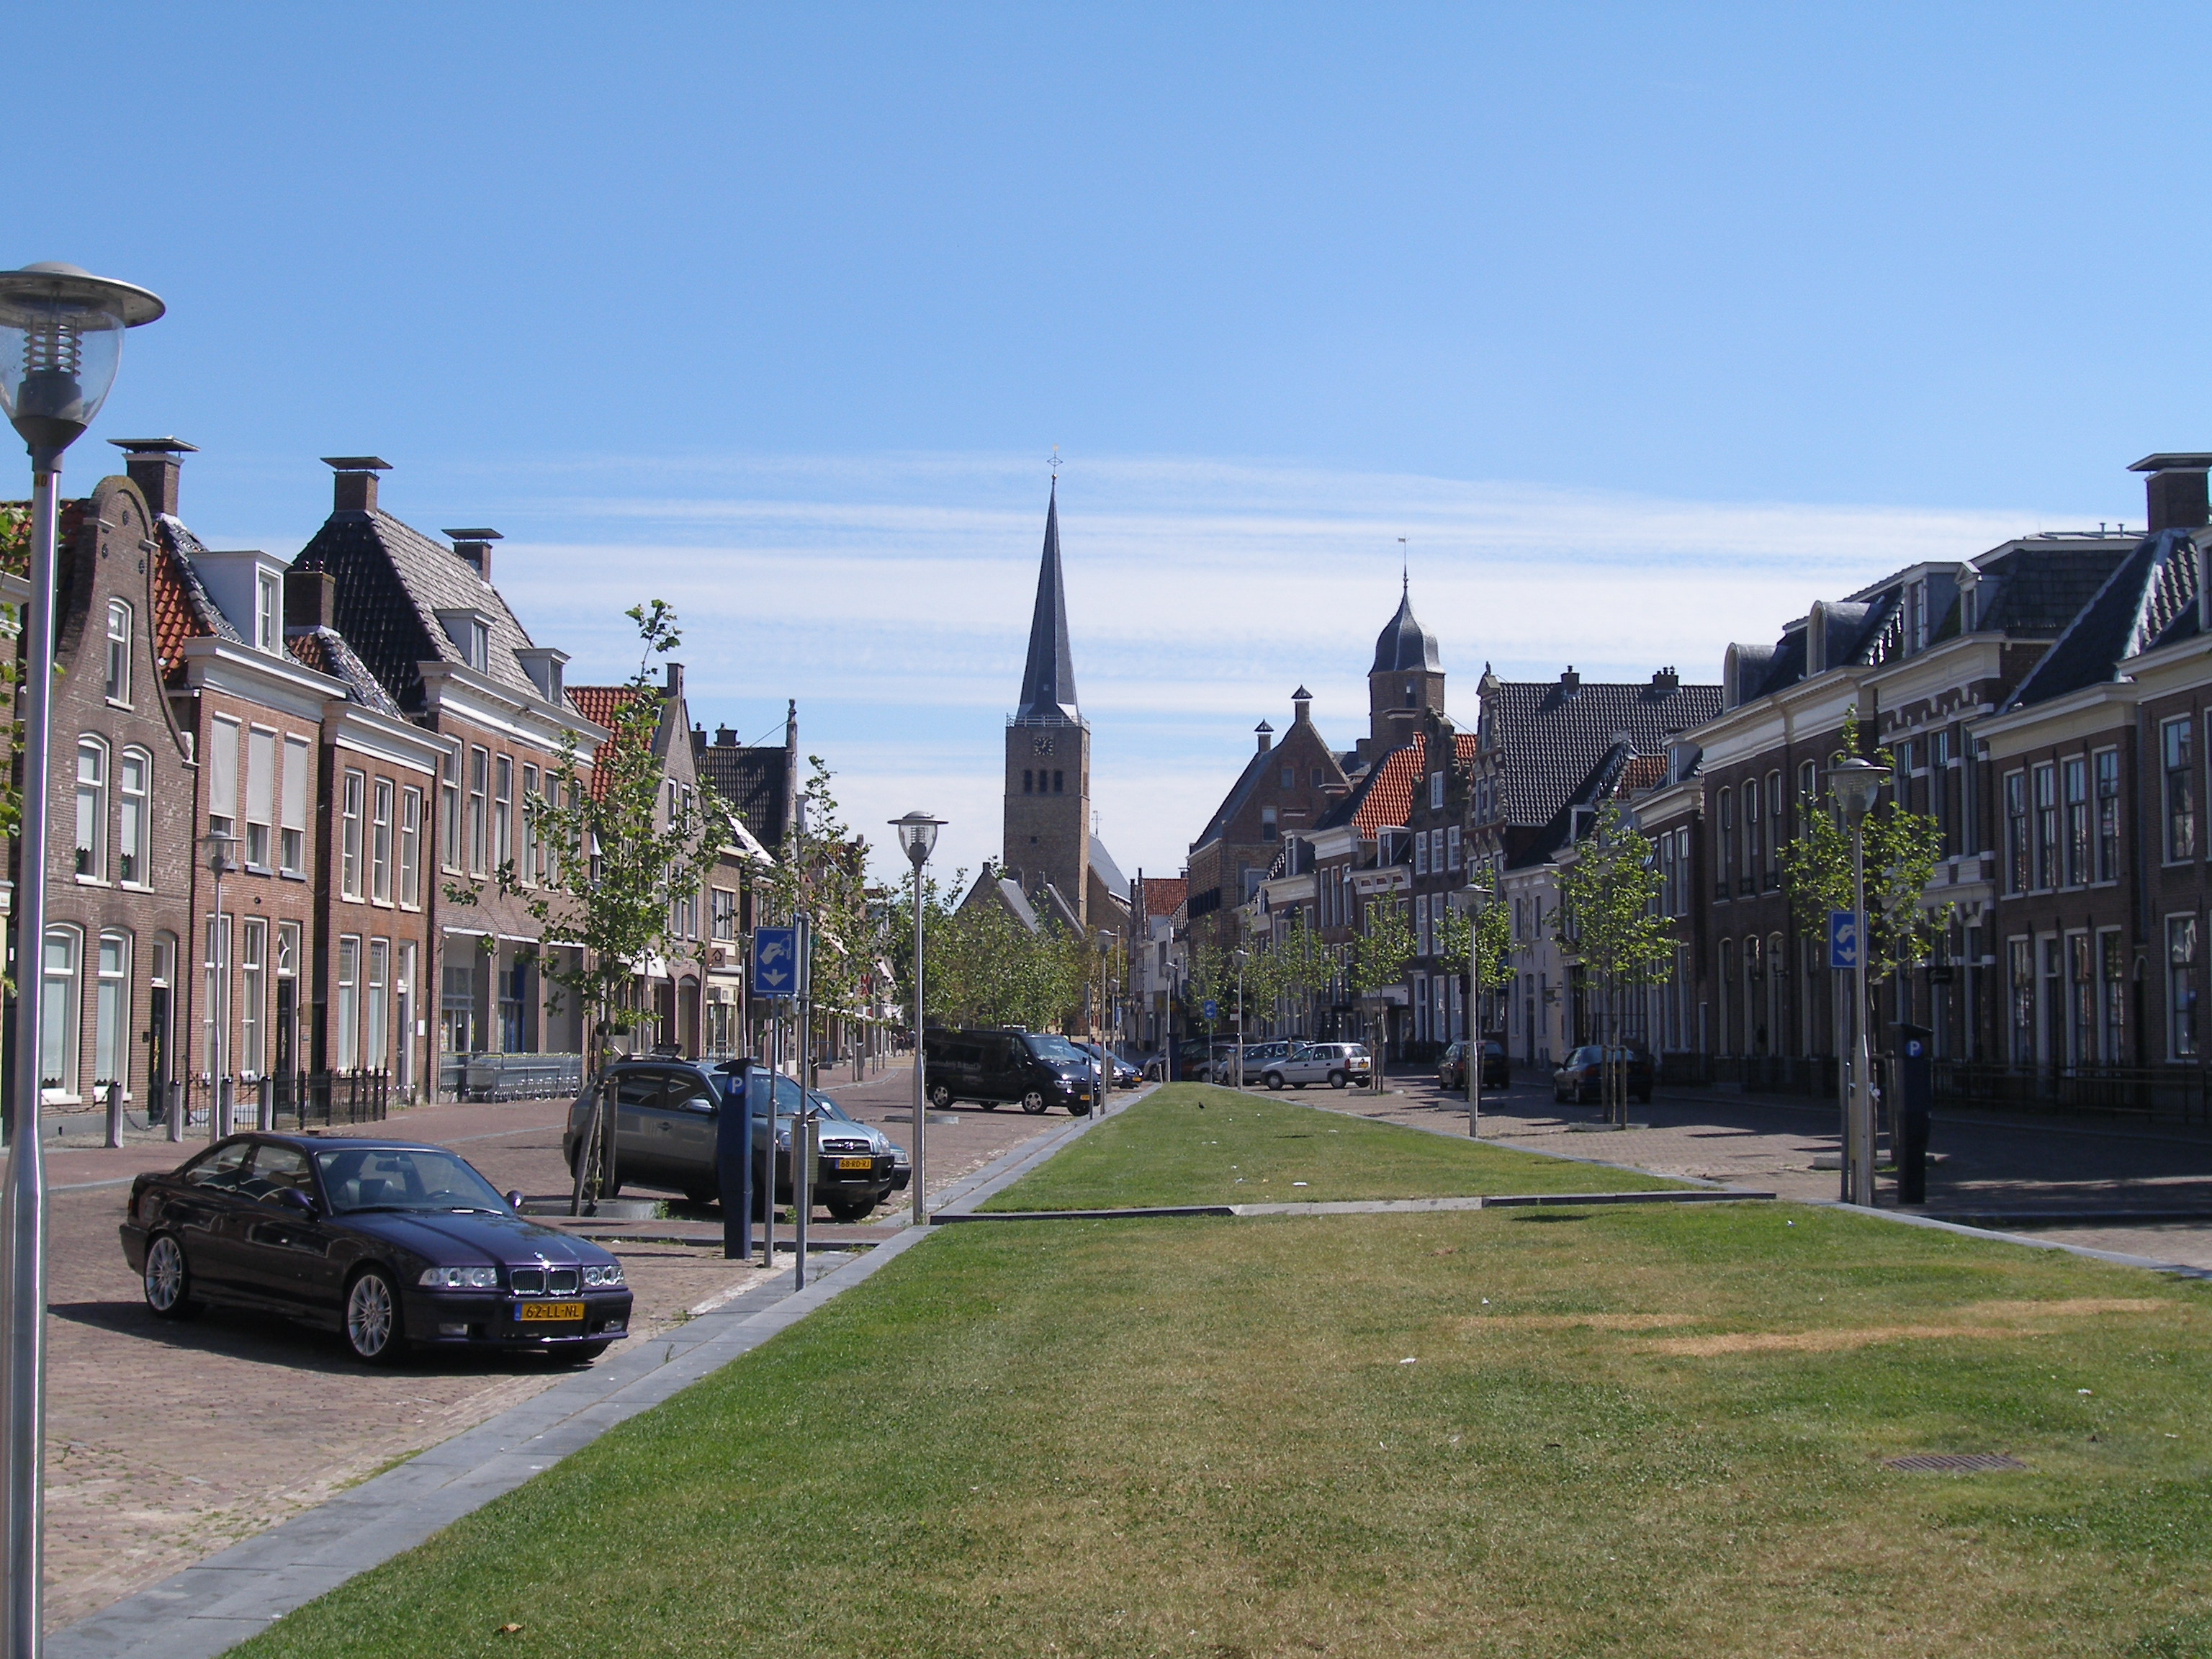
Kimswerd
Kimswerd (West Frisian: Kimswert) is a village in Súdwest-Fryslân municipality in the province of Friesland, the Netherlands. It had a population of around 607 in 2004.
Kimswerd Wikipedia Page


About Our Data
The data on this page is estimated using a number of publicly available tools and resources. It is provided without warranty, and could contain inaccuracies. Use at your own risk.