Categories in Rhoon
Industries
Business Distribution by Industry in Rhoon
| Industry Description | Number of Establishments | Average Age of Business |
|---|---|---|
| Construction of buildings | 186 | — |
| Corporate management | 134 | 22 years |
| Accountants | 67 | — |
| Electronics stores | 64 | — |
| Beauty salons | 52 | — |
| Shopping | 52 | — |
| Other construction | 49 | — |
| Transportation logistics | 40 | 36 years |
Rhoon Facts
| Area | 16.1 km² |
| Population | 17,227 |
| Male Population | 8,548 (49.6%) |
| Female Population | 8,679 (50.4%) |
| Population change (1975 to 2020) | +324.2% |
| Population change (2000 to 2020) | +85.4% |
| Median Age | 41 years (Male: 40.6, Female: 41.4) |
| Area Codes | 10 |
| Neighborhoods | Waalhaven-Zuid, Eemhaven, Zuiderpark, Centrum, Waalhaven |
| Local Time | |
| Timezone | Central European Summer Time |
| Lat & Lng | 51.85750, 4.42222 |
| Postal Codes | 3161, 3162, 3176 |
Map of Rhoon
Interactive Map
Rhoon Population
Years 1975 to 2020
| Data | 1975 | 1990 | 2000 | 2015 | 2020 |
|---|---|---|---|---|---|
| Population | 4,061 | 6,928 | 9,290 | 16,783 | 17,227 |
| Population Density | 251.8 / km² | 429.6 / km² | 576.1 / km² | 1,040.8 / km² | 1,068.3 / km² |
Rhoon Population change from 2000 to 2015
Increase of 80.7% from year 2000 to 2015
| Location | Change since 1975 | Change since 1990 | Change since 2000 |
|---|---|---|---|
| Rhoon | +313.3% | +142.2% | +80.7% |
| South Holland | +21.1% | +12.1% | +5.9% |
| Netherlands | +24.3% | +13.4% | +6.5% |
Rhoon Median Age
Median Age: 41 years
| Location | Median Age | Median Age (Female) | Median Age (Male) |
|---|---|---|---|
| Rhoon | 41 yrs | 41.4 yrs | 40.6 yrs |
| South Holland | 40 yrs | 40.9 yrs | 39.1 yrs |
| Netherlands | 41 yrs | 41.7 yrs | 40.2 yrs |
Rhoon Population Density
Population Density: 1,068 / km²
| Location | Population | Area | Density |
|---|---|---|---|
| Rhoon | 17,227 | 16.1 km² | 1,068 / km² |
| South Holland | 3.6 million | 3,417.4 km² | 1,048 / km² |
| Netherlands | 16.9 million | 41,398.3 km² | 409 / km² |
Rhoon Historical and Projected Population
Estimated Population from 1700 to 2100
- JRC (European Commission's Joint Research Centre) work on the GHS built-up grid
- CIESIN (Center for International Earth Science Information Network)
- [Link] Klein Goldewijk, K., Beusen, A., Doelman, J., and Stehfest, E.: Anthropogenic land use estimates for the Holocene – HYDE 3.2, Earth Syst. Sci. Data, 9, 927–953, https://doi.org/10.5194/essd-9-927-2017, 2017.
Neighborhoods in Rhoon
Percentage of businesses by neighborhood in Rhoon
Area Codes
Percentage Area Codes used by businesses in Rhoon
Postal Codes
Percentage of businesses by Postal Codes in Rhoon
Price Distribution
Business distribution by price for Rhoon
Human Development Index (HDI)
Statistic composite index of life expectancy, education, and per capita income.
Rhoon CO2 Emissions
Carbon Dioxide (CO2) Emissions Per Capita in Tonnes Per Year
| Location | CO2 Emissions | CO2 Emissions Per Capita | CO2 Emissions Intensity |
|---|---|---|---|
| Rhoon | 197,888 tn | 11.49 tn | 12,272.2 tons/km² |
| South Holland | 38,003,786 tn | 10.61 tn | 11,120.8 tons/km² |
| Netherlands | 167,743,568 tn | 9.91 tn | 4,051.9 tons/km² |
| 2013 CO2 emissions (tonnes/year) | 197,888 tn |
| 2013 CO2 emissions (tonnes/year) per capita | 11.49 tn |
| 2013 CO2 emissions intensity (tonnes/km²/year) | 12,272.2 tons/km² |
Recent Nearby Earthquakes
Magnitude 3.0 and greater
| Date▼ | Time↕ | Magnitude↕ | Distance↕ | Depth↕ | Location↕ | Link |
|---|---|---|---|---|---|---|
| 9/10/01 | 4:30 AM | 3.4 | 69.1 km | 10,000 m | The Netherlands | usgs.gov |
| 9/9/01 | 6:58 AM | 3.8 | 84.1 km | 10,000 m | The Netherlands | usgs.gov |
| 9/11/99 | 12:32 PM | 3.7 | 85.2 km | 10,000 m | The Netherlands | usgs.gov |
| 9/21/94 | 1:12 AM | 3.4 | 79 km | 5,000 m | The Netherlands | usgs.gov |
| 8/6/94 | 6:02 PM | 3 | 73.2 km | 10,000 m | The Netherlands | usgs.gov |
| 12/1/89 | 8:09 PM | 3.1 | 61 km | 10,000 m | The Netherlands | usgs.gov |
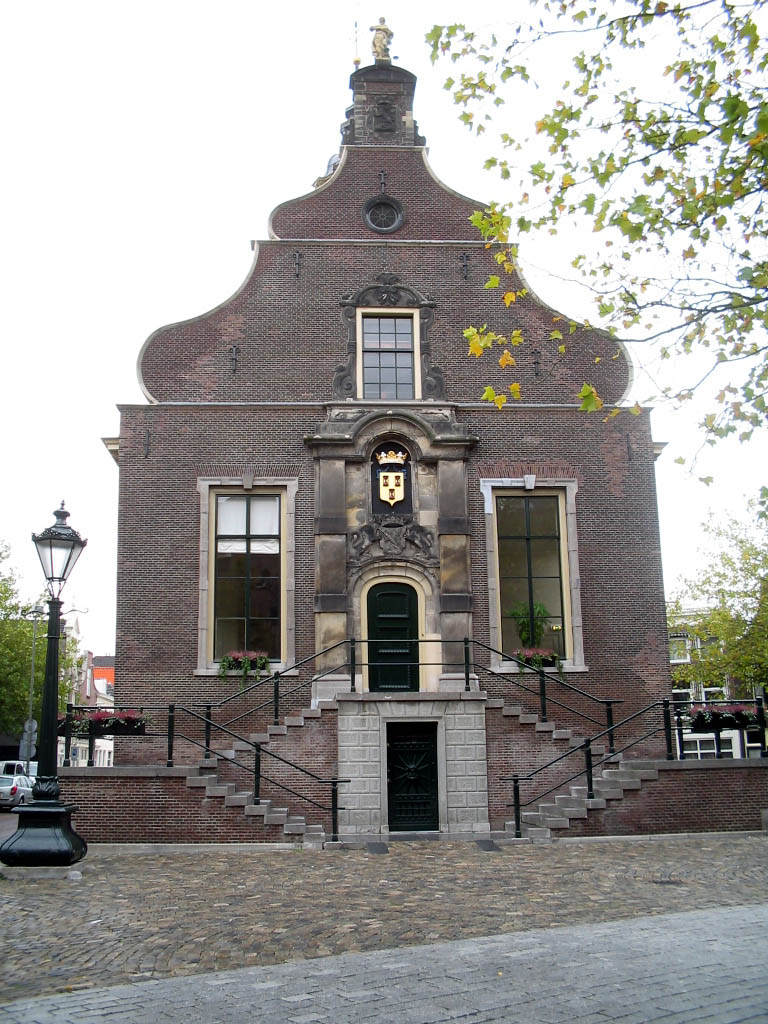
Rhoon
is a village that borders the municipality of the city of Rotterdam, South Holland, the Netherlands. to its history it was established in 1199 and was ruled by the lords of Duiveland. In the 14th century the village was struck by many floods. In t..
Rhoon Wikipedia Page


About Our Data
The data on this page is estimated using a number of publicly available tools and resources. It is provided without warranty, and could contain inaccuracies. Use at your own risk.