Categories in Ysselsteyn
Industries
Business Distribution by Industry in Ysselsteyn
| Industry Description | Number of Establishments | Average Google Rating |
|---|---|---|
| Shopping | 31 | 4.2 |
| All food and beverage | 12 | 4.3 |
| General contractors | 11 | 4.5 |
| Other construction | 11 | 4.5 |
| Grocery stores and supermarkets | 10 | 4 |
| Education | 10 | 3 |
| Construction of buildings | 8 | 4.5 |
| Office supplies and stationery stores | 6 | — |
| Restaurants | 5 | 4 |
Ysselsteyn Facts
| Area | 33.3 km² |
| Population | 5,630 |
| Male Population | 2,832 (50.3%) |
| Female Population | 2,798 (49.7%) |
| Population change (1975 to 2020) | +119.6% |
| Population change (2000 to 2020) | +34.0% |
| Median Age | 42.6 years (Male: 42, Female: 43.2) |
| Local Time | |
| Timezone | Central European Summer Time |
| Lat & Lng | 51.49000, 5.89722 |
| Postal Codes | 5766, 5809, 5812, 5813, 5814, More |
Map of Ysselsteyn
Interactive Map
Ysselsteyn Population
Years 1975 to 2020
| Data | 1975 | 1990 | 2000 | 2015 | 2020 |
|---|---|---|---|---|---|
| Population | 2,564 | 3,619 | 4,203 | 5,716 | 5,630 |
| Population Density | 77 / km² | 108.6 / km² | 126.2 / km² | 171.6 / km² | 169 / km² |
Ysselsteyn Population change from 2000 to 2015
Increase of 36% from year 2000 to 2015
| Location | Change since 1975 | Change since 1990 | Change since 2000 |
|---|---|---|---|
| Ysselsteyn | +122.9% | +57.9% | +36% |
| Limburg (Netherlands) | -0.8% | -1.8% | -2.6% |
| Netherlands | +24.3% | +13.4% | +6.5% |
Ysselsteyn Median Age
Median Age: 42.6 years
| Location | Median Age | Median Age (Female) | Median Age (Male) |
|---|---|---|---|
| Ysselsteyn | 42.6 yrs | 43.2 yrs | 42 yrs |
| Limburg (Netherlands) | 44.9 yrs | 45.7 yrs | 44.1 yrs |
| Netherlands | 41 yrs | 41.7 yrs | 40.2 yrs |
Ysselsteyn Population Density
Population Density: 169 / km²
| Location | Population | Area | Density |
|---|---|---|---|
| Ysselsteyn | 5,630 | 33.3 km² | 169 / km² |
| Limburg (Netherlands) | 1.1 million | 2,210.3 km² | 507 / km² |
| Netherlands | 16.9 million | 41,398.3 km² | 409 / km² |
Ysselsteyn Historical and Projected Population
Estimated Population from 900 to 2100
- JRC (European Commission's Joint Research Centre) work on the GHS built-up grid
- CIESIN (Center for International Earth Science Information Network)
- [Link] Klein Goldewijk, K., Beusen, A., Doelman, J., and Stehfest, E.: Anthropogenic land use estimates for the Holocene – HYDE 3.2, Earth Syst. Sci. Data, 9, 927–953, https://doi.org/10.5194/essd-9-927-2017, 2017.
Area Codes
Percentage Area Codes used by businesses in Ysselsteyn
Price Distribution
Business distribution by price for Ysselsteyn
Human Development Index (HDI)
Statistic composite index of life expectancy, education, and per capita income.
Ysselsteyn CO2 Emissions
Carbon Dioxide (CO2) Emissions Per Capita in Tonnes Per Year
| Location | CO2 Emissions | CO2 Emissions Per Capita | CO2 Emissions Intensity |
|---|---|---|---|
| Ysselsteyn | 64,599 tn | 11.47 tn | 1,939.2 tons/km² |
| Limburg (Netherlands) | 12,720,258 tn | 11.35 tn | 5,754.9 tons/km² |
| Netherlands | 167,743,568 tn | 9.91 tn | 4,051.9 tons/km² |
| 2013 CO2 emissions (tonnes/year) | 64,599 tn |
| 2013 CO2 emissions (tonnes/year) per capita | 11.47 tn |
| 2013 CO2 emissions intensity (tonnes/km²/year) | 1,939.2 tons/km² |
Natural Hazards Risk
Relative risk out of 10
| Hazard | Risk Level |
|---|---|
| Flood | Medium (4) |
| Earthquake | Low (2) |
* Risk, particularly concerning flood or landslide, may not be for the entire area.
- Dilley, M., R.S. Chen, U. Deichmann, A.L. Lerner-Lam, M. Arnold, J. Agwe, P. Buys, O. Kjekstad, B. Lyon, and G. Yetman. 2005. Natural Disaster Hotspots: A Global Risk Analysis. Washington, D.C.: World Bank. https://doi.org/10.1596/0-8213-5930-4.
- Center for Hazards and Risk Research - CHRR - Columbia University, Center for International Earth Science Information Network - CIESIN - Columbia University. 2005. Global Flood Hazard Frequency and Distribution. Palisades, NY: NASA Socioeconomic Data and Applications Center (SEDAC). https://doi.org/10.7927/H4668B3D.
- Center for Hazards and Risk Research - CHRR - Columbia University, Center for International Earth Science Information Network - CIESIN - Columbia University. 2005. Global Earthquake Hazard Distribution - Peak Ground Acceleration. Palisades, NY: NASA Socioeconomic Data and Applications Center (SEDAC). https://doi.org/10.7927/H4BZ63ZS.
Recent Nearby Earthquakes
Magnitude 3.0 and greater
| Date▼ | Time↕ | Magnitude↕ | Distance↕ | Depth↕ | Location↕ | Link |
|---|---|---|---|---|---|---|
| 9/8/11 | 7:02 PM | 4.2 | 23.2 km | 6,000 m | Germany | usgs.gov |
| 7/24/09 | 2:58 AM | 4.1 | 43.4 km | 5,000 m | Germany | usgs.gov |
| 12/10/08 | 3:28 AM | 3.3 | 49.6 km | 10,000 m | Germany | usgs.gov |
| 12/8/08 | 5:21 PM | 3 | 58.1 km | 2,000 m | Germany | usgs.gov |
| 11/12/08 | 8:56 PM | 3.4 | 50.3 km | 1,000 m | Germany | usgs.gov |
| 9/24/08 | 1:55 PM | 3 | 49.1 km | 5,000 m | Germany | usgs.gov |
| 9/18/08 | 2:33 PM | 3.2 | 48.6 km | 1,000 m | Germany | usgs.gov |
| 5/13/08 | 9:55 AM | 3.3 | 43.8 km | 1,000 m | Germany | usgs.gov |
| 5/2/08 | 6:54 AM | 3.1 | 47.9 km | 1,000 m | Germany | usgs.gov |
| 4/23/08 | 12:10 PM | 3.1 | 48.4 km | 1,000 m | Germany | usgs.gov |
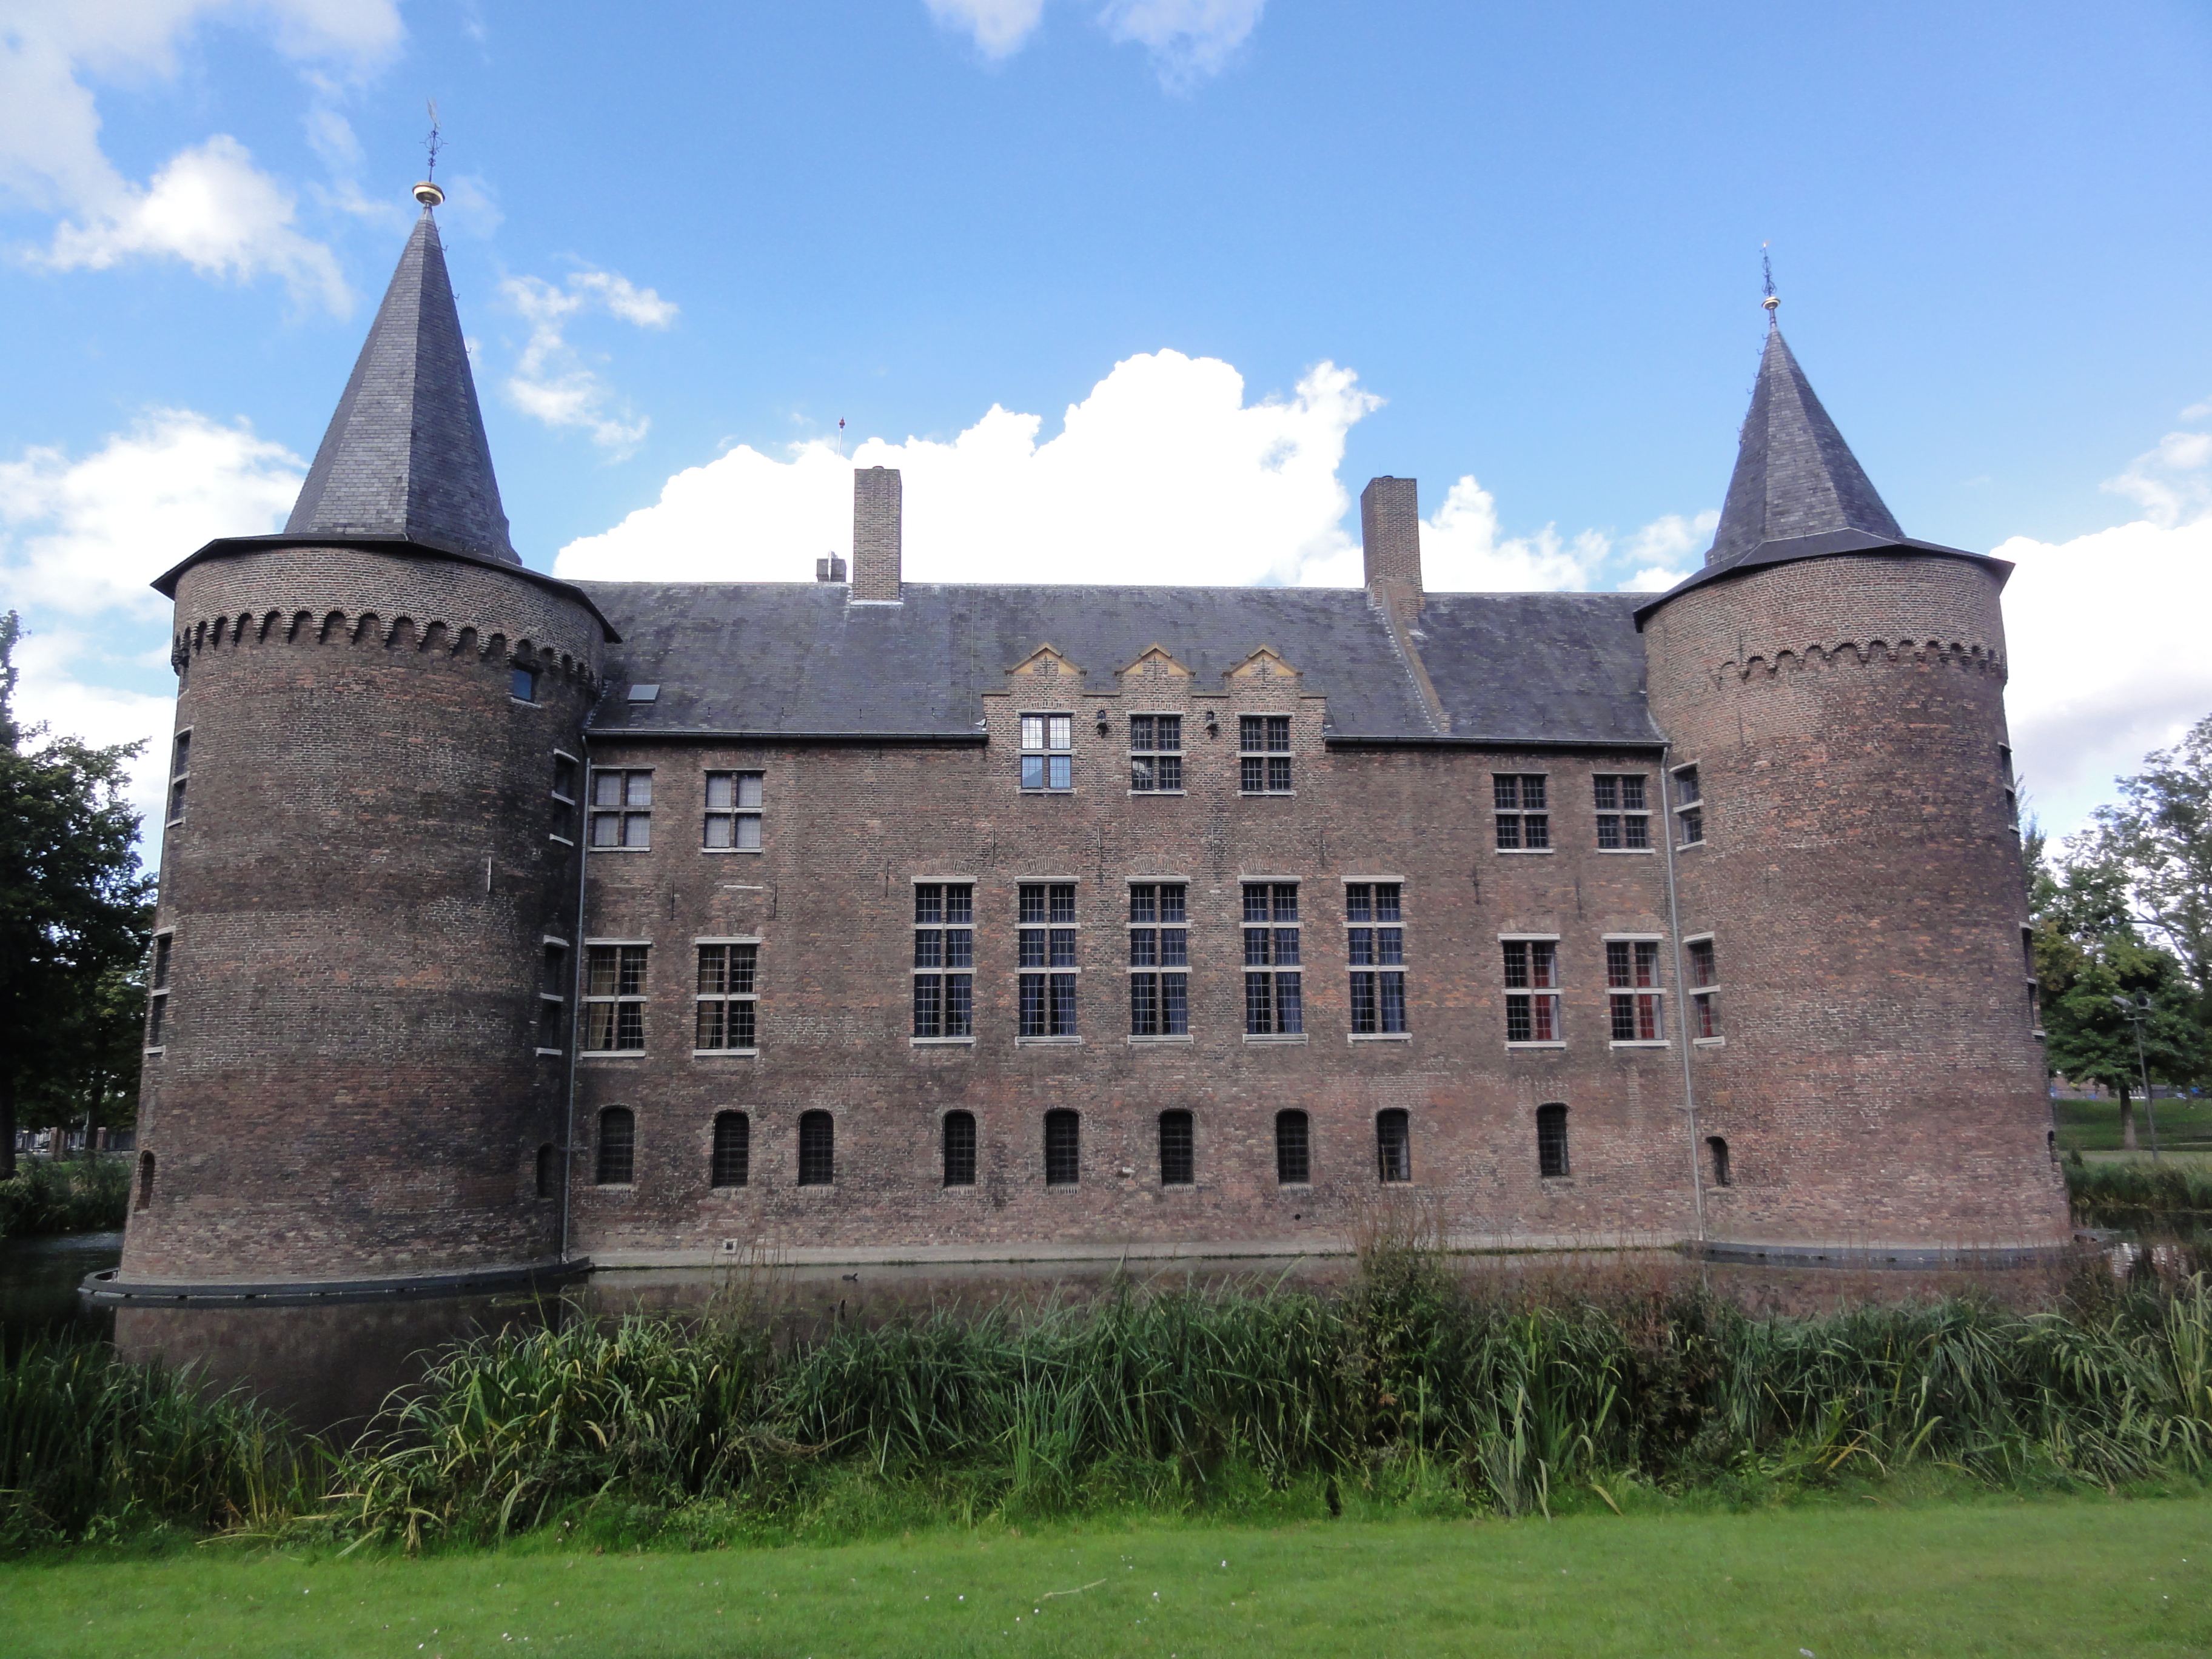
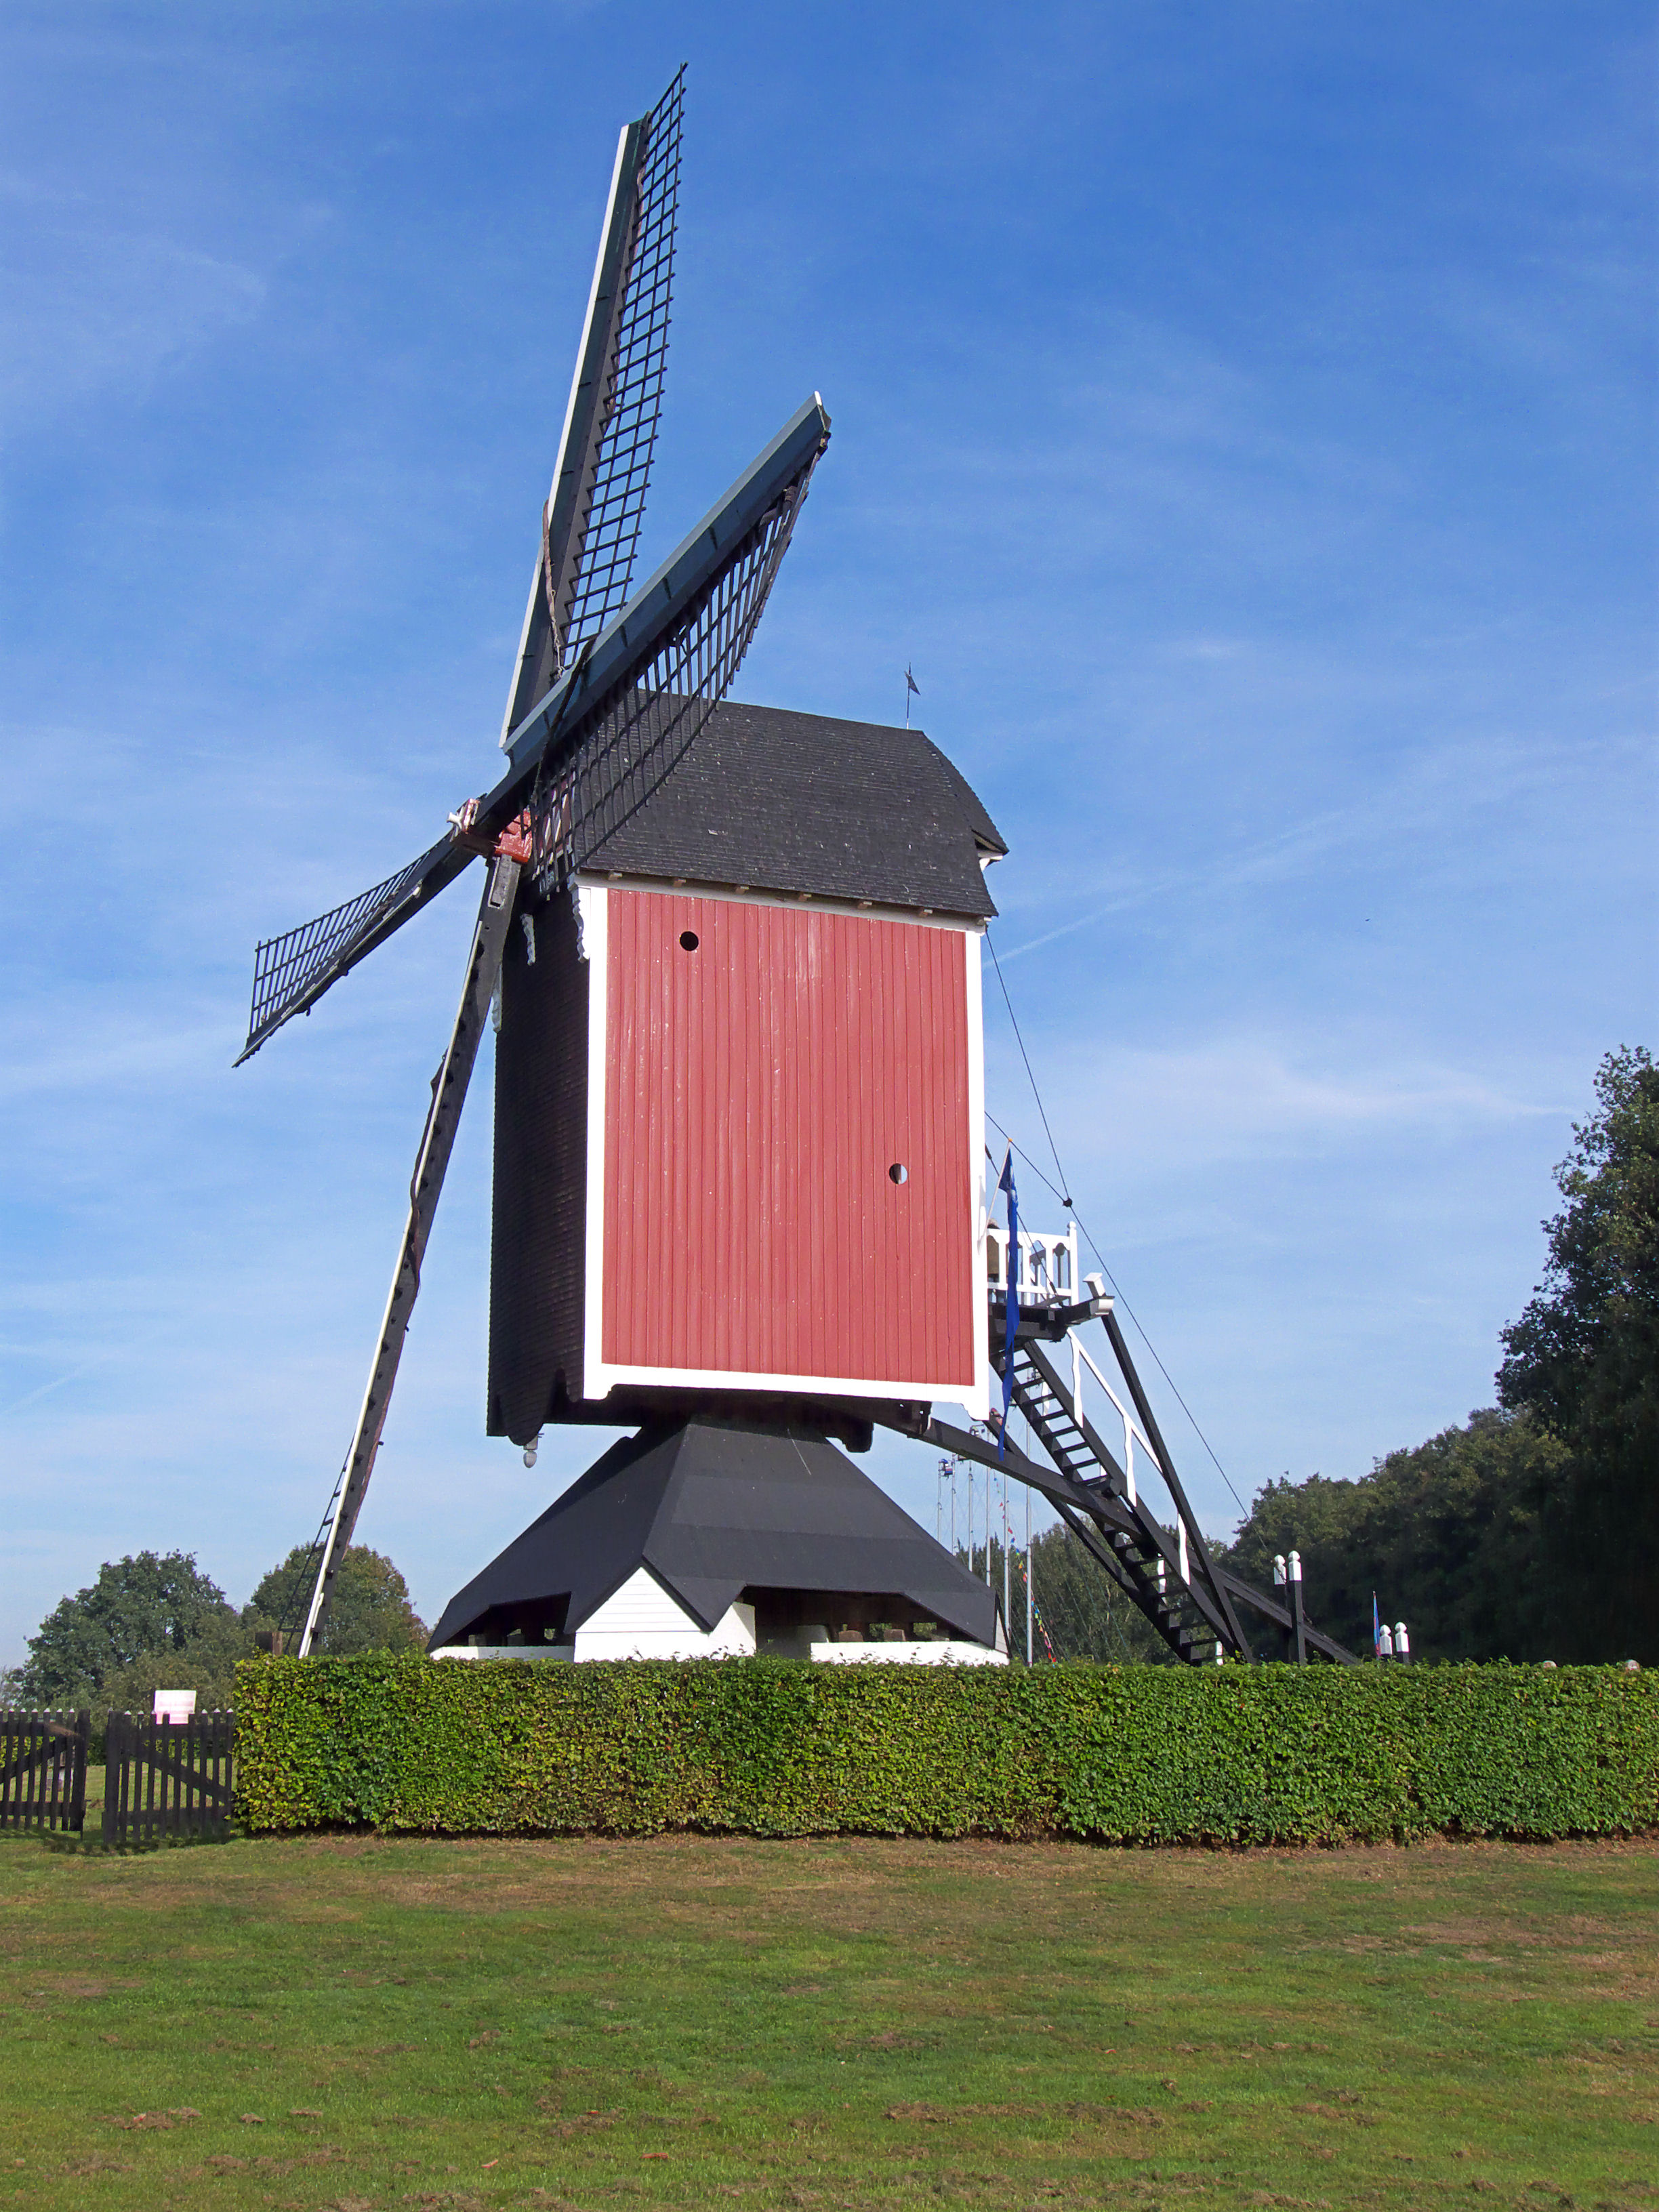
Ysselsteyn
Ysselsteyn is a small village in the municipality of Venray in Limburg, Netherlands. It was established in 1921 and named after its designer, Hendrik Albert van IJsselsteyn, then Minister of Agriculture. 's main object of interest is the German war c..
Ysselsteyn Wikipedia Page

About Our Data
The data on this page is estimated using a number of publicly available tools and resources. It is provided without warranty, and could contain inaccuracies. Use at your own risk.