Akkarvik Facts
| Area | 3.6 km² |
| Population | 23 |
| Population change (1975 to 2020) | +475.0% |
| Population change (2000 to 2020) | -30.3% |
| Local Time | |
| Timezone | Central European Summer Time |
| Lat & Lng | 70.06407, 20.49253 |
| Postal Codes | 9190 |
Map of Akkarvik
Interactive Map
Akkarvik Population
Years 1975 to 2020
| Data | 1975 | 1990 | 2000 | 2015 | 2020 |
|---|---|---|---|---|---|
| Population | 4 | 39 | 33 | 23 | 23 |
| Population Density | 1.1 / km² | 10.9 / km² | 9.3 / km² | 6.5 / km² | 6.5 / km² |
Akkarvik Population change from 2000 to 2015
Decrease of 30.3% from year 2000 to 2015
| Location | Change since 1975 | Change since 1990 | Change since 2000 |
|---|---|---|---|
| Akkarvik | +475% | -41% | -30.3% |
| Troms | +4.6% | +7.4% | +7.1% |
| Norway | +30.2% | +23.2% | +16.4% |
Akkarvik Population Density
Population Density: 6.5 / km²
| Location | Population | Area | Density |
|---|---|---|---|
| Akkarvik | 23 | 3.563 km² | 6.5 / km² |
| Troms | 163,022 | 41,118.3 km² | 4 / km² |
| Norway | 4.9 million | 322,754.2 km² | 15.2 / km² |
Akkarvik Historical and Projected Population
Estimated Population from 0 to 2100
- JRC (European Commission's Joint Research Centre) work on the GHS built-up grid
- CIESIN (Center for International Earth Science Information Network)
- [Link] Klein Goldewijk, K., Beusen, A., Doelman, J., and Stehfest, E.: Anthropogenic land use estimates for the Holocene – HYDE 3.2, Earth Syst. Sci. Data, 9, 927–953, https://doi.org/10.5194/essd-9-927-2017, 2017.
Human Development Index (HDI)
Statistic composite index of life expectancy, education, and per capita income.
Akkarvik CO2 Emissions
Carbon Dioxide (CO2) Emissions Per Capita in Tonnes Per Year
| Location | CO2 Emissions | CO2 Emissions Per Capita | CO2 Emissions Intensity |
|---|---|---|---|
| Akkarvik | 422 tn | 18.35 tn | 118.5 tons/km² |
| Troms | 1,844,021 tn | 11.31 tn | 44.8 tons/km² |
| Norway | 86,855,170 tn | 17.74 tn | 269.1 tons/km² |
| 2013 CO2 emissions (tonnes/year) | 422 tn |
| 2013 CO2 emissions (tonnes/year) per capita | 18.35 tn |
| 2013 CO2 emissions intensity (tonnes/km²/year) | 118.5 tons/km² |
Natural Hazards Risk
Relative risk out of 10
| Hazard | Risk Level |
|---|---|
| Earthquake | Low (2) |
* Risk, particularly concerning flood or landslide, may not be for the entire area.
- Dilley, M., R.S. Chen, U. Deichmann, A.L. Lerner-Lam, M. Arnold, J. Agwe, P. Buys, O. Kjekstad, B. Lyon, and G. Yetman. 2005. Natural Disaster Hotspots: A Global Risk Analysis. Washington, D.C.: World Bank. https://doi.org/10.1596/0-8213-5930-4.
- Center for Hazards and Risk Research - CHRR - Columbia University, Center for International Earth Science Information Network - CIESIN - Columbia University. 2005. Global Earthquake Hazard Distribution - Peak Ground Acceleration. Palisades, NY: NASA Socioeconomic Data and Applications Center (SEDAC). https://doi.org/10.7927/H4BZ63ZS.
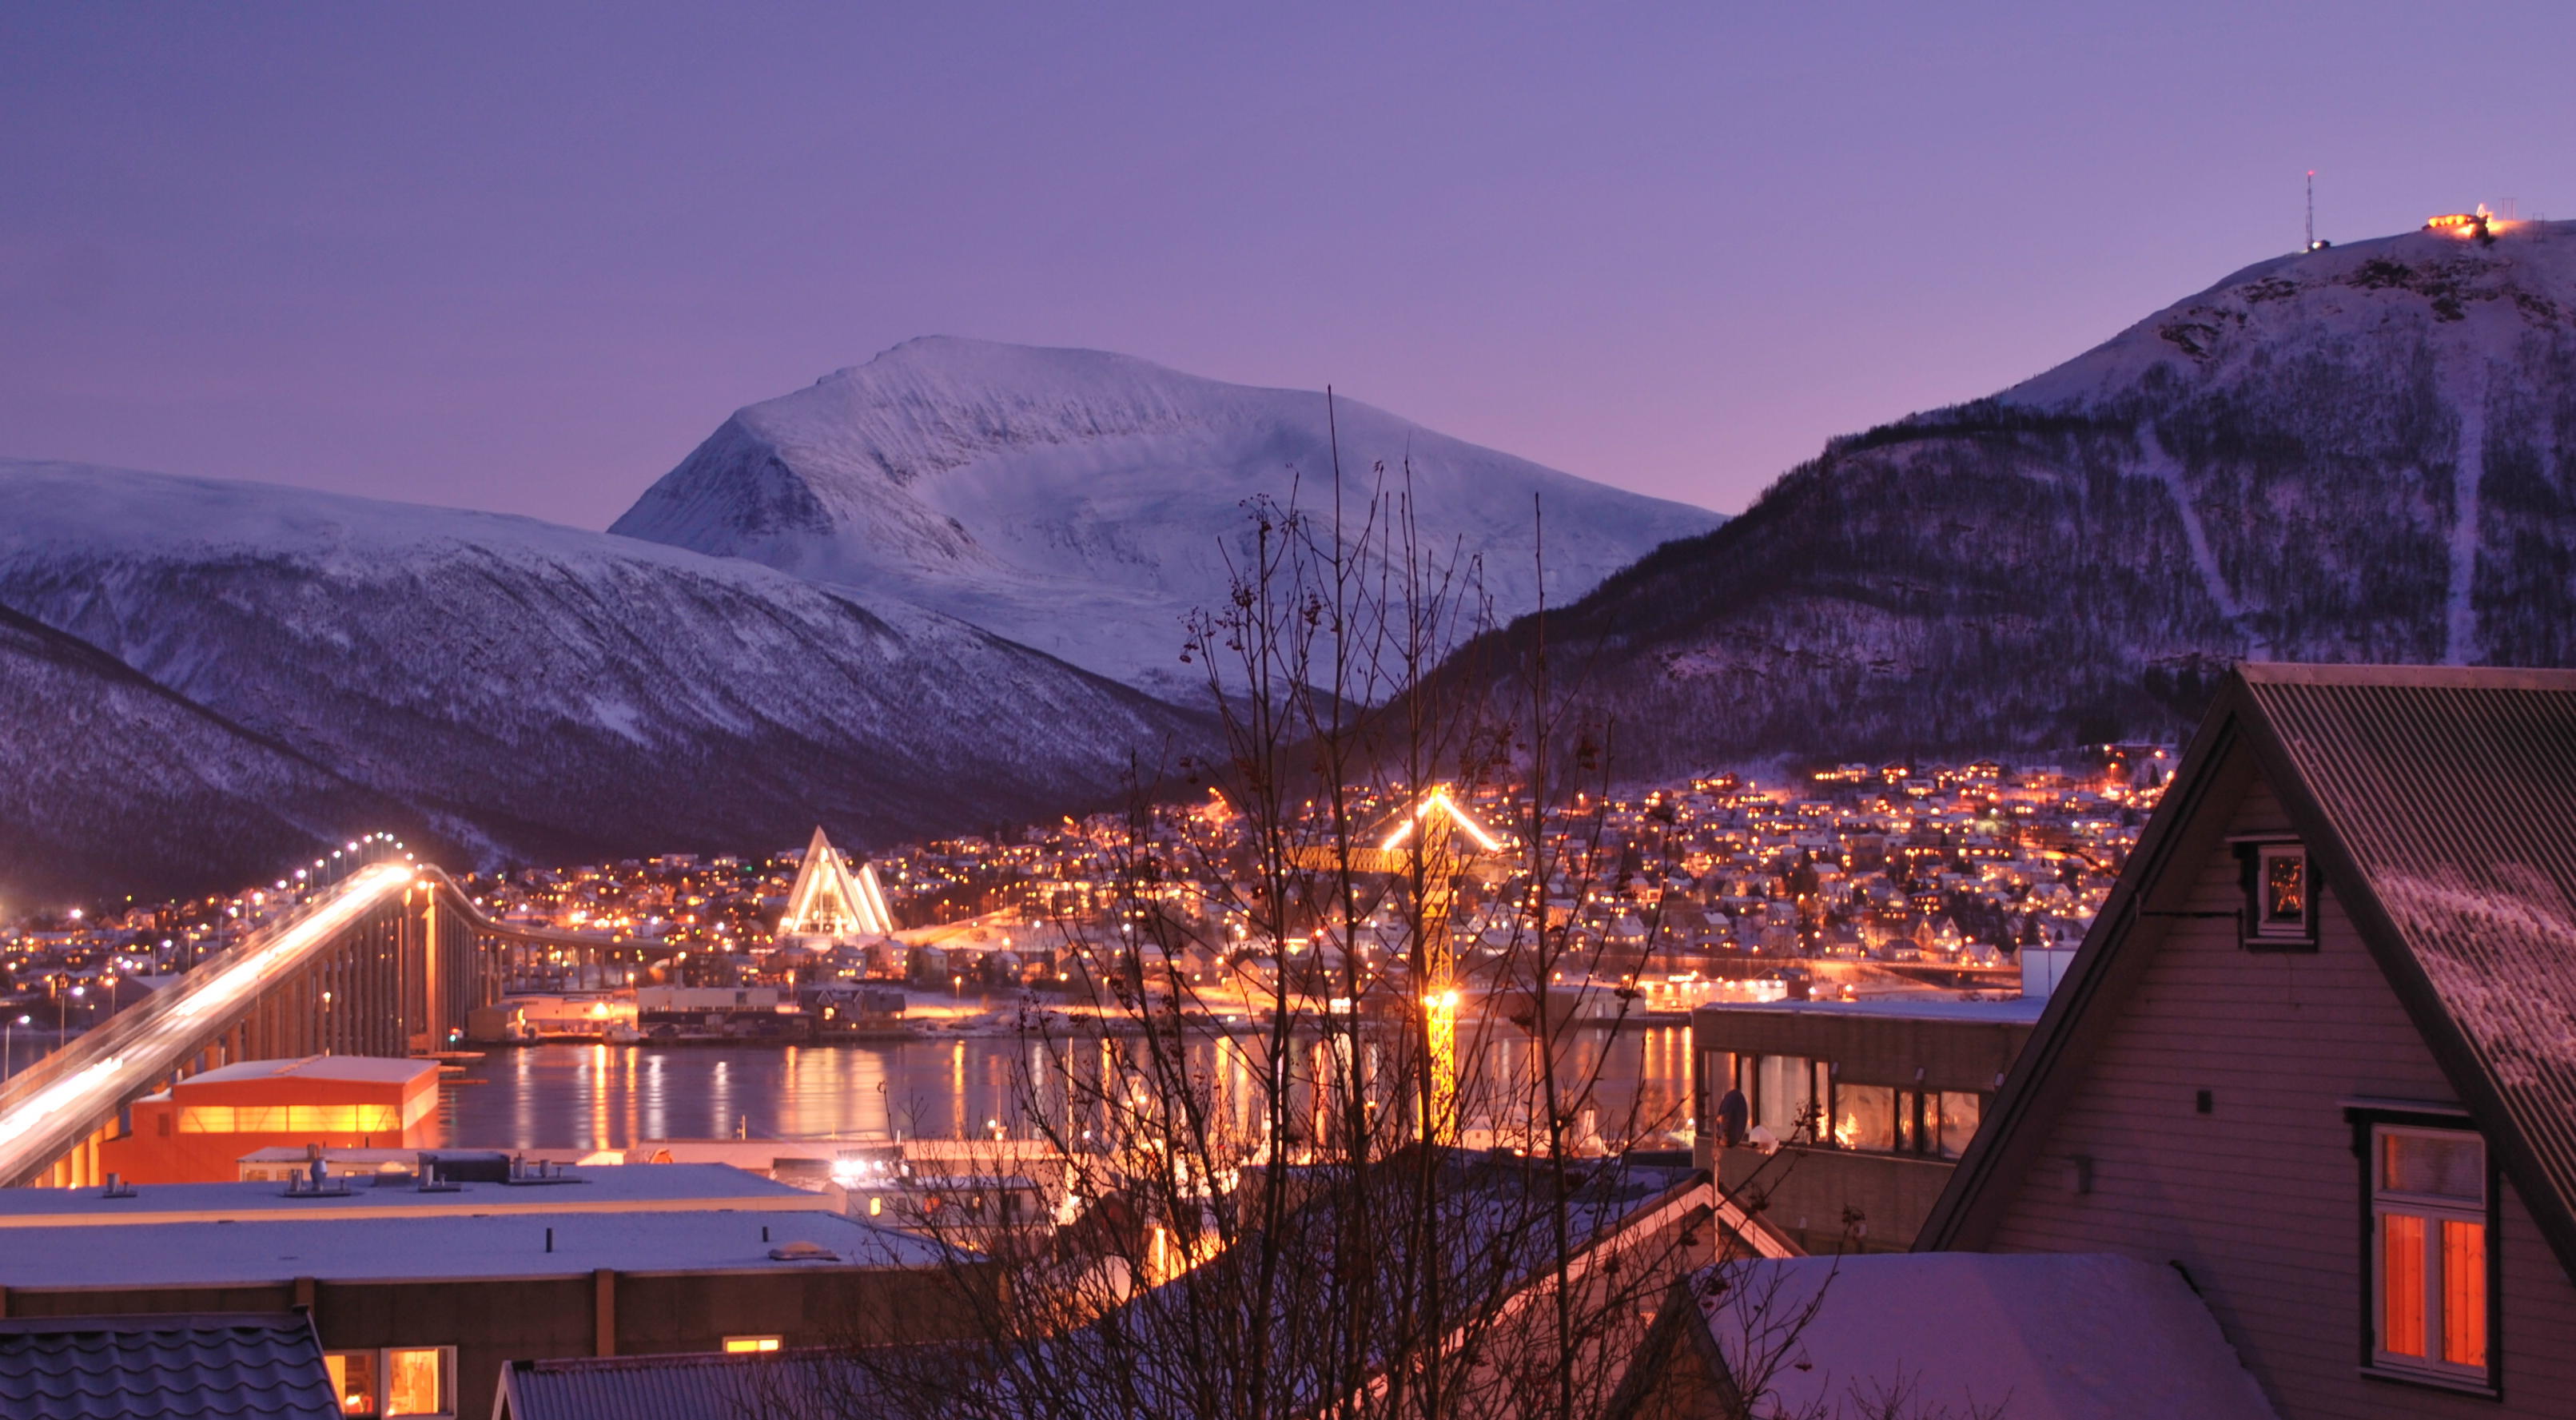
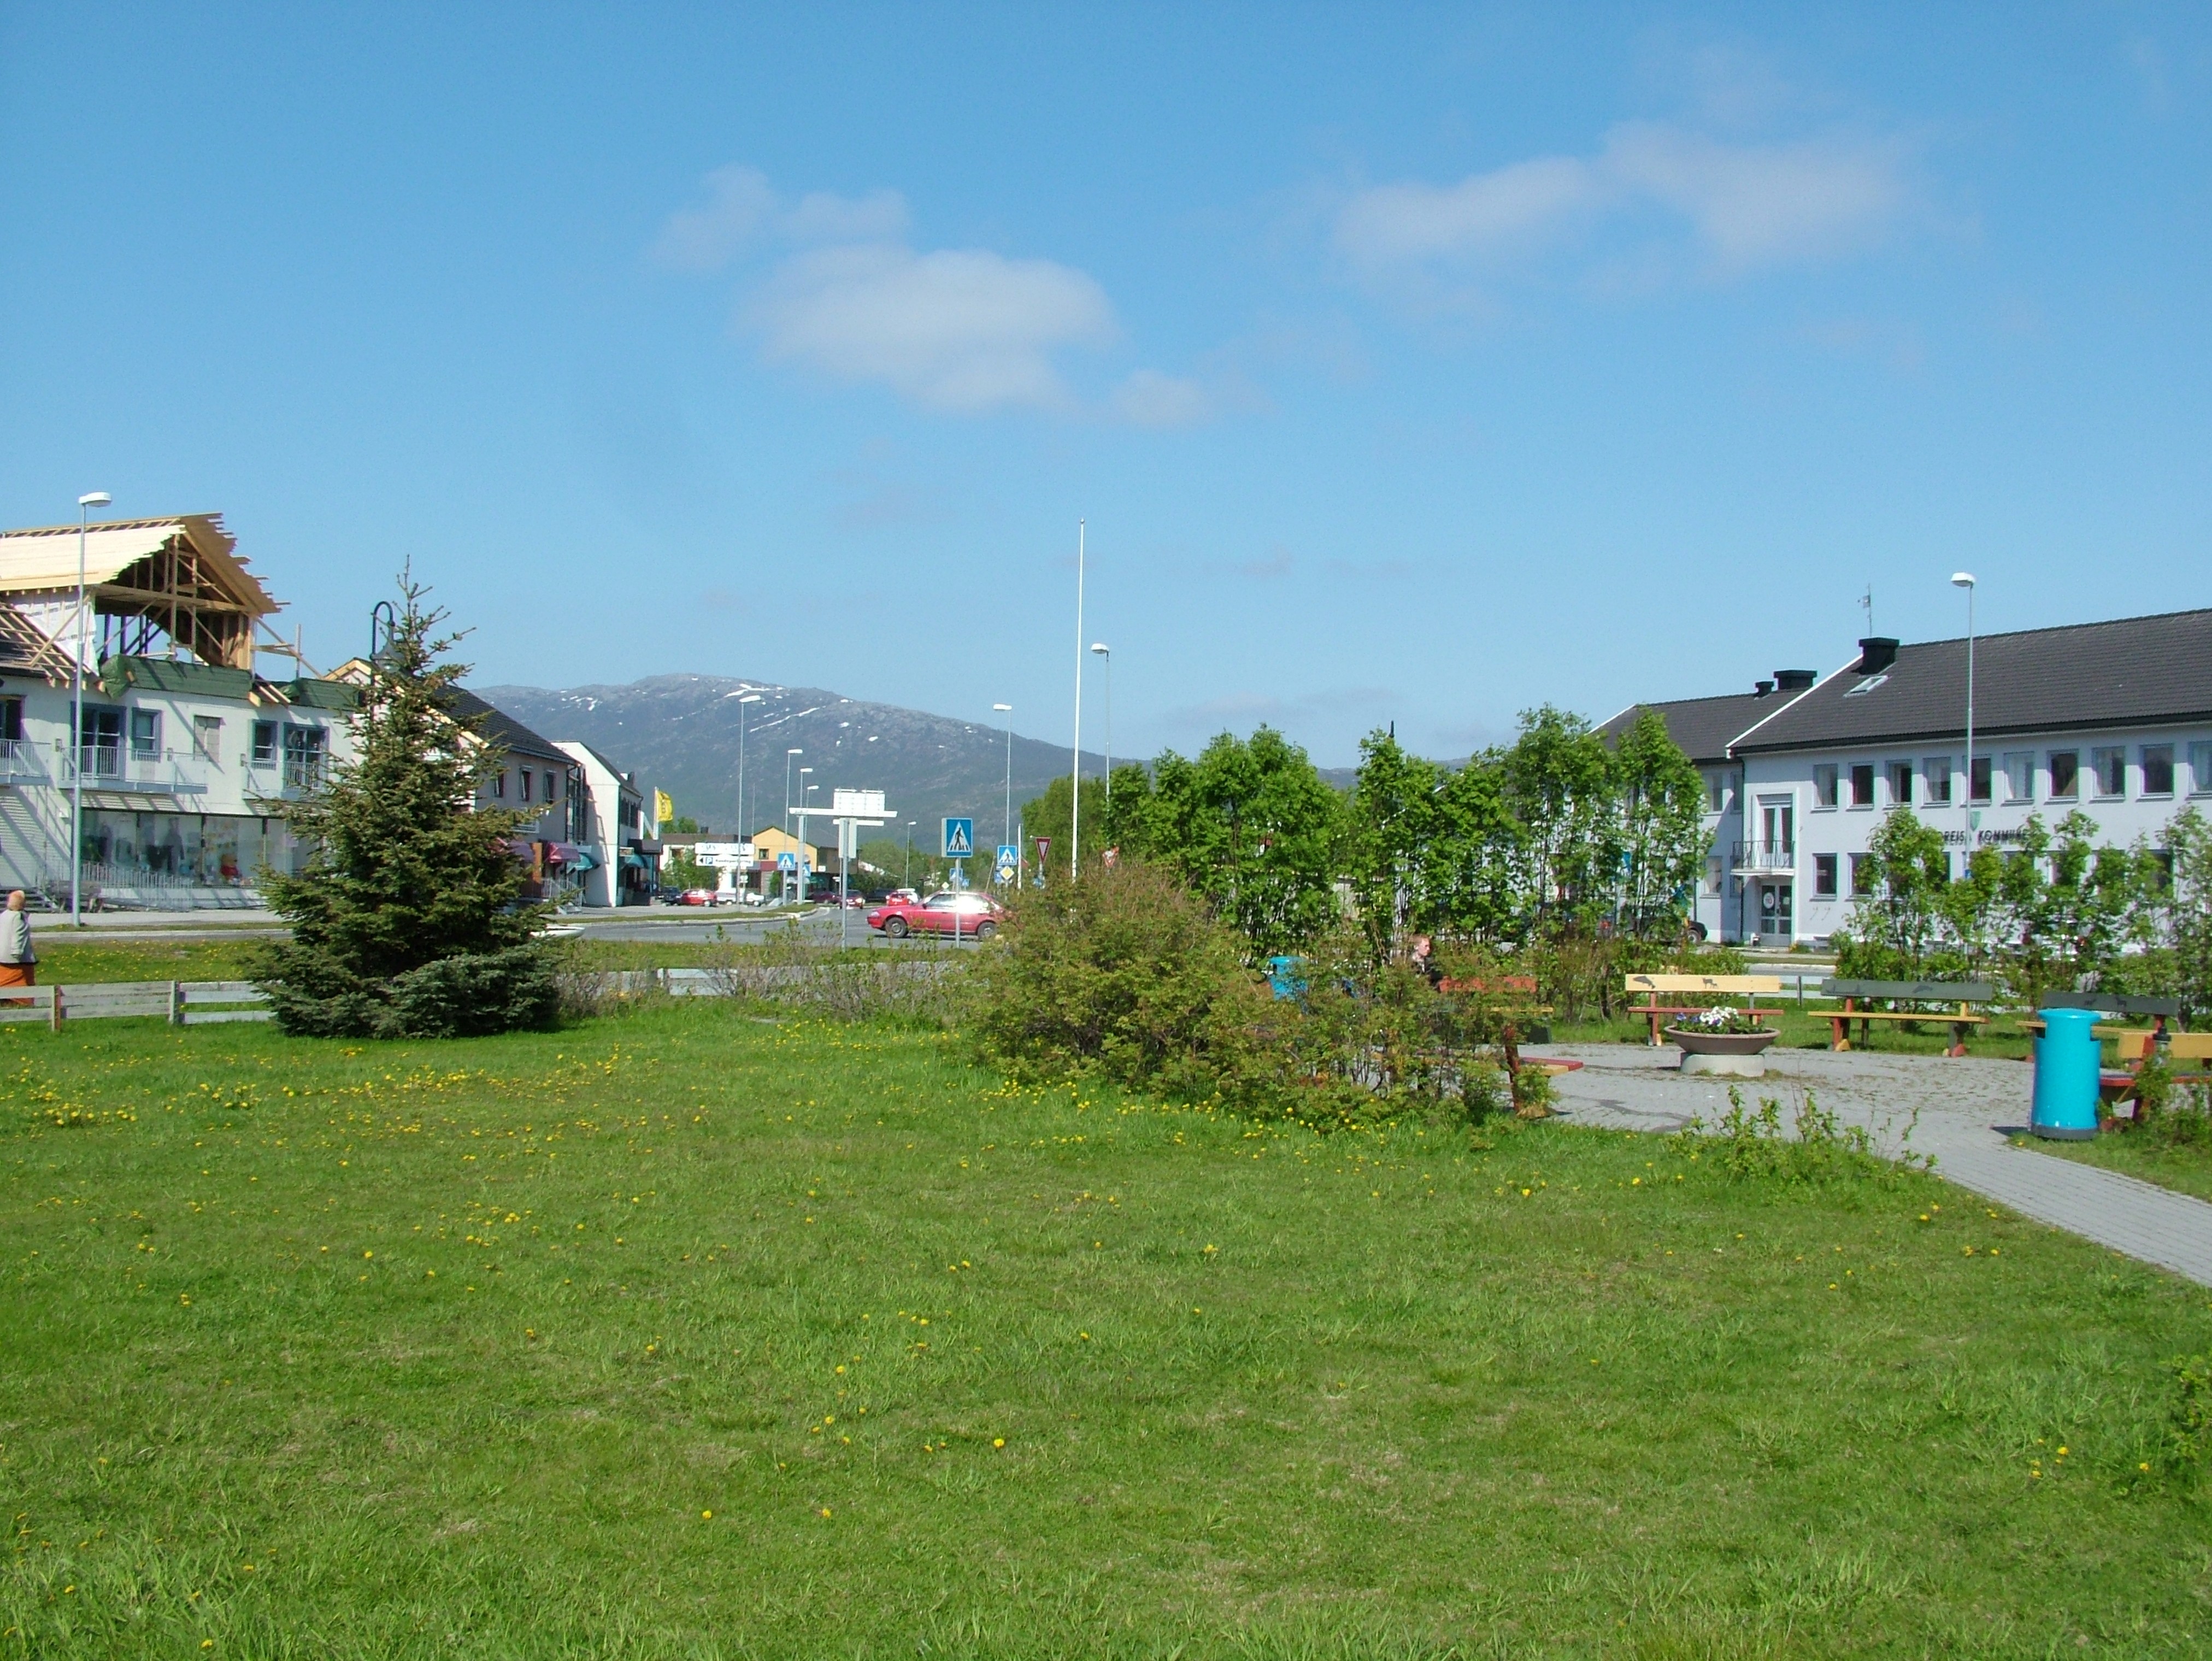
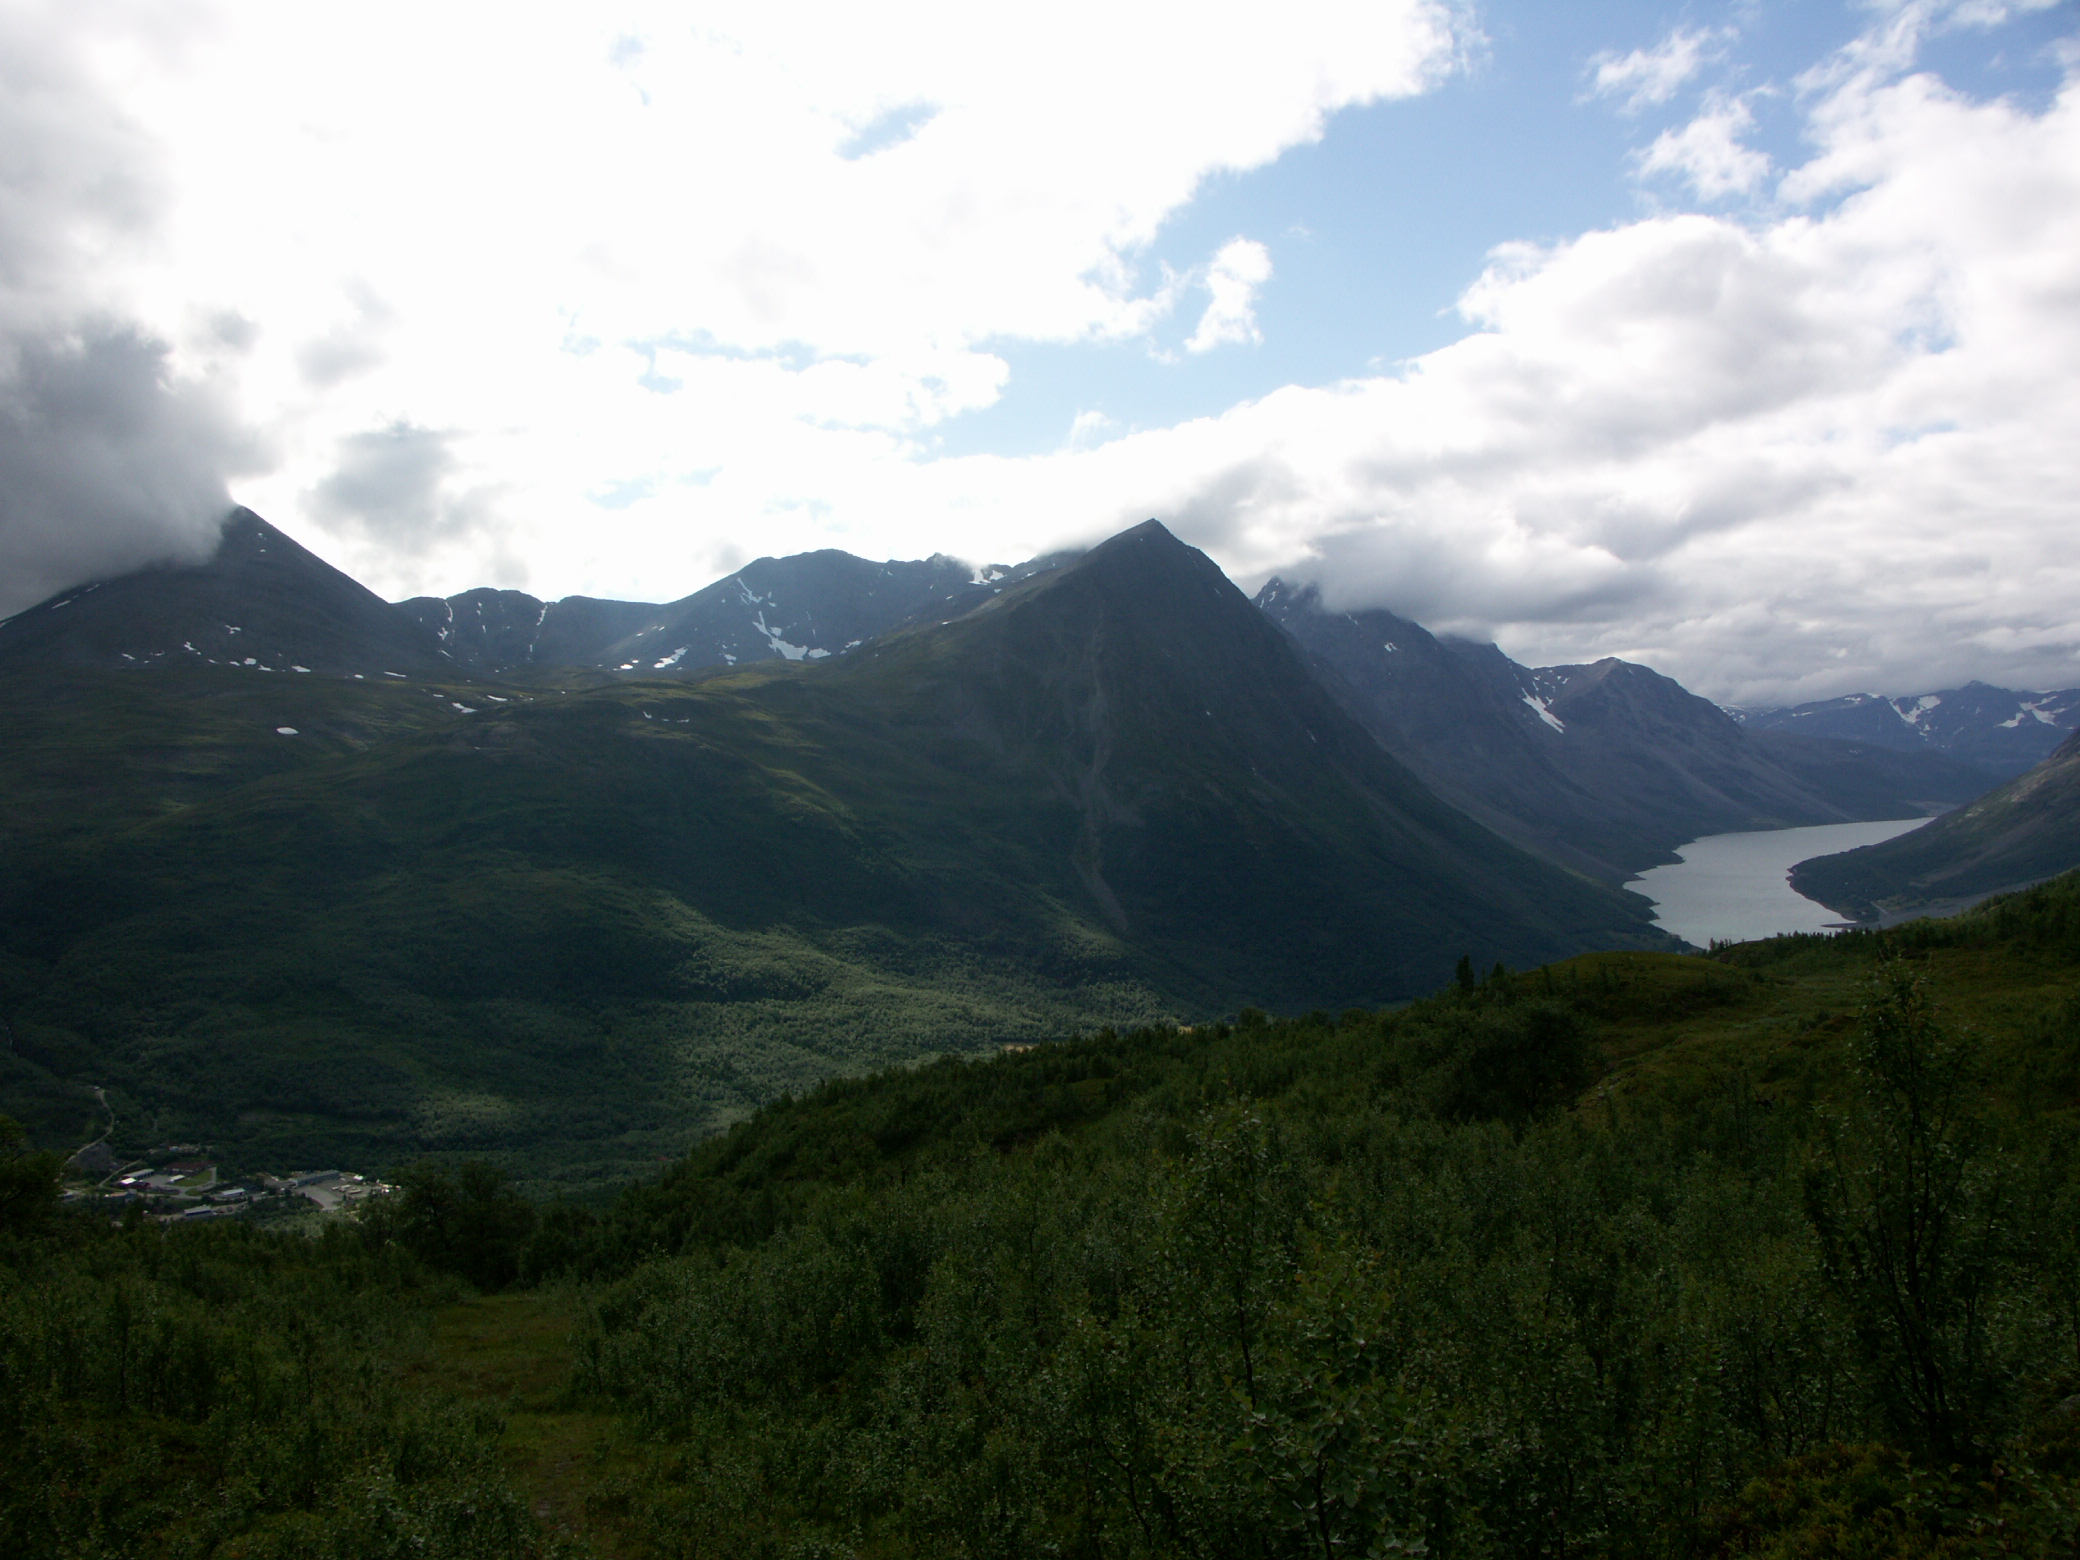
Akkarvik
Akkarvik is a small village along the Langfjorden in the municipality of Skjervøy, in the northern part of Troms county, Norway. It is located about 14 km (8.7 mi) south of Årviksand and about 5 kilometres (3.1 mi) west of Arnøyhamn on the south side..
Akkarvik Wikipedia Page
About Our Data
The data on this page is estimated using a number of publicly available tools and resources. It is provided without warranty, and could contain inaccuracies. Use at your own risk.