Categories in Ankenes
Industries
Business Distribution by Industry in Ankenes
| Industry Description | Number of Establishments | Average Google Rating |
|---|---|---|
| Car repair | 5 | 4.5 |
Map of Ankenes
Interactive Map
Ankenes Population
Years 1975 to 2020
| Data | 1975 | 1990 | 2000 | 2015 | 2020 |
|---|---|---|---|---|---|
| Population | 94 | 80 | 68 | 50 | 52 |
| Population Density | 22.4 / km² | 19.1 / km² | 16.2 / km² | 11.9 / km² | 12.4 / km² |
Ankenes Population change from 2000 to 2015
Decrease of 26.5% from year 2000 to 2015
| Location | Change since 1975 | Change since 1990 | Change since 2000 |
|---|---|---|---|
| Ankenes | -46.8% | -37.5% | -26.5% |
| Nordland | -10.2% | -2.7% | +0.7% |
| Norway | +30.2% | +23.2% | +16.4% |
Ankenes Population Density
Population Density: 12.4 / km²
| Location | Population | Area | Density |
|---|---|---|---|
| Ankenes | 52 | 4.188 km² | 12.4 / km² |
| Nordland | 241,993 | 80,996.9 km² | 3 / km² |
| Norway | 4.9 million | 322,754.2 km² | 15.2 / km² |
Ankenes Historical and Projected Population
Estimated Population from 0 to 2100
- JRC (European Commission's Joint Research Centre) work on the GHS built-up grid
- CIESIN (Center for International Earth Science Information Network)
- [Link] Klein Goldewijk, K., Beusen, A., Doelman, J., and Stehfest, E.: Anthropogenic land use estimates for the Holocene – HYDE 3.2, Earth Syst. Sci. Data, 9, 927–953, https://doi.org/10.5194/essd-9-927-2017, 2017.
Area Codes
Percentage Area Codes used by businesses in Ankenes
Human Development Index (HDI)
Statistic composite index of life expectancy, education, and per capita income.
Ankenes CO2 Emissions
Carbon Dioxide (CO2) Emissions Per Capita in Tonnes Per Year
| Location | CO2 Emissions | CO2 Emissions Per Capita | CO2 Emissions Intensity |
|---|---|---|---|
| Ankenes | 954 tn | 18.35 tn | 227.9 tons/km² |
| Nordland | 2,013,101 tn | 8.32 tn | 24.9 tons/km² |
| Norway | 86,855,170 tn | 17.74 tn | 269.1 tons/km² |
| 2013 CO2 emissions (tonnes/year) | 954 tn |
| 2013 CO2 emissions (tonnes/year) per capita | 18.35 tn |
| 2013 CO2 emissions intensity (tonnes/km²/year) | 227.9 tons/km² |
Natural Hazards Risk
Relative risk out of 10
| Hazard | Risk Level |
|---|---|
| Earthquake | Low (2) |
* Risk, particularly concerning flood or landslide, may not be for the entire area.
- Dilley, M., R.S. Chen, U. Deichmann, A.L. Lerner-Lam, M. Arnold, J. Agwe, P. Buys, O. Kjekstad, B. Lyon, and G. Yetman. 2005. Natural Disaster Hotspots: A Global Risk Analysis. Washington, D.C.: World Bank. https://doi.org/10.1596/0-8213-5930-4.
- Center for Hazards and Risk Research - CHRR - Columbia University, Center for International Earth Science Information Network - CIESIN - Columbia University. 2005. Global Earthquake Hazard Distribution - Peak Ground Acceleration. Palisades, NY: NASA Socioeconomic Data and Applications Center (SEDAC). https://doi.org/10.7927/H4BZ63ZS.
Recent Nearby Earthquakes
Magnitude 3.0 and greater
| Date▼ | Time↕ | Magnitude↕ | Distance↕ | Depth↕ | Location↕ | Link |
|---|---|---|---|---|---|---|
| 4/28/74 | 12:52 PM | 4.9 | 55.5 km | 33,000 m | northern Norway | usgs.gov |
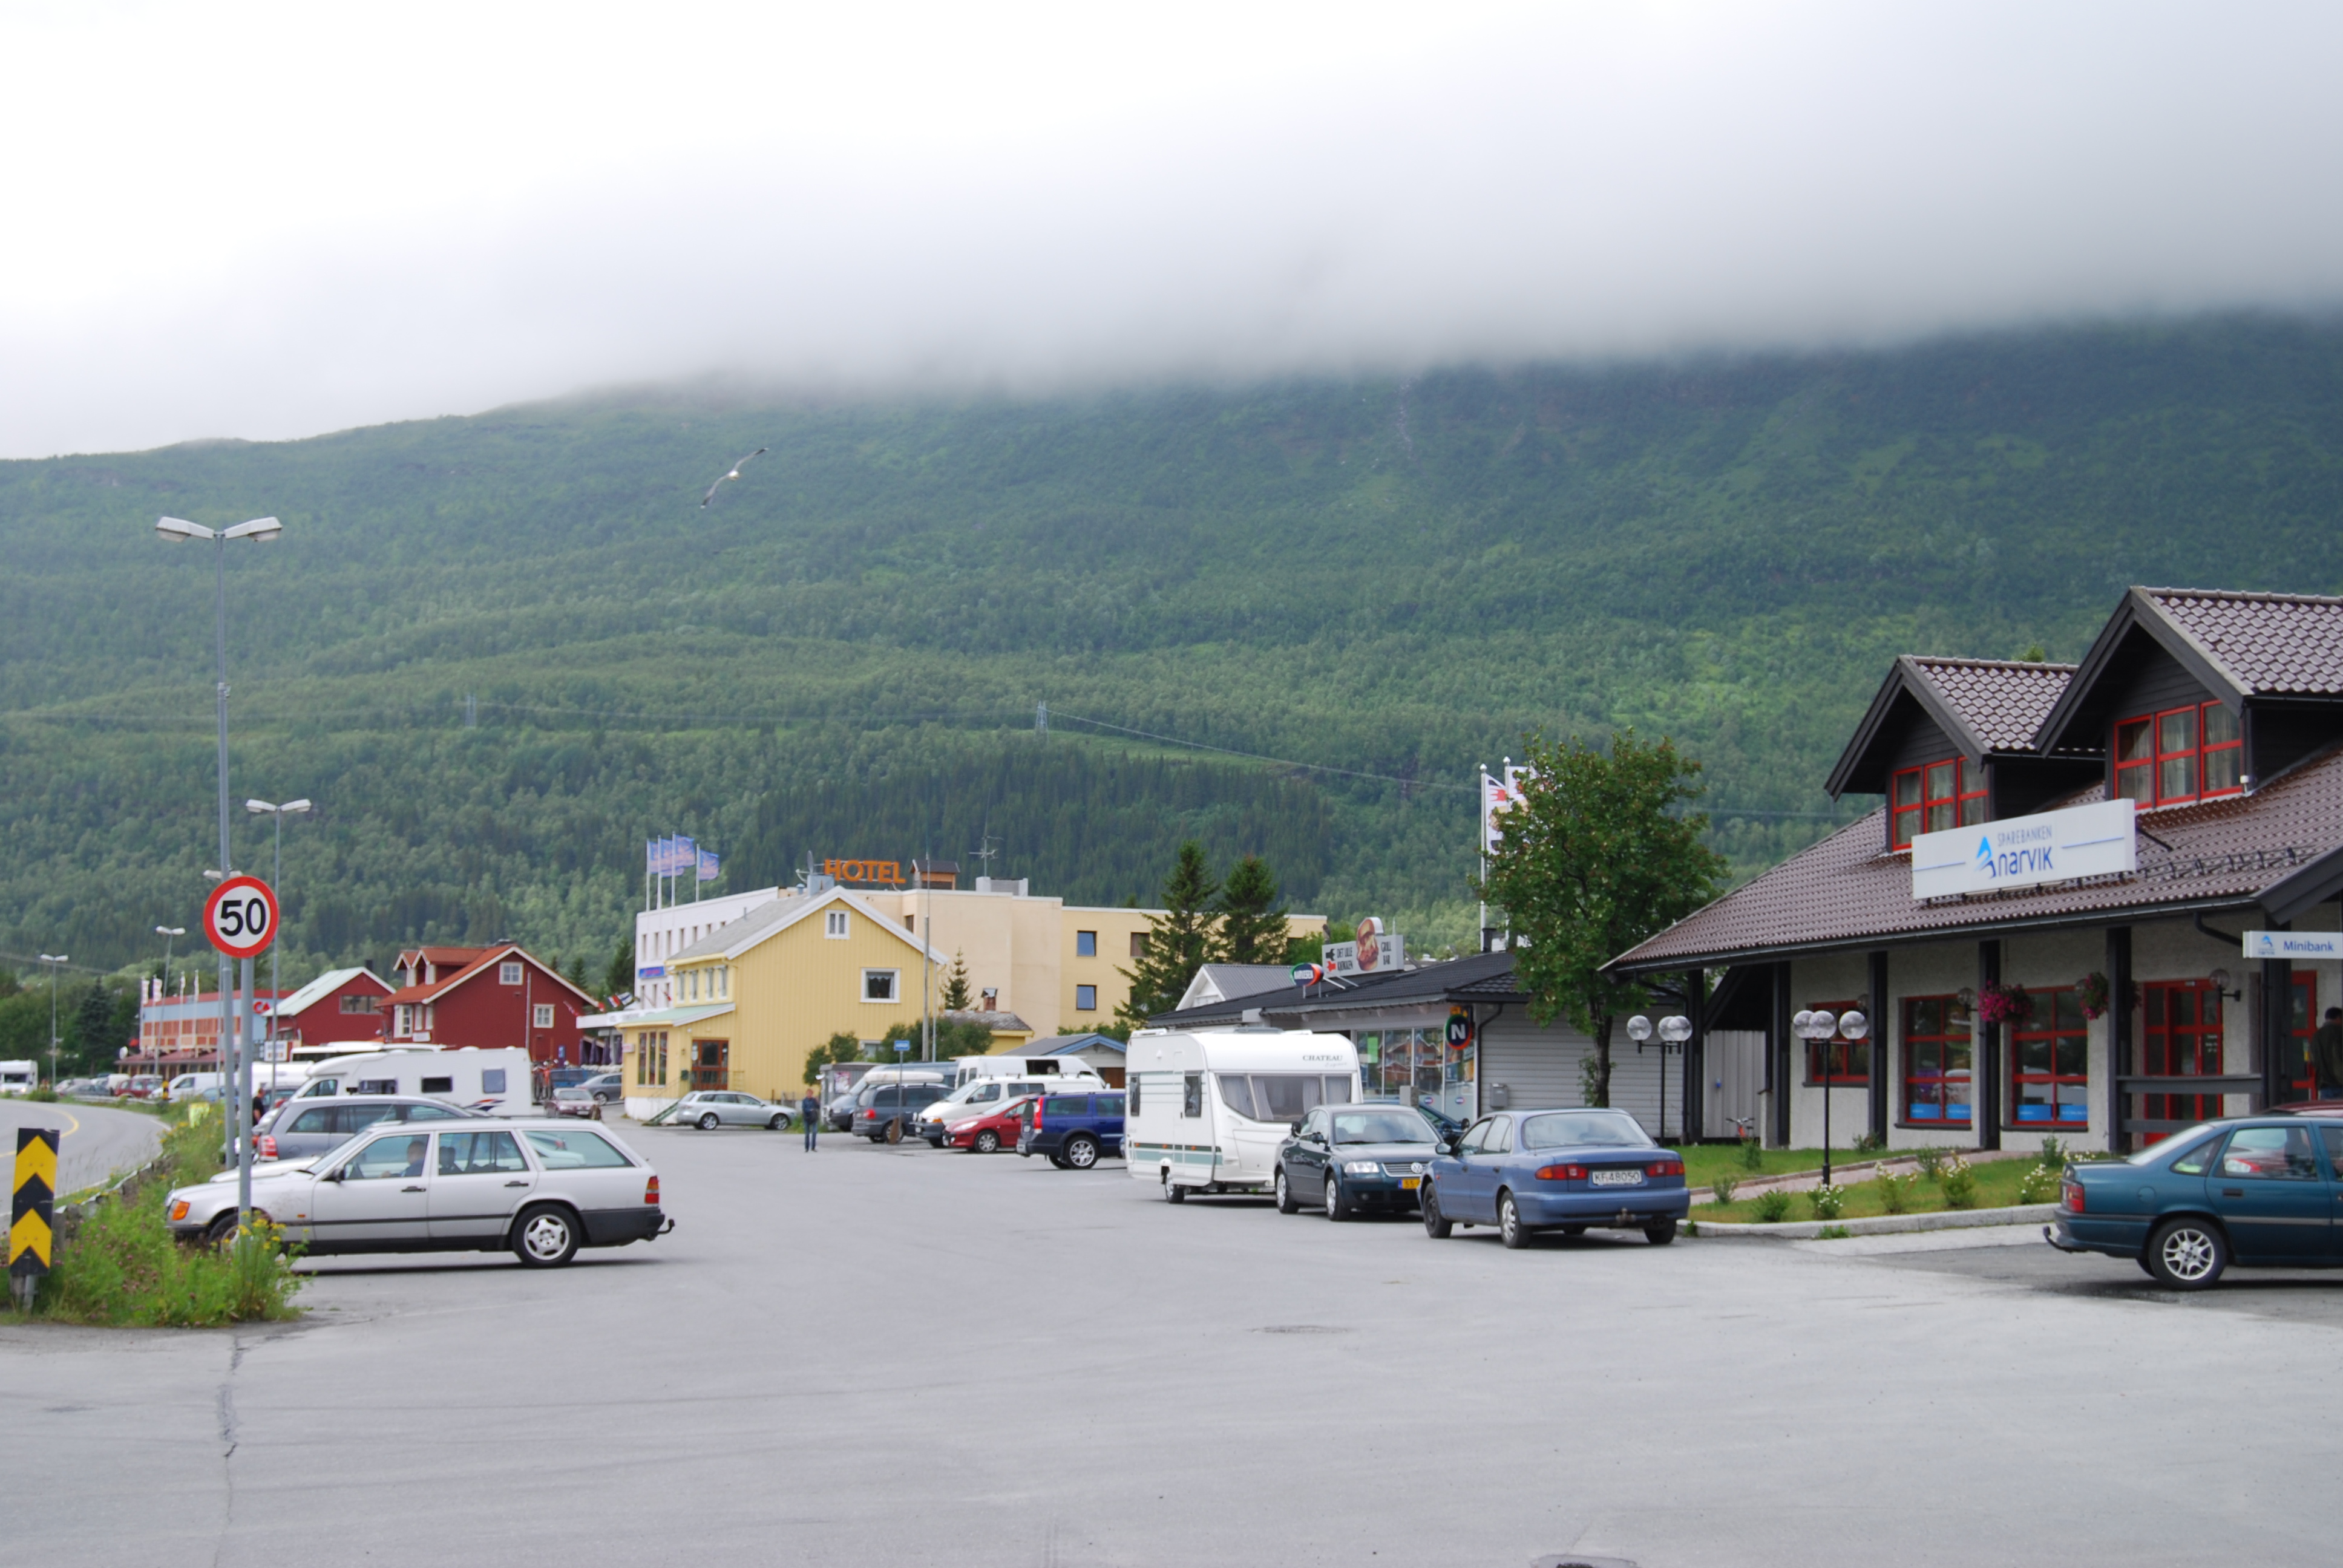
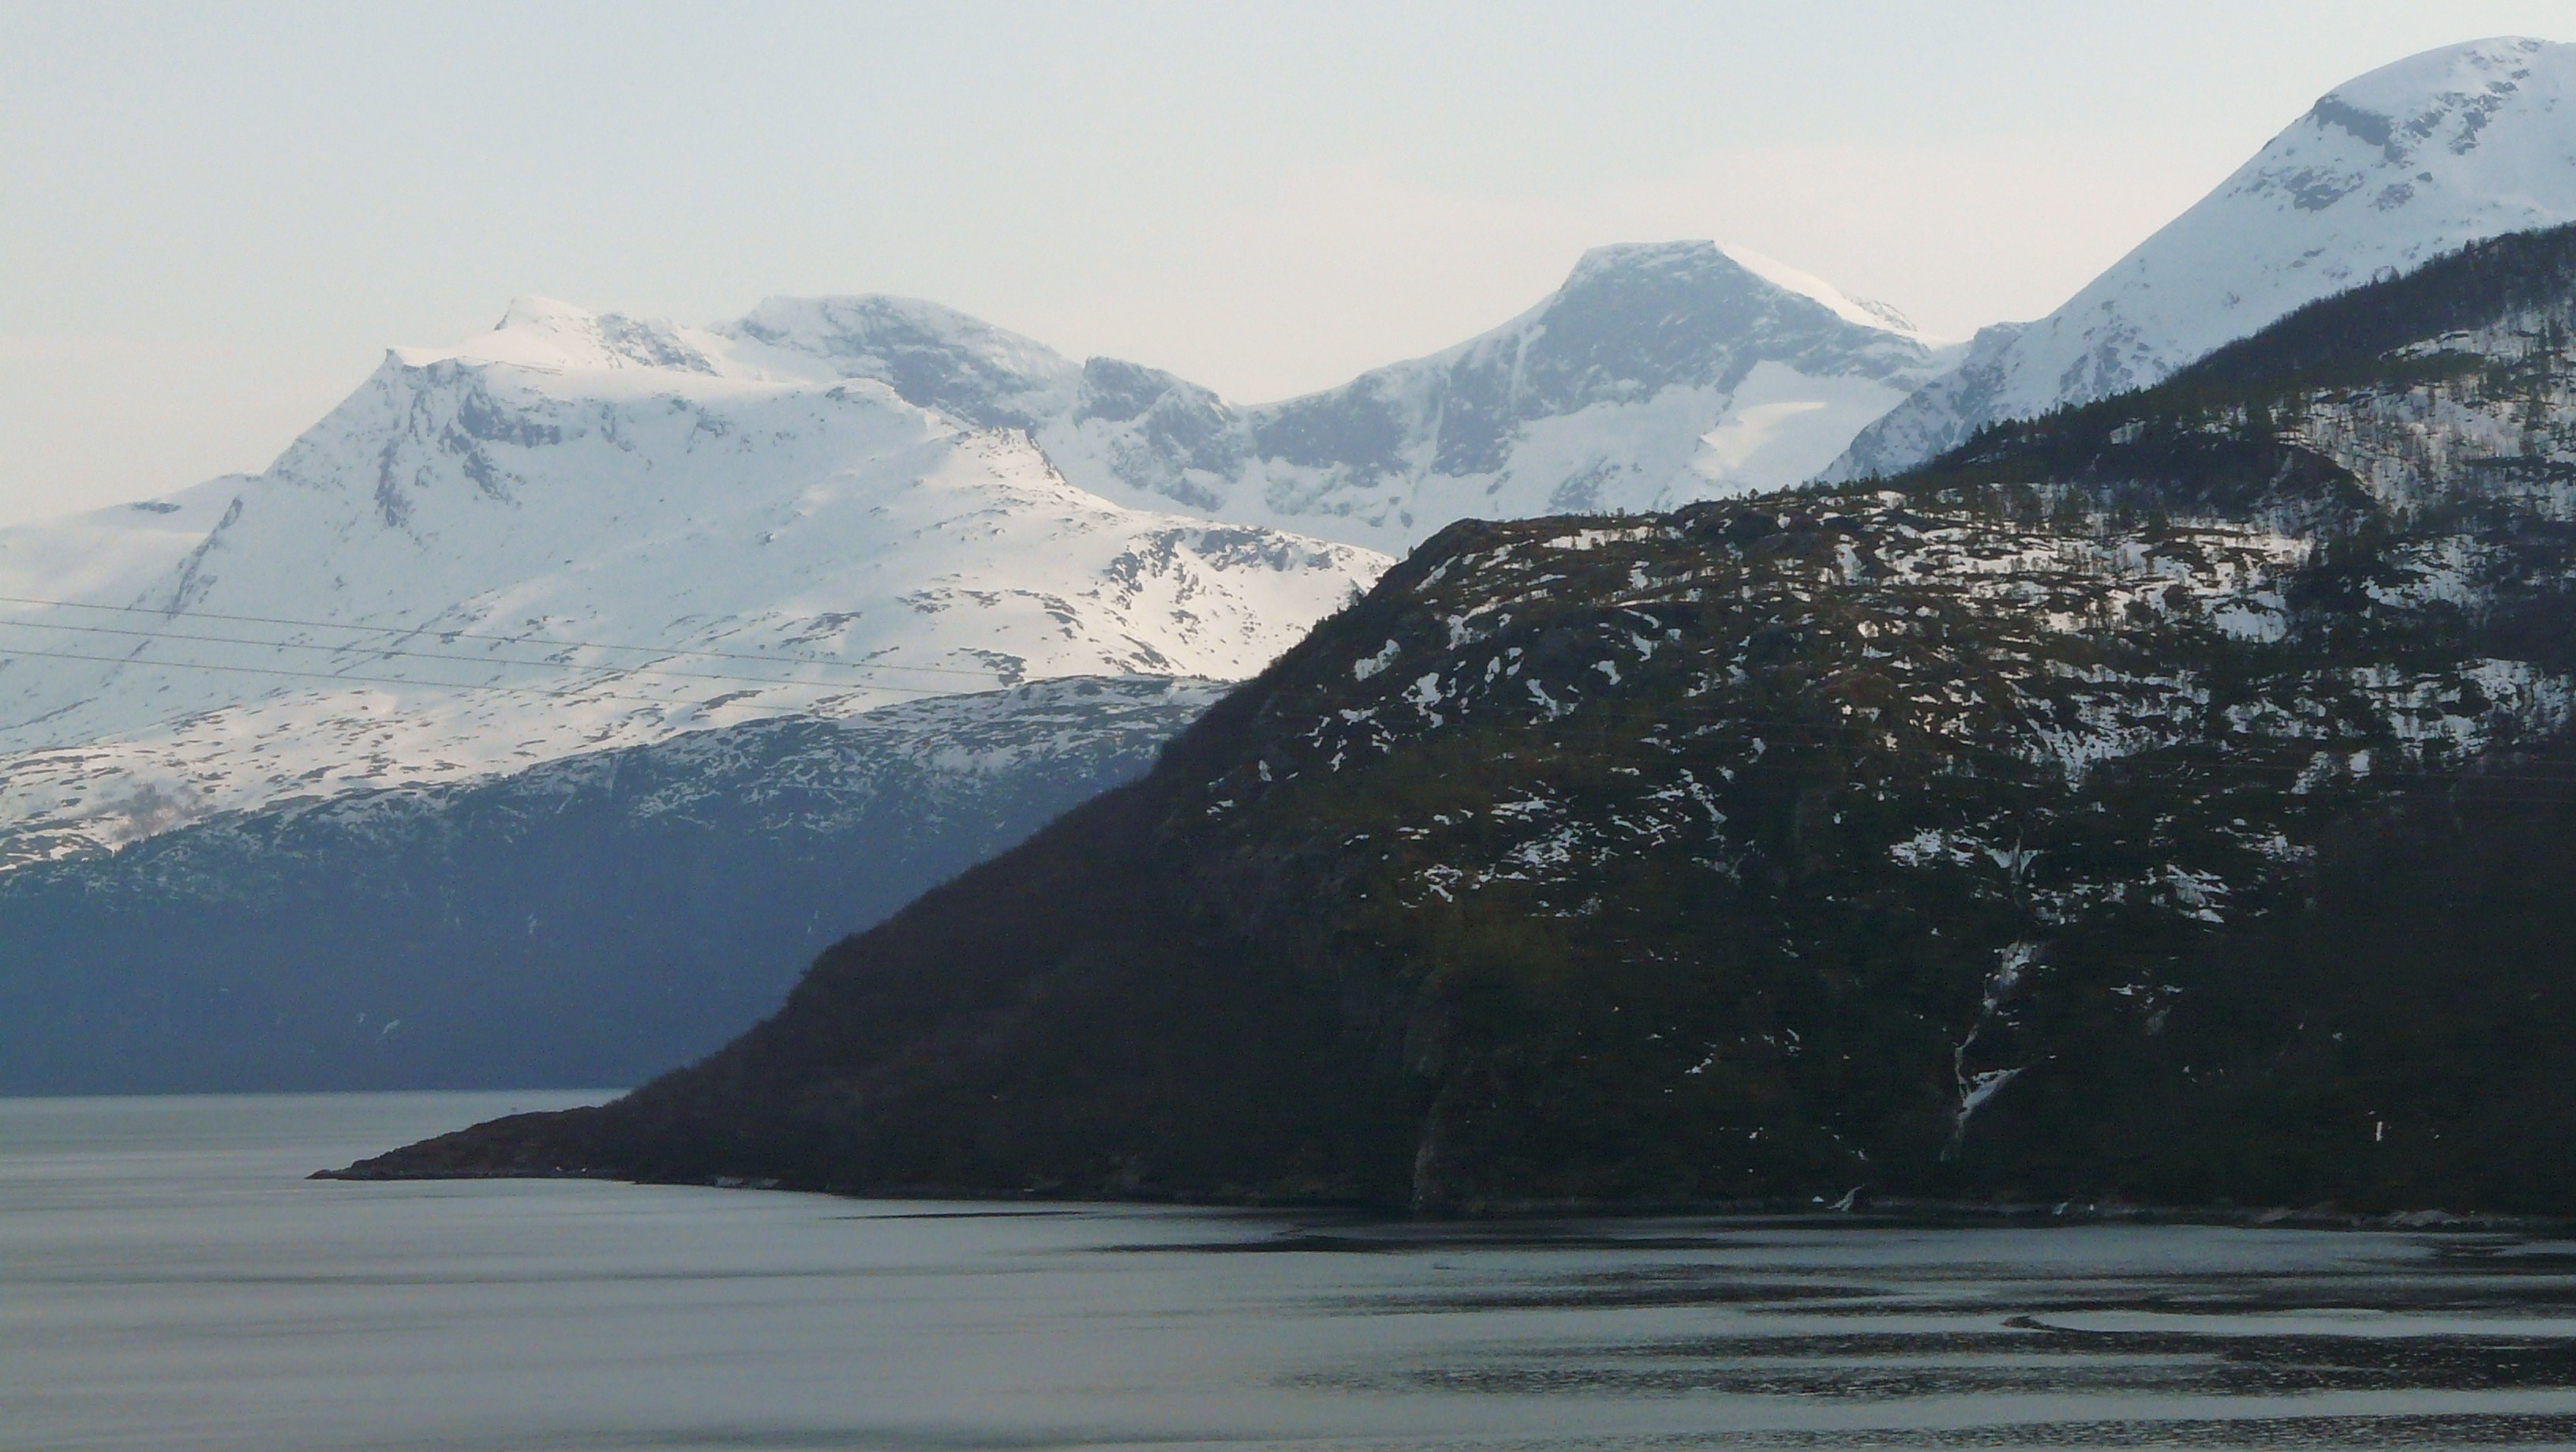
Ankenes
Ankenes is a former municipality in Nordland county, Norway. It encompassed much of the present-day municipality of Narvik, outside of the city of Narvik. Today, Ankenes is a largely residential area west of Narvik, located on the southern side of Be..
Ankenes Wikipedia Page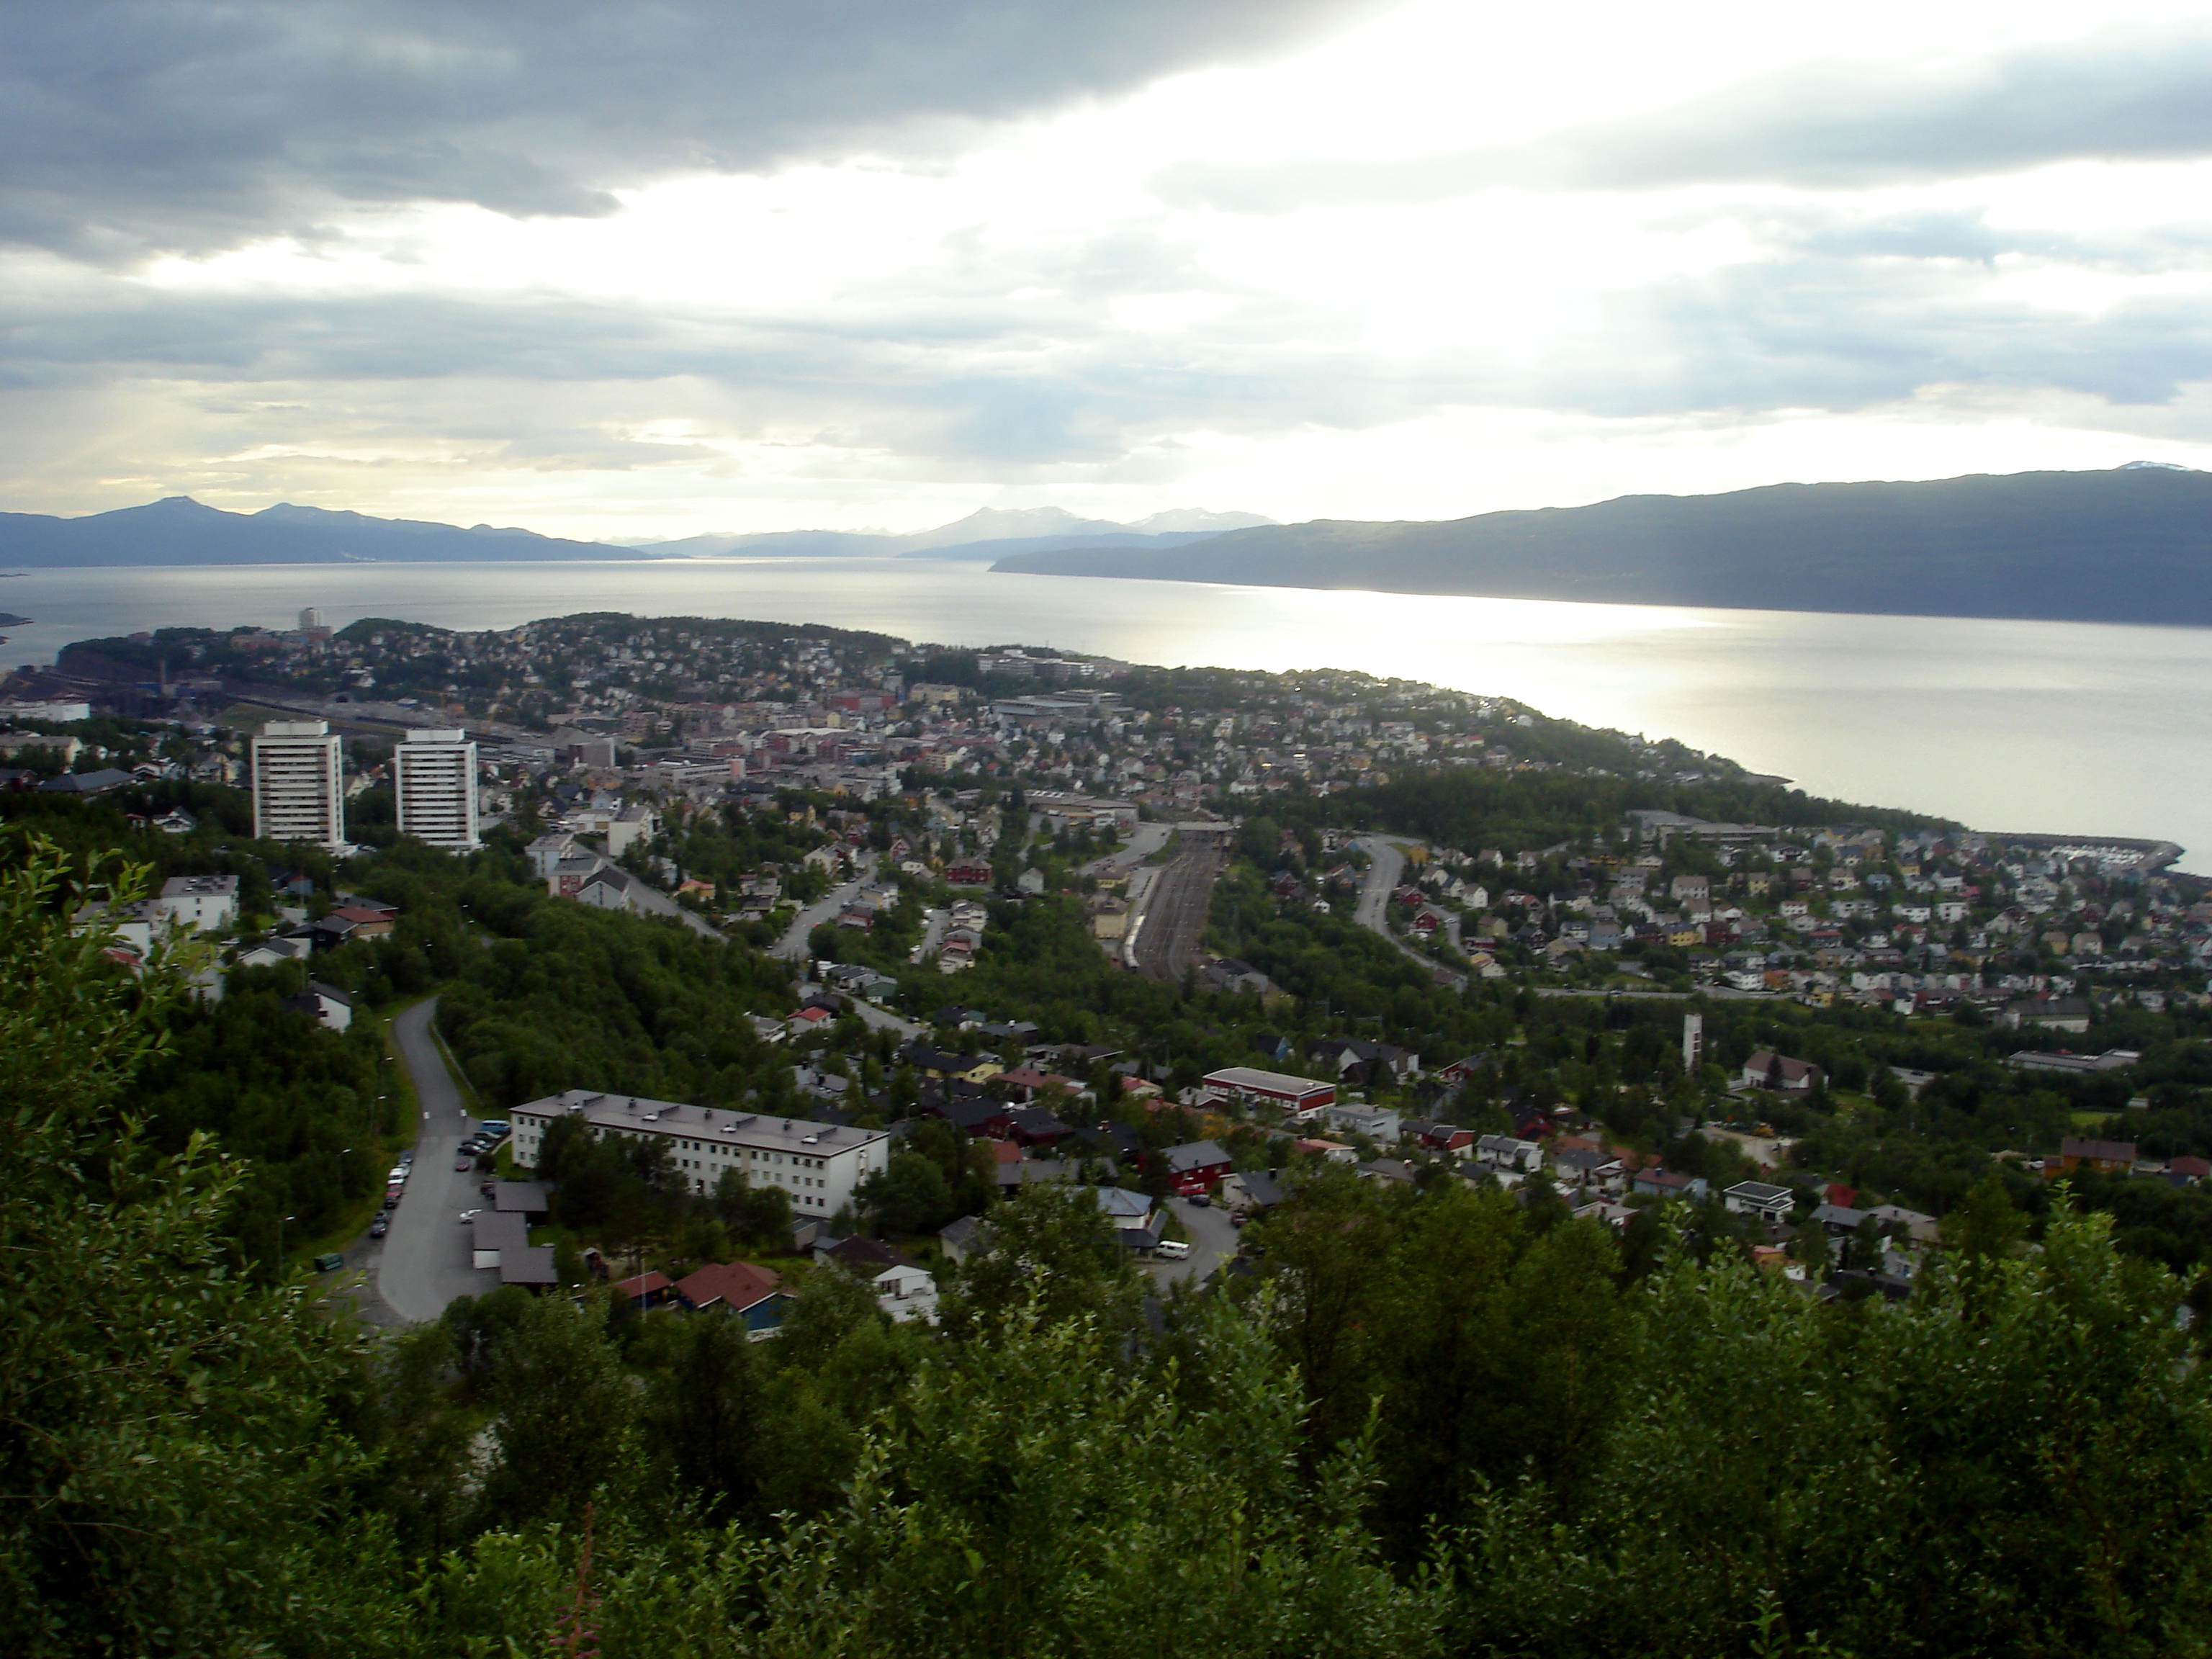
About Our Data
The data on this page is estimated using a number of publicly available tools and resources. It is provided without warranty, and could contain inaccuracies. Use at your own risk.