Categories in Bugøynes
Industries
Business Distribution by Industry in Bugøynes
| Industry Description | Number of Establishments |
|---|---|
| Commercial fishing and hunting | 12 |
Bugøynes Facts
| Area | 0.4 km² |
| Population | 78 |
| Population change (1975 to 2020) | +188.9% |
| Population change (2000 to 2020) | +212.0% |
| Local Time | |
| Timezone | Central European Summer Time |
| Lat & Lng | 69.97295, 29.64231 |
| Postal Codes | 9935 |
Map of Bugøynes
Interactive Map
Bugøynes Population
Years 1975 to 2030
| Data | 1975 | 1990 | 2000 | 2015 | 2020 | 2025* | 2030* |
|---|---|---|---|---|---|---|---|
| Population | 27 | 25 | 25 | 28 | 78 | 76 | 75 |
| Population Density | 61.7 / km² | 57.1 / km² | 57.1 / km² | 64 / km² | 178.3 / km² | 173.7 / km² | 171.4 / km² |
Bugøynes Population change from 2000 to 2020
Increase of 212% from year 2000 to 2020
| Location | Change since 1975 | Change since 1990 | Change since 2000 |
|---|---|---|---|
| Bugøynes | +188.9% | +212% | +212% |
| Finnmark | — | — | — |
| Norway | — | — | — |
Bugøynes Population Density
Population Density: 178 / km²
| Location | Population | Area | Density |
|---|---|---|---|
| Bugøynes | 78 | 0.438 km² | 178 / km² |
| Finnmark | 75,051 | 74,273.1 km² | 1 / km² |
| Norway | 4.9 million | 322,754.2 km² | 15.2 / km² |
Bugøynes Historical and Projected Population
Estimated Population from 1975 to 2100
- JRC (European Commission's Joint Research Centre) work on the GHS built-up grid
- CIESIN (Center for International Earth Science Information Network)
- [Link] Klein Goldewijk, K., Beusen, A., Doelman, J., and Stehfest, E.: Anthropogenic land use estimates for the Holocene – HYDE 3.2, Earth Syst. Sci. Data, 9, 927–953, https://doi.org/10.5194/essd-9-927-2017, 2017.
Area Codes
Percentage Area Codes used by businesses in Bugøynes
Price Distribution
Business distribution by price for Bugøynes
Human Development Index (HDI)
Statistic composite index of life expectancy, education, and per capita income.
Bugøynes CO2 Emissions
Carbon Dioxide (CO2) Emissions Per Capita in Tonnes Per Year
| Location | CO2 Emissions | CO2 Emissions Per Capita | CO2 Emissions Intensity |
|---|---|---|---|
| Bugøynes | 716 tn | 9.18 tn | 1,636.1 tons/km² |
| Finnmark | 888,612 tn | 11.84 tn | 12 tons/km² |
| Norway | 86,855,170 tn | 17.74 tn | 269.1 tons/km² |
| 2013 CO2 emissions (tonnes/year) | 716 tn |
| 2013 CO2 emissions (tonnes/year) per capita | 9.18 tn |
| 2013 CO2 emissions intensity (tonnes/km²/year) | 1,636.1 tons/km² |
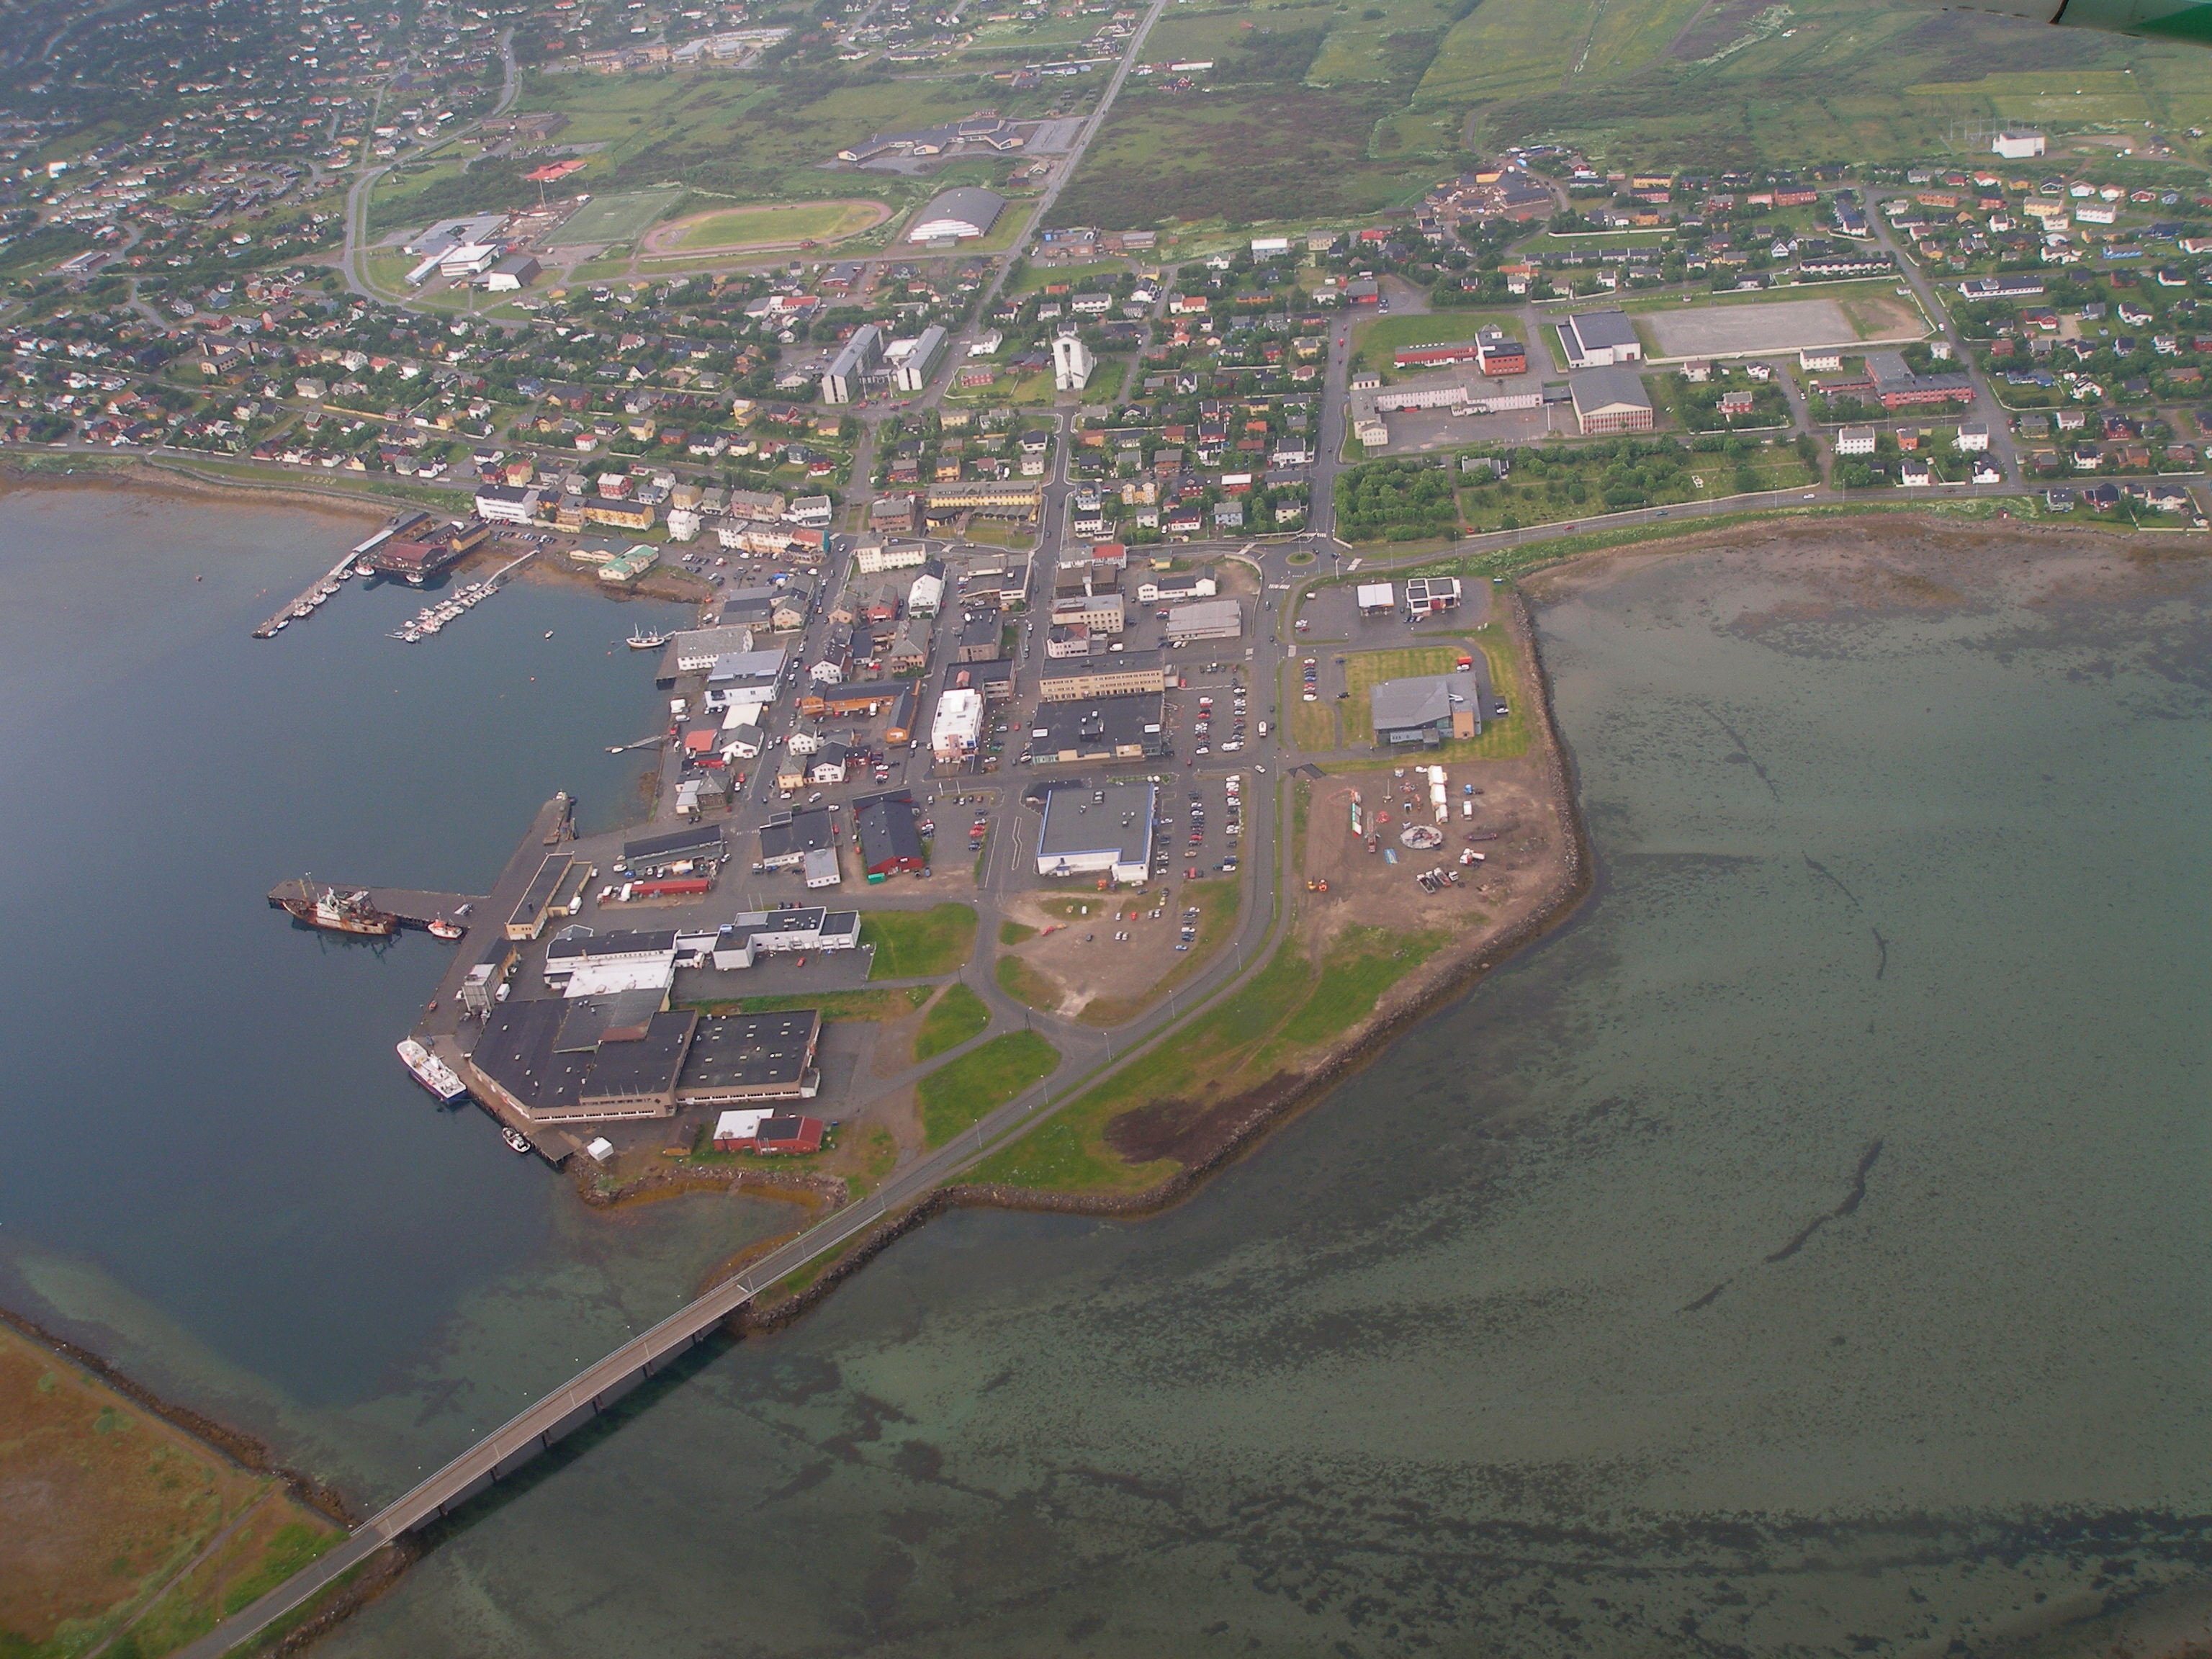
Bugøynes
Bugøynes (Finnish: Pykeijä) is a fishing village in Sør-Varanger Municipality in Finnmark county in northeastern Norway. The village is situated along the Varangerfjorden which is a vast bay off the Barents Sea (a part of the Arctic Ocean), near th..
Bugøynes Wikipedia Page
About Our Data
The data on this page is estimated using a number of publicly available tools and resources. It is provided without warranty, and could contain inaccuracies. Use at your own risk.