Categories in Disenå
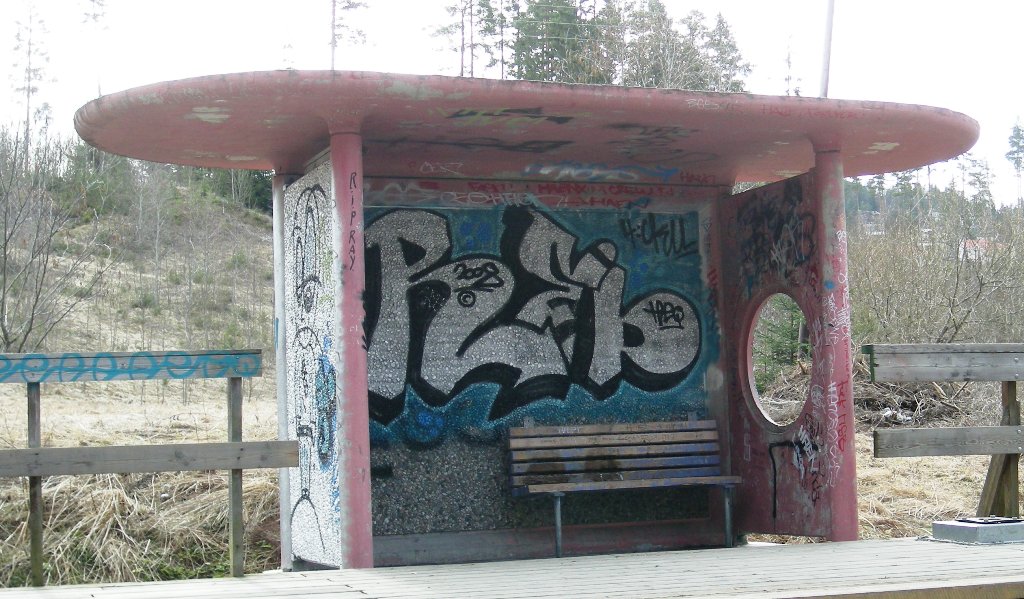
Industries
Business Distribution by Industry in Disenå
| Industry Description | Number of Establishments |
|---|---|
| Unreachable | 25 |
| Buses and trains | 11 |
Disenå Facts
| Area | 1.1 km² |
| Population | 313 |
| Male Population | 155 (49.4%) |
| Female Population | 158 (50.6%) |
| Population change (1975 to 2020) | -41.9% |
| Population change (2000 to 2020) | -7.9% |
| Median Age | 42.8 years (Male: 42.5, Female: 43.2) |
| Local Time | |
| Timezone | Central European Summer Time |
| Lat & Lng | 60.20659, 11.64156 |
| Postal Codes | 2114 |
Map of Disenå
Interactive Map
Disenå Population
Years 1975 to 2020
| Data | 1975 | 1990 | 2000 | 2015 | 2020 |
|---|---|---|---|---|---|
| Population | 539 | 414 | 340 | 299 | 313 |
| Population Density | 507.3 / km² | 389.6 / km² | 320 / km² | 281.4 / km² | 294.6 / km² |
Sources: JRC (European Commission's Joint Research Centre) work on the GHS built-up grid
Disenå Population change from 2000 to 2015
Decrease of 12.1% from year 2000 to 2015
| Location | Change since 1975 | Change since 1990 | Change since 2000 |
|---|---|---|---|
| Disenå | -44.5% | -27.8% | -12.1% |
| Hedmark | -0.5% | +3.1% | +4.2% |
| Norway | +30.2% | +23.2% | +16.4% |
Sources: JRC (European Commission's Joint Research Centre) work on the GHS built-up grid
Disenå Median Age
Median Age: 42.8 years
| Location | Median Age | Median Age (Female) | Median Age (Male) |
|---|---|---|---|
| Disenå | 42.8 yrs | 43.2 yrs | 42.5 yrs |
| Hedmark | 43 yrs | 44.1 yrs | 41.8 yrs |
| Norway | 38.8 yrs | 39.6 yrs | 38 yrs |
Sources: CIESIN (Center for International Earth Science Information Network)
Disenå Population Density
Population Density: 295 / km²
| Location | Population | Area | Density |
|---|---|---|---|
| Disenå | 313 | 1.063 km² | 295 / km² |
| Hedmark | 196,387 | 27,409.6 km² | 7.2 / km² |
| Norway | 4.9 million | 322,754.2 km² | 15.2 / km² |
Sources: JRC (European Commission's Joint Research Centre) work on the GHS built-up grid
Disenå Historical and Projected Population
Estimated Population from 0 to 2100
Sources:
- JRC (European Commission's Joint Research Centre) work on the GHS built-up grid
- CIESIN (Center for International Earth Science Information Network)
- [Link] Klein Goldewijk, K., Beusen, A., Doelman, J., and Stehfest, E.: Anthropogenic land use estimates for the Holocene – HYDE 3.2, Earth Syst. Sci. Data, 9, 927–953, https://doi.org/10.5194/essd-9-927-2017, 2017.
Area Codes
Percentage Area Codes used by businesses in Disenå
Human Development Index (HDI)
Statistic composite index of life expectancy, education, and per capita income.
Source: [Link] Kummu, M., Taka, M. &Guillaume, J. Gridded global datasets for Gross Domestic Product and Human Development Index over 1990–2015. Sci Data 5, 180004 (2018) doi:10.1038/sdata.2018.4
Disenå CO2 Emissions
Carbon Dioxide (CO2) Emissions Per Capita in Tonnes Per Year
| Location | CO2 Emissions | CO2 Emissions Per Capita | CO2 Emissions Intensity |
|---|---|---|---|
| Disenå | 5,649 tn | 18.05 tn | 5,316.8 tons/km² |
| Hedmark | 3,538,521 tn | 18.02 tn | 129.1 tons/km² |
| Norway | 86,855,170 tn | 17.74 tn | 269.1 tons/km² |
Sources: [Link] Moran, D., Kanemoto K; Jiborn, M., Wood, R., Többen, J., and Seto, K.C. (2018) Carbon footprints of 13,000 cities. Environmental Research Letters DOI: 10.1088/1748-9326/aac72a
Disenå CO2 Emissions
| 2013 CO2 emissions (tonnes/year) | 5,649 tn |
| 2013 CO2 emissions (tonnes/year) per capita | 18.05 tn |
| 2013 CO2 emissions intensity (tonnes/km²/year) | 5,316.8 tons/km² |
Recent Nearby Earthquakes
Magnitude 3.0 and greater
| Date▼ | Time↕ | Magnitude↕ | Distance↕ | Depth↕ | Location↕ | Link |
|---|---|---|---|---|---|---|
| 4/7/04 | 8:53 AM | 3.4 | 33.3 km | 22,900 m | southern Norway | usgs.gov |
| 11/19/94 | 9:07 AM | 3.5 | 27.2 km | 10,000 m | southern Norway | usgs.gov |
| 11/27/93 | 6:57 PM | 3.1 | 20.4 km | 10,000 m | southern Norway | usgs.gov |
| 11/12/93 | 7:54 PM | 3.4 | 66 km | 10,000 m | Sweden | usgs.gov |
Source: U.S. Geological Survey (USGS)
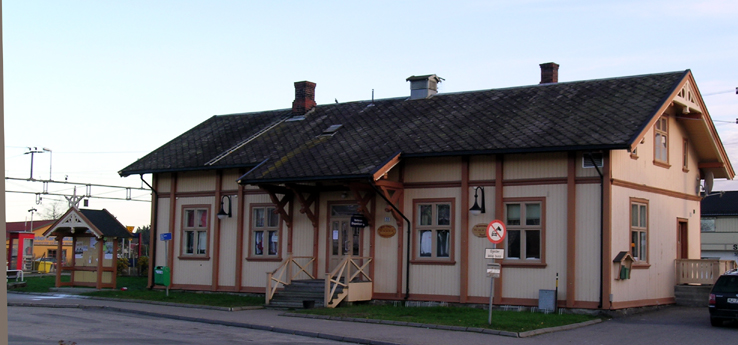
Disenå
Disenå is a village in the municipality of Sør-Odal, Norway. Its population (2005) is 284. Every August the Audunbakkenfestivalen is held.
Disenå Wikipedia Page
About Our Data
The data on this page is estimated using a number of publicly available tools and resources. It is provided without warranty, and could contain inaccuracies. Use at your own risk.