Categories in Dombås
Industries
Business Distribution by Industry in Dombås
| Industry Description | Number of Establishments |
|---|---|
| Unreachable | 59 |
| Buses and trains | 17 |
| Other accommodation | 17 |
| Shopping | 10 |
| Construction of buildings | 10 |
| Beauty salons | 7 |
| Civil engineering | 7 |
| Corporate management | 7 |
| Car repair | 6 |
| General cleaning services | 6 |
| Restaurants | 6 |
| Hotels and motels | 6 |
| Gas station | 5 |
| Zoos and aquariums | 5 |
| Wholesalers | 5 |
| Campgrounds | 5 |
Map of Dombås
Interactive Map
Dombås Population
Years 1975 to 2015
| Data | 1975 | 1990 | 2000 | 2015 |
|---|---|---|---|---|
| Population | 0 | 0 | 0 | 0 |
| Population Density | 0 / km² | 0 / km² | 0 / km² | 0 / km² |
Dombås Population change from 2000 to 2000
| Location | Change since 1975 | Change since 1990 |
|---|---|---|
| Dombås | — | — |
| Oppland | -4.5% | -1.1% |
| Norway | +11.9% | +5.8% |
Oppland Population Density
Population Density: 7.6 / km²
| Location | Population | Area | Density |
|---|---|---|---|
| Oppland | 190,710 | 25,191.6 km² | 7.6 / km² |
| Norway | 4.9 million | 322,754.2 km² | 15.2 / km² |
Dombås Historical and Projected Population
Estimated Population from 1975 to 2015
- JRC (European Commission's Joint Research Centre) work on the GHS built-up grid
- CIESIN (Center for International Earth Science Information Network)
- [Link] Klein Goldewijk, K., Beusen, A., Doelman, J., and Stehfest, E.: Anthropogenic land use estimates for the Holocene – HYDE 3.2, Earth Syst. Sci. Data, 9, 927–953, https://doi.org/10.5194/essd-9-927-2017, 2017.
Area Codes
Percentage Area Codes used by businesses in Dombås
Price Distribution
Business distribution by price for Dombås
Human Development Index (HDI)
Statistic composite index of life expectancy, education, and per capita income.
Oppland CO2 Emissions
Carbon Dioxide (CO2) Emissions Per Capita in Tonnes Per Year
| Location | CO2 Emissions | CO2 Emissions Per Capita | CO2 Emissions Intensity |
|---|---|---|---|
| Oppland | 3,458,425 tn | 18.13 tn | 137.3 tons/km² |
| Norway | 86,855,170 tn | 17.74 tn | 269.1 tons/km² |
| 2013 CO2 emissions (tonnes/year) | 3,458,425 tn |
| 2013 CO2 emissions (tonnes/year) per capita | 18.13 tn |
| 2013 CO2 emissions intensity (tonnes/km²/year) | 137.3 tons/km² |
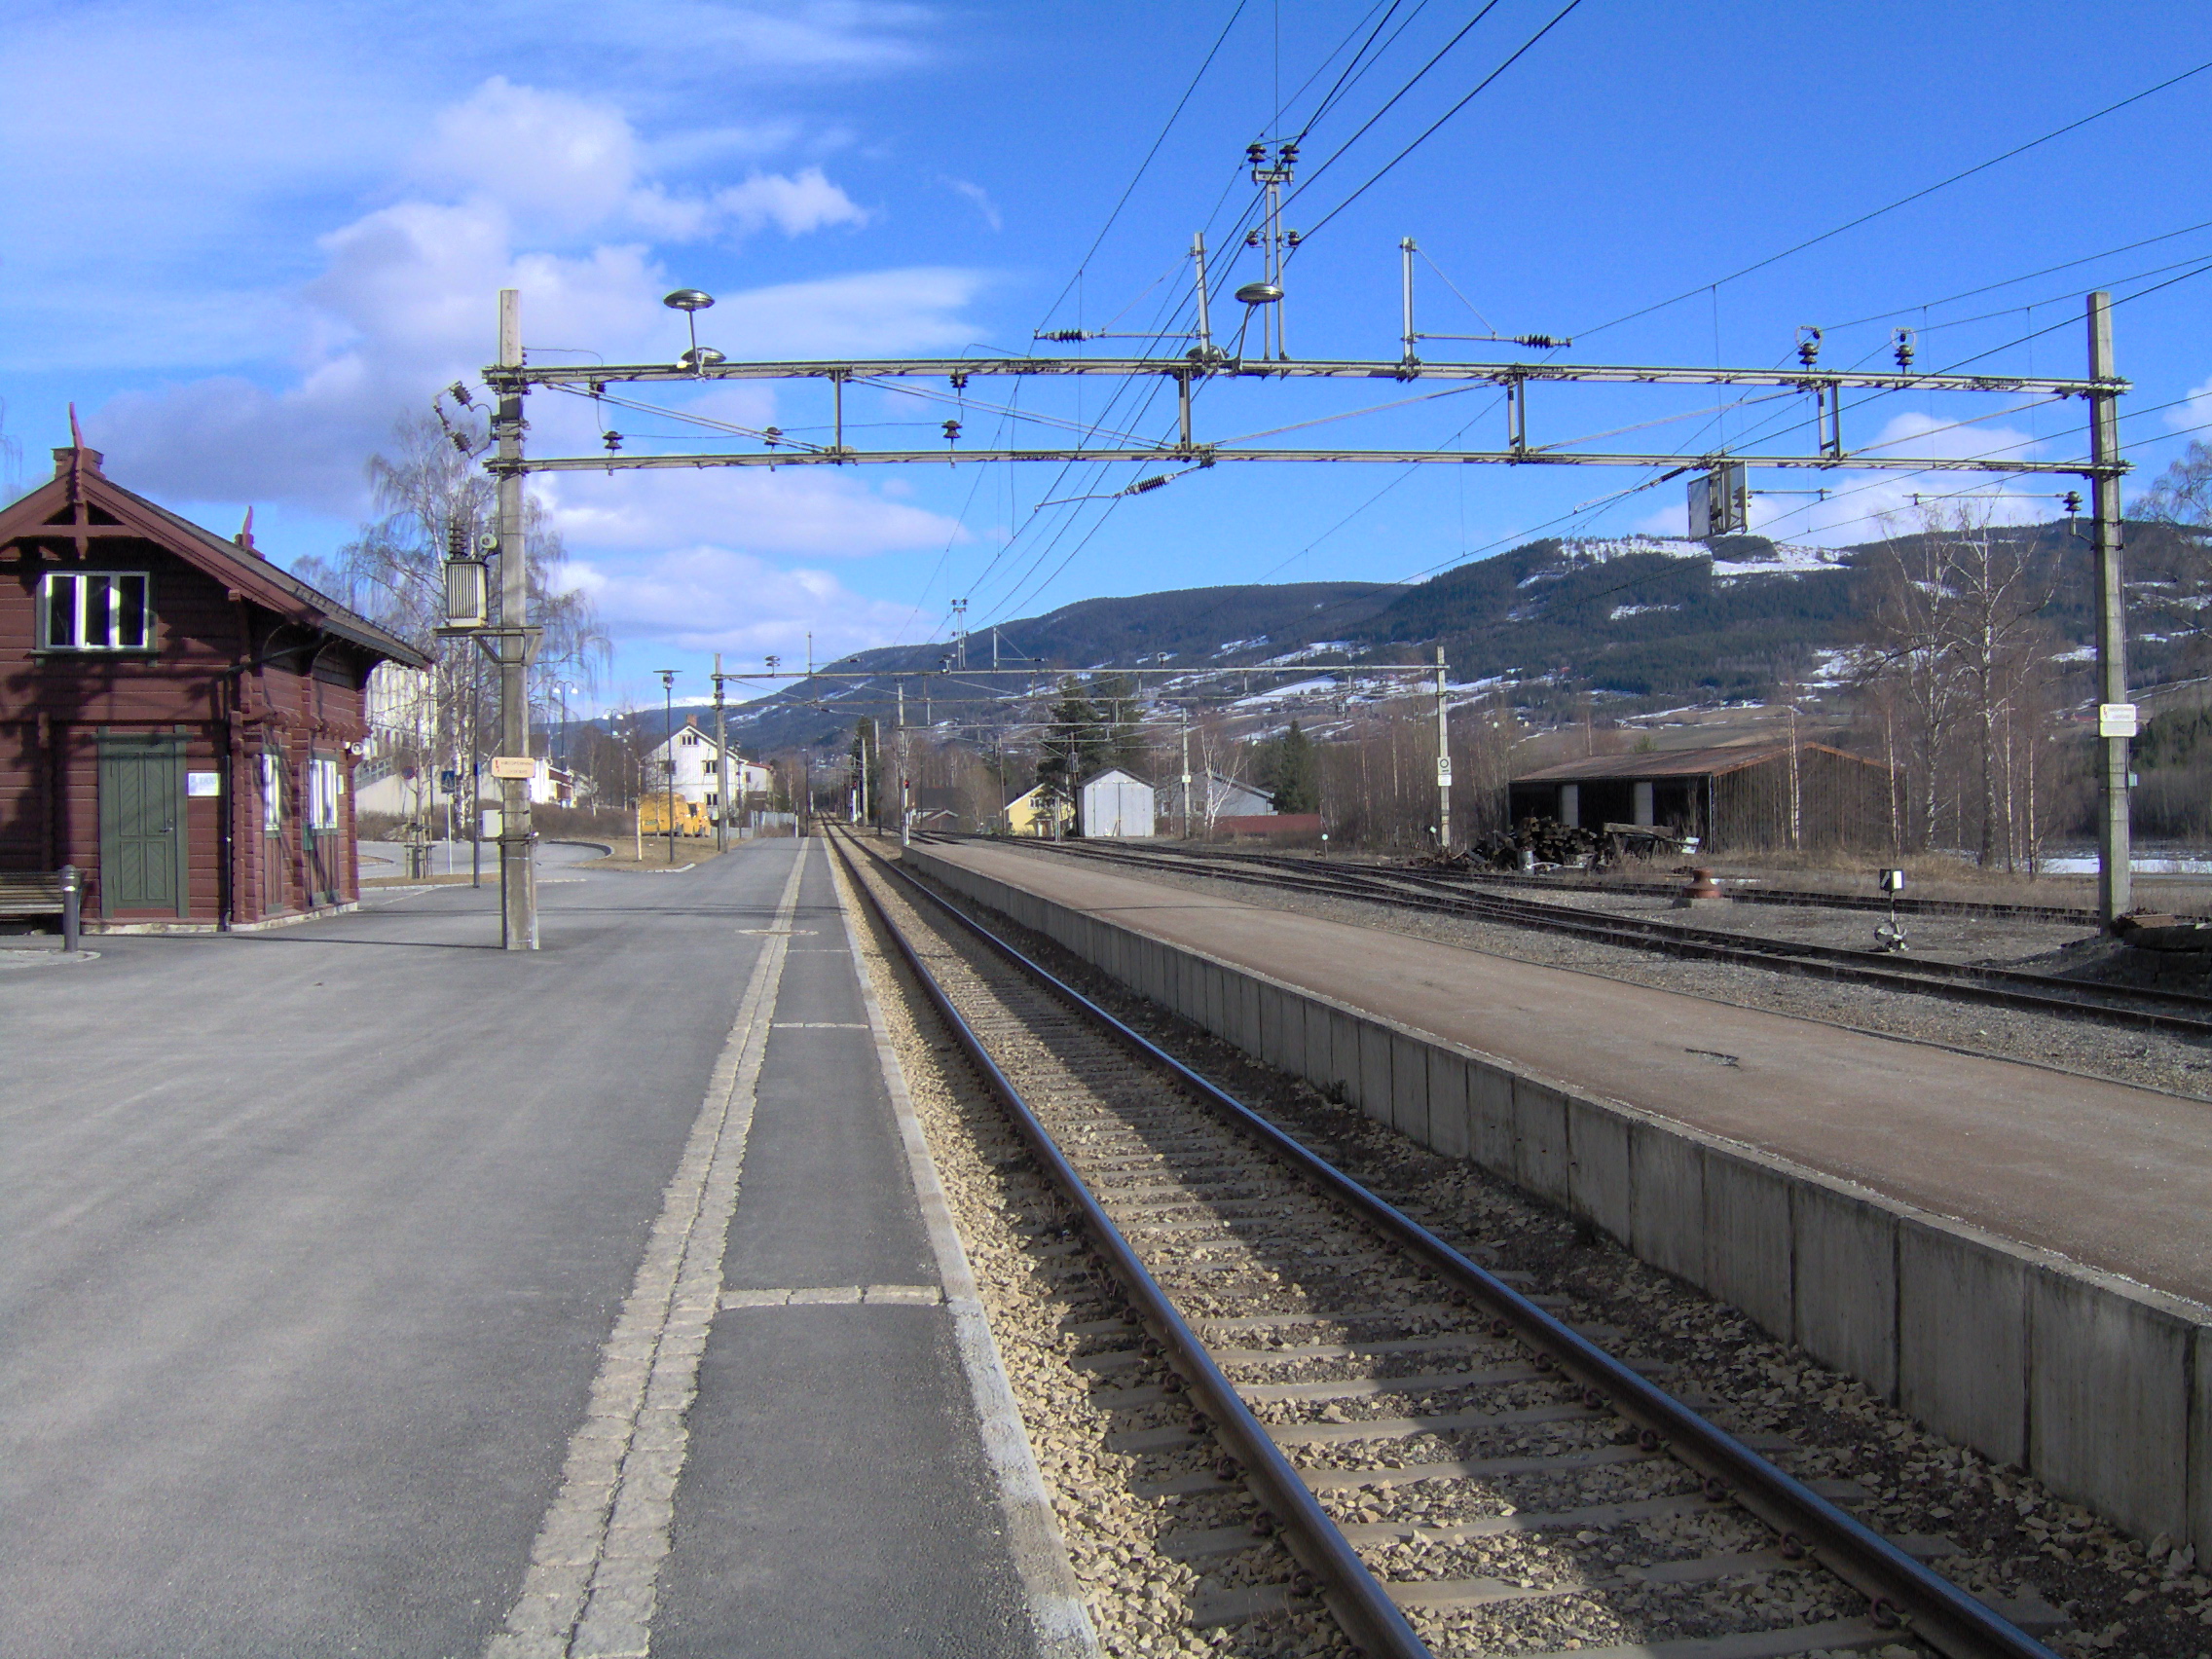
Dombås
The village of Dombås lies in the Dovre municipality and serves as an administrative center in the upper Gudbrandsdal, Norway. It lies at an important junction of roads: south leading to the current capital of Norway, Oslo, west via Lesja leading t..
Dombås Wikipedia Page

About Our Data
The data on this page is estimated using a number of publicly available tools and resources. It is provided without warranty, and could contain inaccuracies. Use at your own risk.