Categories in Flå
Industries
Business Distribution by Industry in Flå
| Industry Description | Number of Establishments |
|---|---|
| Unreachable | 37 |
| Buses and trains | 23 |
| Civil engineering | 19 |
| Construction of houses | 16 |
| Other accommodation | 13 |
| Wholesalers | 7 |
| Real estate | 6 |
| Restaurants | 6 |
| Zoos and aquariums | 5 |
| Transportation logistics | 5 |
Flå Facts
| Area | 1.0 km² |
| Population | 46 |
| Population change (1975 to 2020) | -76.8% |
| Population change (2000 to 2020) | -35.2% |
| Local Time | |
| Timezone | Central European Summer Time |
| Lat & Lng | 60.43021, 9.46197 |
| Postal Codes | 3539 |
Map of Flå
Interactive Map
Flå Population
Years 1975 to 2020
| Data | 1975 | 1990 | 2000 | 2015 | 2020 |
|---|---|---|---|---|---|
| Population | 198 | 116 | 71 | 44 | 46 |
| Population Density | 198 / km² | 116 / km² | 71 / km² | 44 / km² | 46 / km² |
Flå Population change from 2000 to 2015
Decrease of 38% from year 2000 to 2015
| Location | Change since 1975 | Change since 1990 | Change since 2000 |
|---|---|---|---|
| Flå | -77.8% | -62.1% | -38% |
| Buskerud | +31.4% | +22.9% | +15.7% |
| Norway | +30.2% | +23.2% | +16.4% |
Flå Population Density
Population Density: 46 / km²
| Location | Population | Area | Density |
|---|---|---|---|
| Flå | 46 | 1 km² | 46 / km² |
| Buskerud | 276,719 | 15,054.4 km² | 18.4 / km² |
| Norway | 4.9 million | 322,754.2 km² | 15.2 / km² |
Flå Historical and Projected Population
Estimated Population from 0 to 2100
- JRC (European Commission's Joint Research Centre) work on the GHS built-up grid
- CIESIN (Center for International Earth Science Information Network)
- [Link] Klein Goldewijk, K., Beusen, A., Doelman, J., and Stehfest, E.: Anthropogenic land use estimates for the Holocene – HYDE 3.2, Earth Syst. Sci. Data, 9, 927–953, https://doi.org/10.5194/essd-9-927-2017, 2017.
Area Codes
Percentage Area Codes used by businesses in Flå
Price Distribution
Business distribution by price for Flå
Human Development Index (HDI)
Statistic composite index of life expectancy, education, and per capita income.
Flå CO2 Emissions
Carbon Dioxide (CO2) Emissions Per Capita in Tonnes Per Year
| Location | CO2 Emissions | CO2 Emissions Per Capita | CO2 Emissions Intensity |
|---|---|---|---|
| Flå | 868 tn | 18.88 tn | 868.4 tons/km² |
| Buskerud | 5,164,730 tn | 18.66 tn | 343.1 tons/km² |
| Norway | 86,855,170 tn | 17.74 tn | 269.1 tons/km² |
| 2013 CO2 emissions (tonnes/year) | 868 tn |
| 2013 CO2 emissions (tonnes/year) per capita | 18.88 tn |
| 2013 CO2 emissions intensity (tonnes/km²/year) | 868.4 tons/km² |
Recent Nearby Earthquakes
Magnitude 3.0 and greater
| Date▼ | Time↕ | Magnitude↕ | Distance↕ | Depth↕ | Location↕ | Link |
|---|---|---|---|---|---|---|
| 11/19/94 | 9:07 AM | 3.5 | 99.7 km | 10,000 m | southern Norway | usgs.gov |
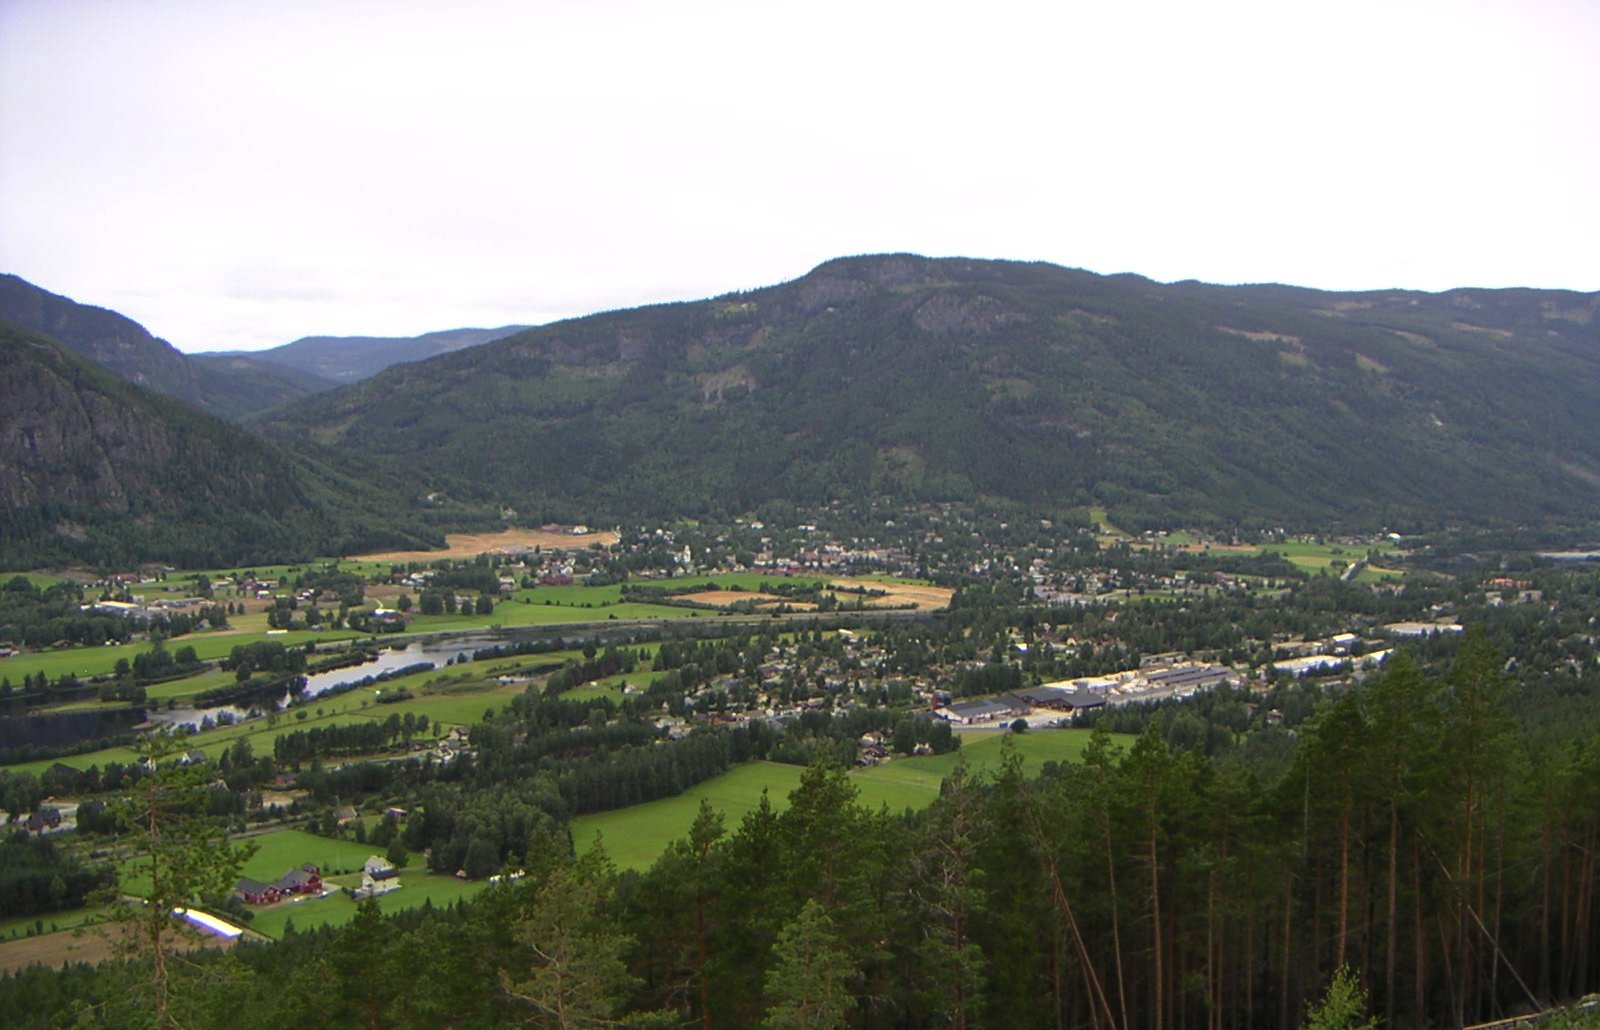
Flå
Flå is a municipality in Buskerud county, Norway. The administrative centre of the municipality is the village of Flå. The municipality of Flå was established when it was separated from the municipality of Nes on 1 January 1905. The municipality lies..
Flå Wikipedia Page

About Our Data
The data on this page is estimated using a number of publicly available tools and resources. It is provided without warranty, and could contain inaccuracies. Use at your own risk.