Categories in Forsand
Industries
Business Distribution by Industry in Forsand
| Industry Description | Number of Establishments | Average Google Rating |
|---|---|---|
| Other accommodation | 8 | 4.3 |
| Construction of buildings | 7 | 4.3 |
| Wholesale of machinery | 7 | 3.9 |
Map of Forsand
Interactive Map
Forsand Population
Years 1975 to 2020
| Data | 1975 | 1990 | 2000 | 2015 | 2020 |
|---|---|---|---|---|---|
| Population | 172 | 223 | 162 | 15 | 16 |
| Population Density | 94.9 / km² | 123 / km² | 89.4 / km² | 8.3 / km² | 8.8 / km² |
Forsand Population change from 2000 to 2015
Decrease of 90.7% from year 2000 to 2015
| Location | Change since 1975 | Change since 1990 | Change since 2000 |
|---|---|---|---|
| Forsand | -91.3% | -93.3% | -90.7% |
| Rogaland | +66.6% | +43% | +26.9% |
| Norway | +30.2% | +23.2% | +16.4% |
Forsand Population Density
Population Density: 8.8 / km²
| Location | Population | Area | Density |
|---|---|---|---|
| Forsand | 16 | 1.813 km² | 8.8 / km² |
| Rogaland | 472,447 | 16,531.3 km² | 28.6 / km² |
| Norway | 4.9 million | 322,754.2 km² | 15.2 / km² |
Forsand Historical and Projected Population
Estimated Population from 0 to 2100
- JRC (European Commission's Joint Research Centre) work on the GHS built-up grid
- CIESIN (Center for International Earth Science Information Network)
- [Link] Klein Goldewijk, K., Beusen, A., Doelman, J., and Stehfest, E.: Anthropogenic land use estimates for the Holocene – HYDE 3.2, Earth Syst. Sci. Data, 9, 927–953, https://doi.org/10.5194/essd-9-927-2017, 2017.
Area Codes
Percentage Area Codes used by businesses in Forsand
Human Development Index (HDI)
Statistic composite index of life expectancy, education, and per capita income.
Forsand CO2 Emissions
Carbon Dioxide (CO2) Emissions Per Capita in Tonnes Per Year
| Location | CO2 Emissions | CO2 Emissions Per Capita | CO2 Emissions Intensity |
|---|---|---|---|
| Forsand | 294 tn | 18.35 tn | 162 tons/km² |
| Rogaland | 5,201,816 tn | 11.01 tn | 314.7 tons/km² |
| Norway | 86,855,170 tn | 17.74 tn | 269.1 tons/km² |
| 2013 CO2 emissions (tonnes/year) | 294 tn |
| 2013 CO2 emissions (tonnes/year) per capita | 18.35 tn |
| 2013 CO2 emissions intensity (tonnes/km²/year) | 162 tons/km² |
Natural Hazards Risk
Relative risk out of 10
| Hazard | Risk Level |
|---|---|
| Earthquake | Low (2) |
* Risk, particularly concerning flood or landslide, may not be for the entire area.
- Dilley, M., R.S. Chen, U. Deichmann, A.L. Lerner-Lam, M. Arnold, J. Agwe, P. Buys, O. Kjekstad, B. Lyon, and G. Yetman. 2005. Natural Disaster Hotspots: A Global Risk Analysis. Washington, D.C.: World Bank. https://doi.org/10.1596/0-8213-5930-4.
- Center for Hazards and Risk Research - CHRR - Columbia University, Center for International Earth Science Information Network - CIESIN - Columbia University. 2005. Global Earthquake Hazard Distribution - Peak Ground Acceleration. Palisades, NY: NASA Socioeconomic Data and Applications Center (SEDAC). https://doi.org/10.7927/H4BZ63ZS.
Recent Nearby Earthquakes
Magnitude 3.0 and greater
| Date▼ | Time↕ | Magnitude↕ | Distance↕ | Depth↕ | Location↕ | Link |
|---|---|---|---|---|---|---|
| 3/14/12 | 7:22 PM | 3.6 | 76 km | 6,200 m | southern Norway | usgs.gov |
| 8/12/00 | 2:27 PM | 4.1 | 93.2 km | 10,000 m | southern Norway | usgs.gov |
| 4/14/92 | 1:10 PM | 3.7 | 72.9 km | 10,000 m | southern Norway | usgs.gov |
| 8/23/91 | 4:07 AM | 3.1 | 22.3 km | 10,000 m | southern Norway | usgs.gov |
| 2/25/90 | 10:00 AM | 3 | 84.9 km | 10,000 m | southern Norway | usgs.gov |
| 1/29/89 | 4:38 PM | 4.8 | 60.2 km | 10,000 m | southern Norway | usgs.gov |
| 3/8/83 | 6:43 PM | 4.8 | 92.9 km | 33,000 m | southern Norway | usgs.gov |
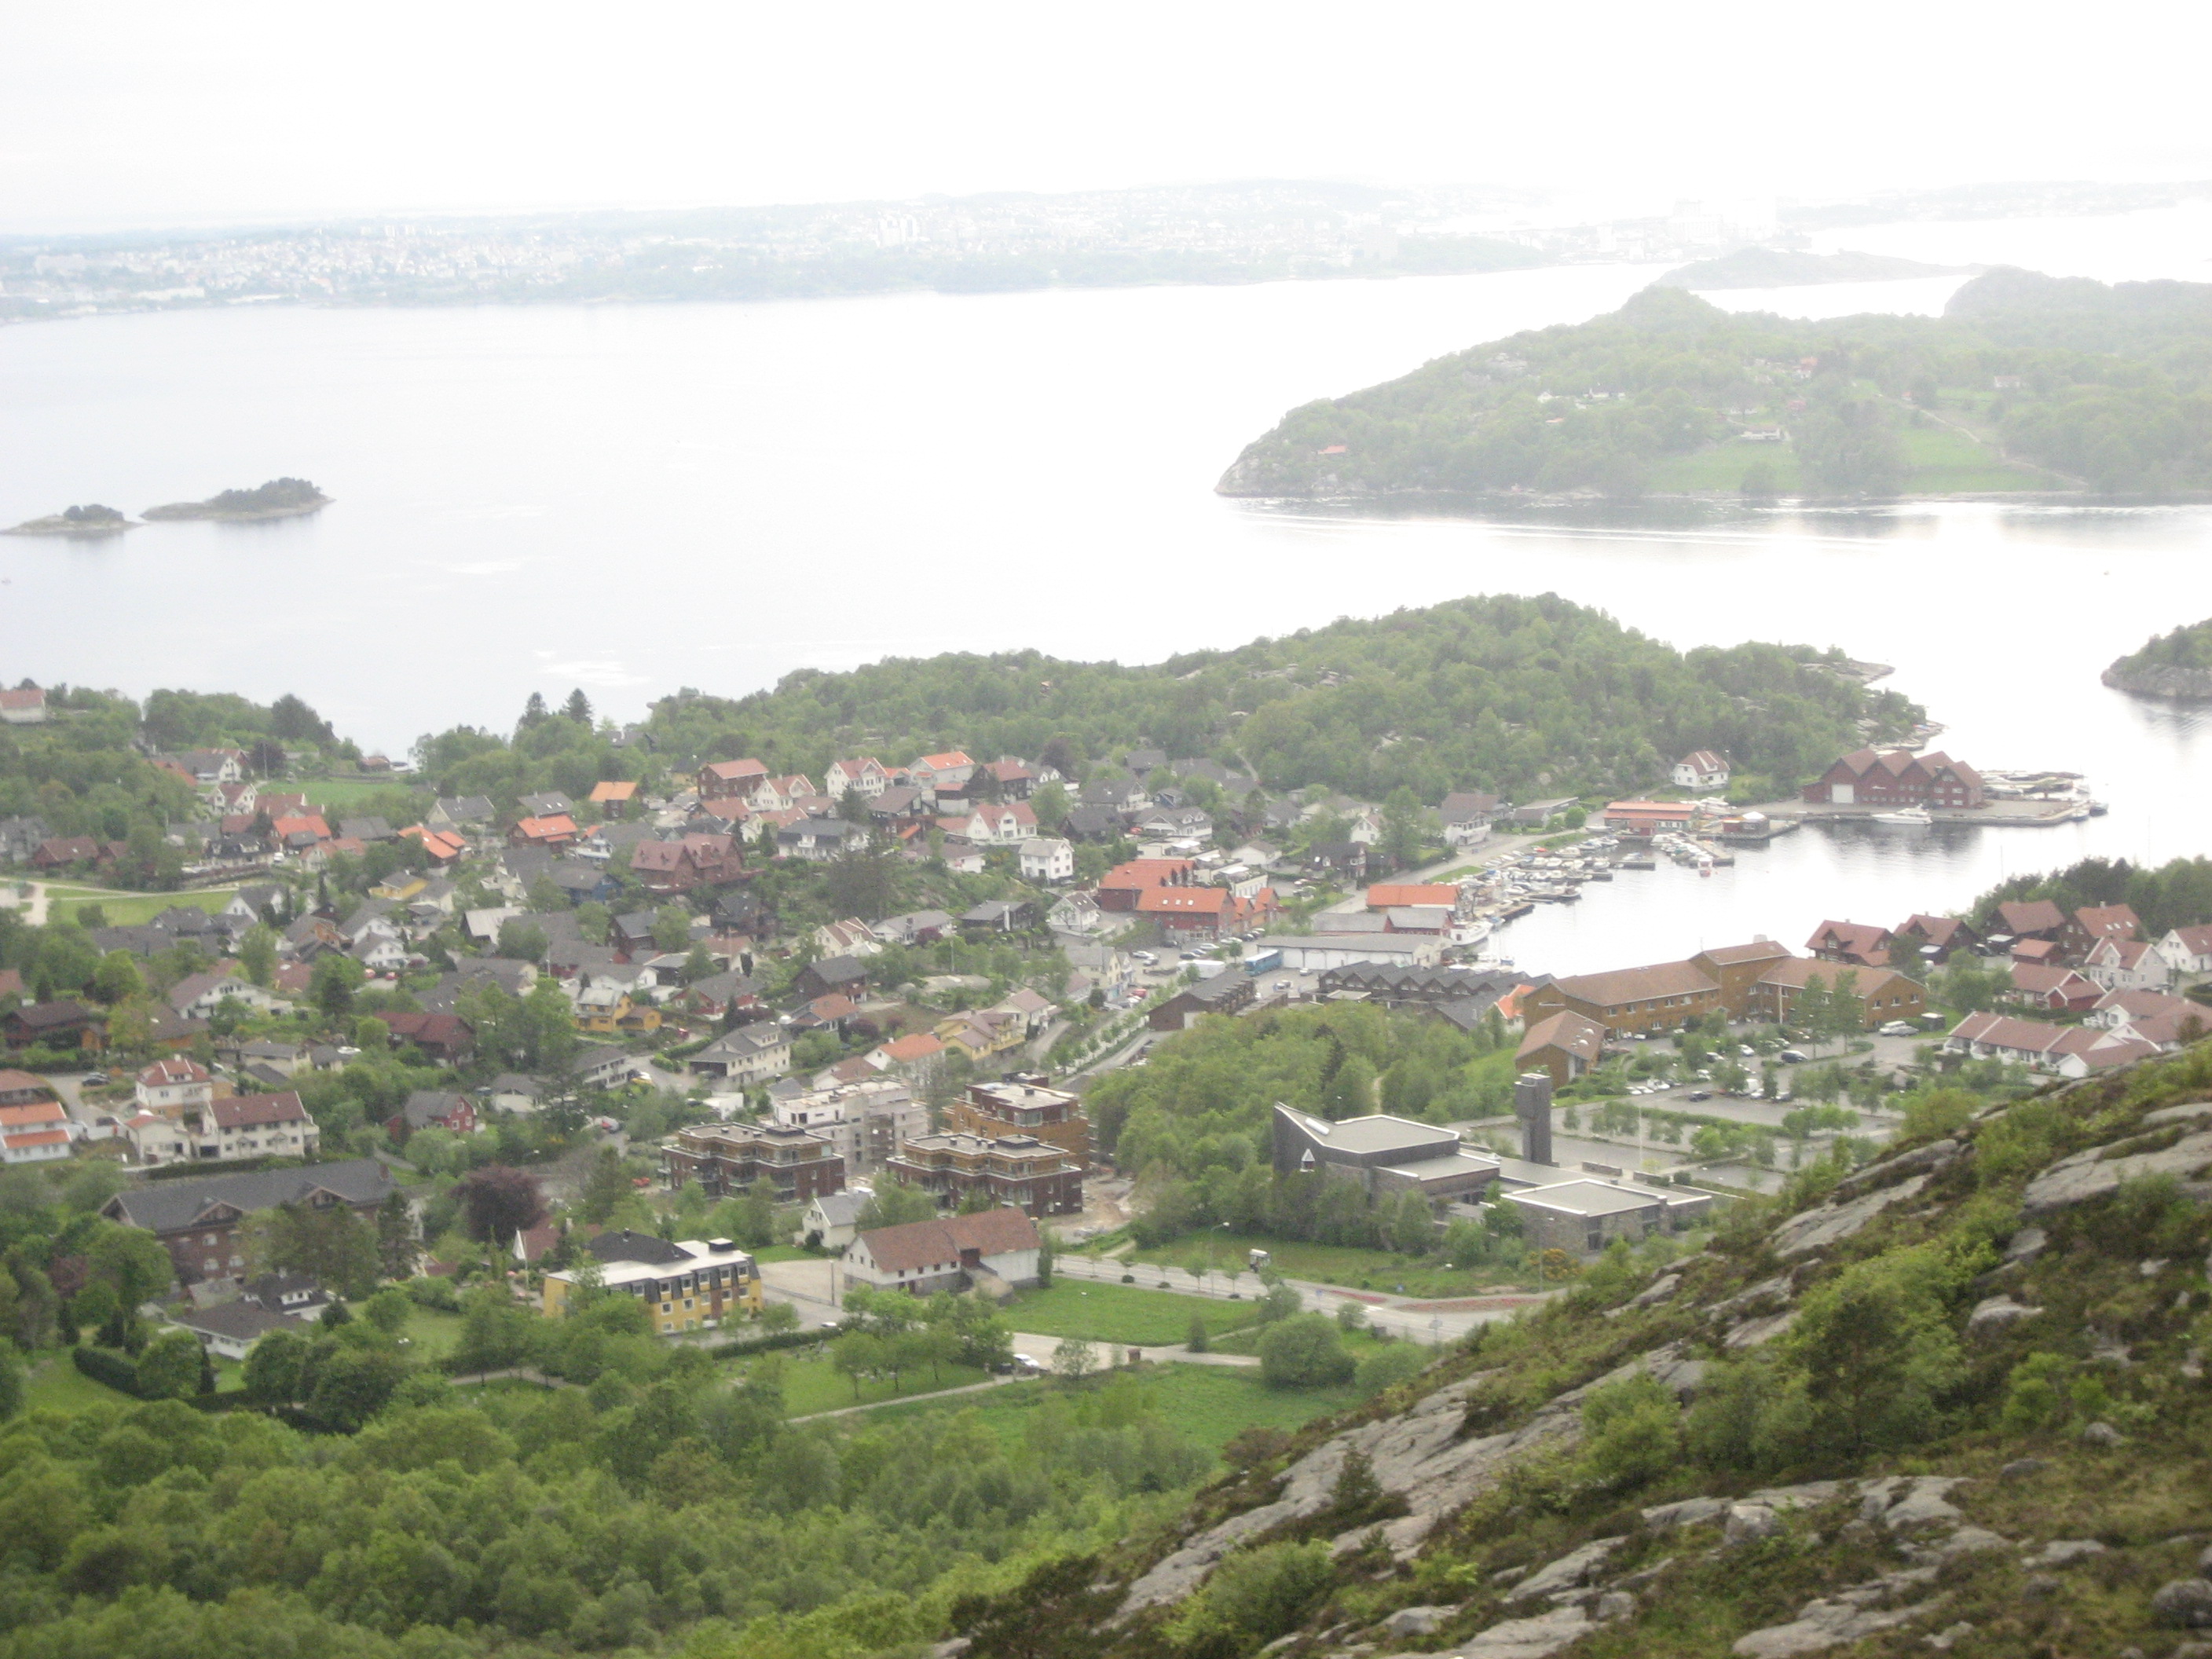
Forsand
Forsand is a municipality in Rogaland county, Norway. Forsand was separated from Høle on 1 January 1871. In 1999, evidence of a population here dating back to around 7500 BC was located. is located within the constraints of two fjords, Lysefjord and..
Forsand Wikipedia Page

About Our Data
The data on this page is estimated using a number of publicly available tools and resources. It is provided without warranty, and could contain inaccuracies. Use at your own risk.