Industries
Business Distribution by Industry in Fåberg
| Industry Description | Number of Establishments |
|---|---|
| Unreachable | 59 |
| Construction of buildings | 46 |
| Buses and trains | 25 |
| Wholesale of machinery | 25 |
| Creative arts | 10 |
| Civil engineering | 10 |
| Wholesale of construction supplies | 10 |
| Other construction | 9 |
| Education | 8 |
| Restaurants | 7 |
| Corporate management | 7 |
Fåberg Facts
| Area | 4.9 km² |
| Population | 3,527 |
| Male Population | 1,710 (48.5%) |
| Female Population | 1,817 (51.5%) |
| Population change (1975 to 2020) | +41.3% |
| Population change (2000 to 2020) | +6.9% |
| Median Age | 41.2 years (Male: 39.7, Female: 42.6) |
| Local Time | |
| Timezone | Central European Summer Time |
| Lat & Lng | 61.16836, 10.40479 |
| Postal Codes | 2625 |
Map of Fåberg
Interactive Map
Fåberg Population
Years 1975 to 2020
| Data | 1975 | 1990 | 2000 | 2015 | 2020 |
|---|---|---|---|---|---|
| Population | 2,496 | 3,208 | 3,300 | 3,319 | 3,527 |
| Population Density | 505.5 / km² | 649.7 / km² | 668.4 / km² | 672.2 / km² | 714.3 / km² |
Fåberg Population change from 2000 to 2015
Increase of 0.6% from year 2000 to 2015
| Location | Change since 1975 | Change since 1990 | Change since 2000 |
|---|---|---|---|
| Fåberg | +33% | +3.5% | +0.6% |
| Oppland | -1.1% | +2.4% | +3.6% |
| Norway | +30.2% | +23.2% | +16.4% |
Fåberg Median Age
Median Age: 41.2 years
| Location | Median Age | Median Age (Female) | Median Age (Male) |
|---|---|---|---|
| Fåberg | 41.2 yrs | 42.6 yrs | 39.7 yrs |
| Oppland | 42.4 yrs | 43.4 yrs | 41.4 yrs |
| Norway | 38.8 yrs | 39.6 yrs | 38 yrs |
Fåberg Population Density
Population Density: 714 / km²
| Location | Population | Area | Density |
|---|---|---|---|
| Fåberg | 3,527 | 4.938 km² | 714 / km² |
| Oppland | 190,710 | 25,191.6 km² | 7.6 / km² |
| Norway | 4.9 million | 322,754.2 km² | 15.2 / km² |
Fåberg Historical and Projected Population
Estimated Population from 1600 to 2100
- JRC (European Commission's Joint Research Centre) work on the GHS built-up grid
- CIESIN (Center for International Earth Science Information Network)
- [Link] Klein Goldewijk, K., Beusen, A., Doelman, J., and Stehfest, E.: Anthropogenic land use estimates for the Holocene – HYDE 3.2, Earth Syst. Sci. Data, 9, 927–953, https://doi.org/10.5194/essd-9-927-2017, 2017.
Area Codes
Percentage Area Codes used by businesses in Fåberg
Human Development Index (HDI)
Statistic composite index of life expectancy, education, and per capita income.
Fåberg CO2 Emissions
Carbon Dioxide (CO2) Emissions Per Capita in Tonnes Per Year
| Location | CO2 Emissions | CO2 Emissions Per Capita | CO2 Emissions Intensity |
|---|---|---|---|
| Fåberg | 63,956 tn | 18.13 tn | 12,953.2 tons/km² |
| Oppland | 3,458,425 tn | 18.13 tn | 137.3 tons/km² |
| Norway | 86,855,170 tn | 17.74 tn | 269.1 tons/km² |
| 2013 CO2 emissions (tonnes/year) | 63,956 tn |
| 2013 CO2 emissions (tonnes/year) per capita | 18.13 tn |
| 2013 CO2 emissions intensity (tonnes/km²/year) | 12,953.2 tons/km² |
Recent Nearby Earthquakes
Magnitude 3.0 and greater
| Date▼ | Time↕ | Magnitude↕ | Distance↕ | Depth↕ | Location↕ | Link |
|---|---|---|---|---|---|---|
| 4/7/04 | 8:53 AM | 3.4 | 95.7 km | 22,900 m | southern Norway | usgs.gov |
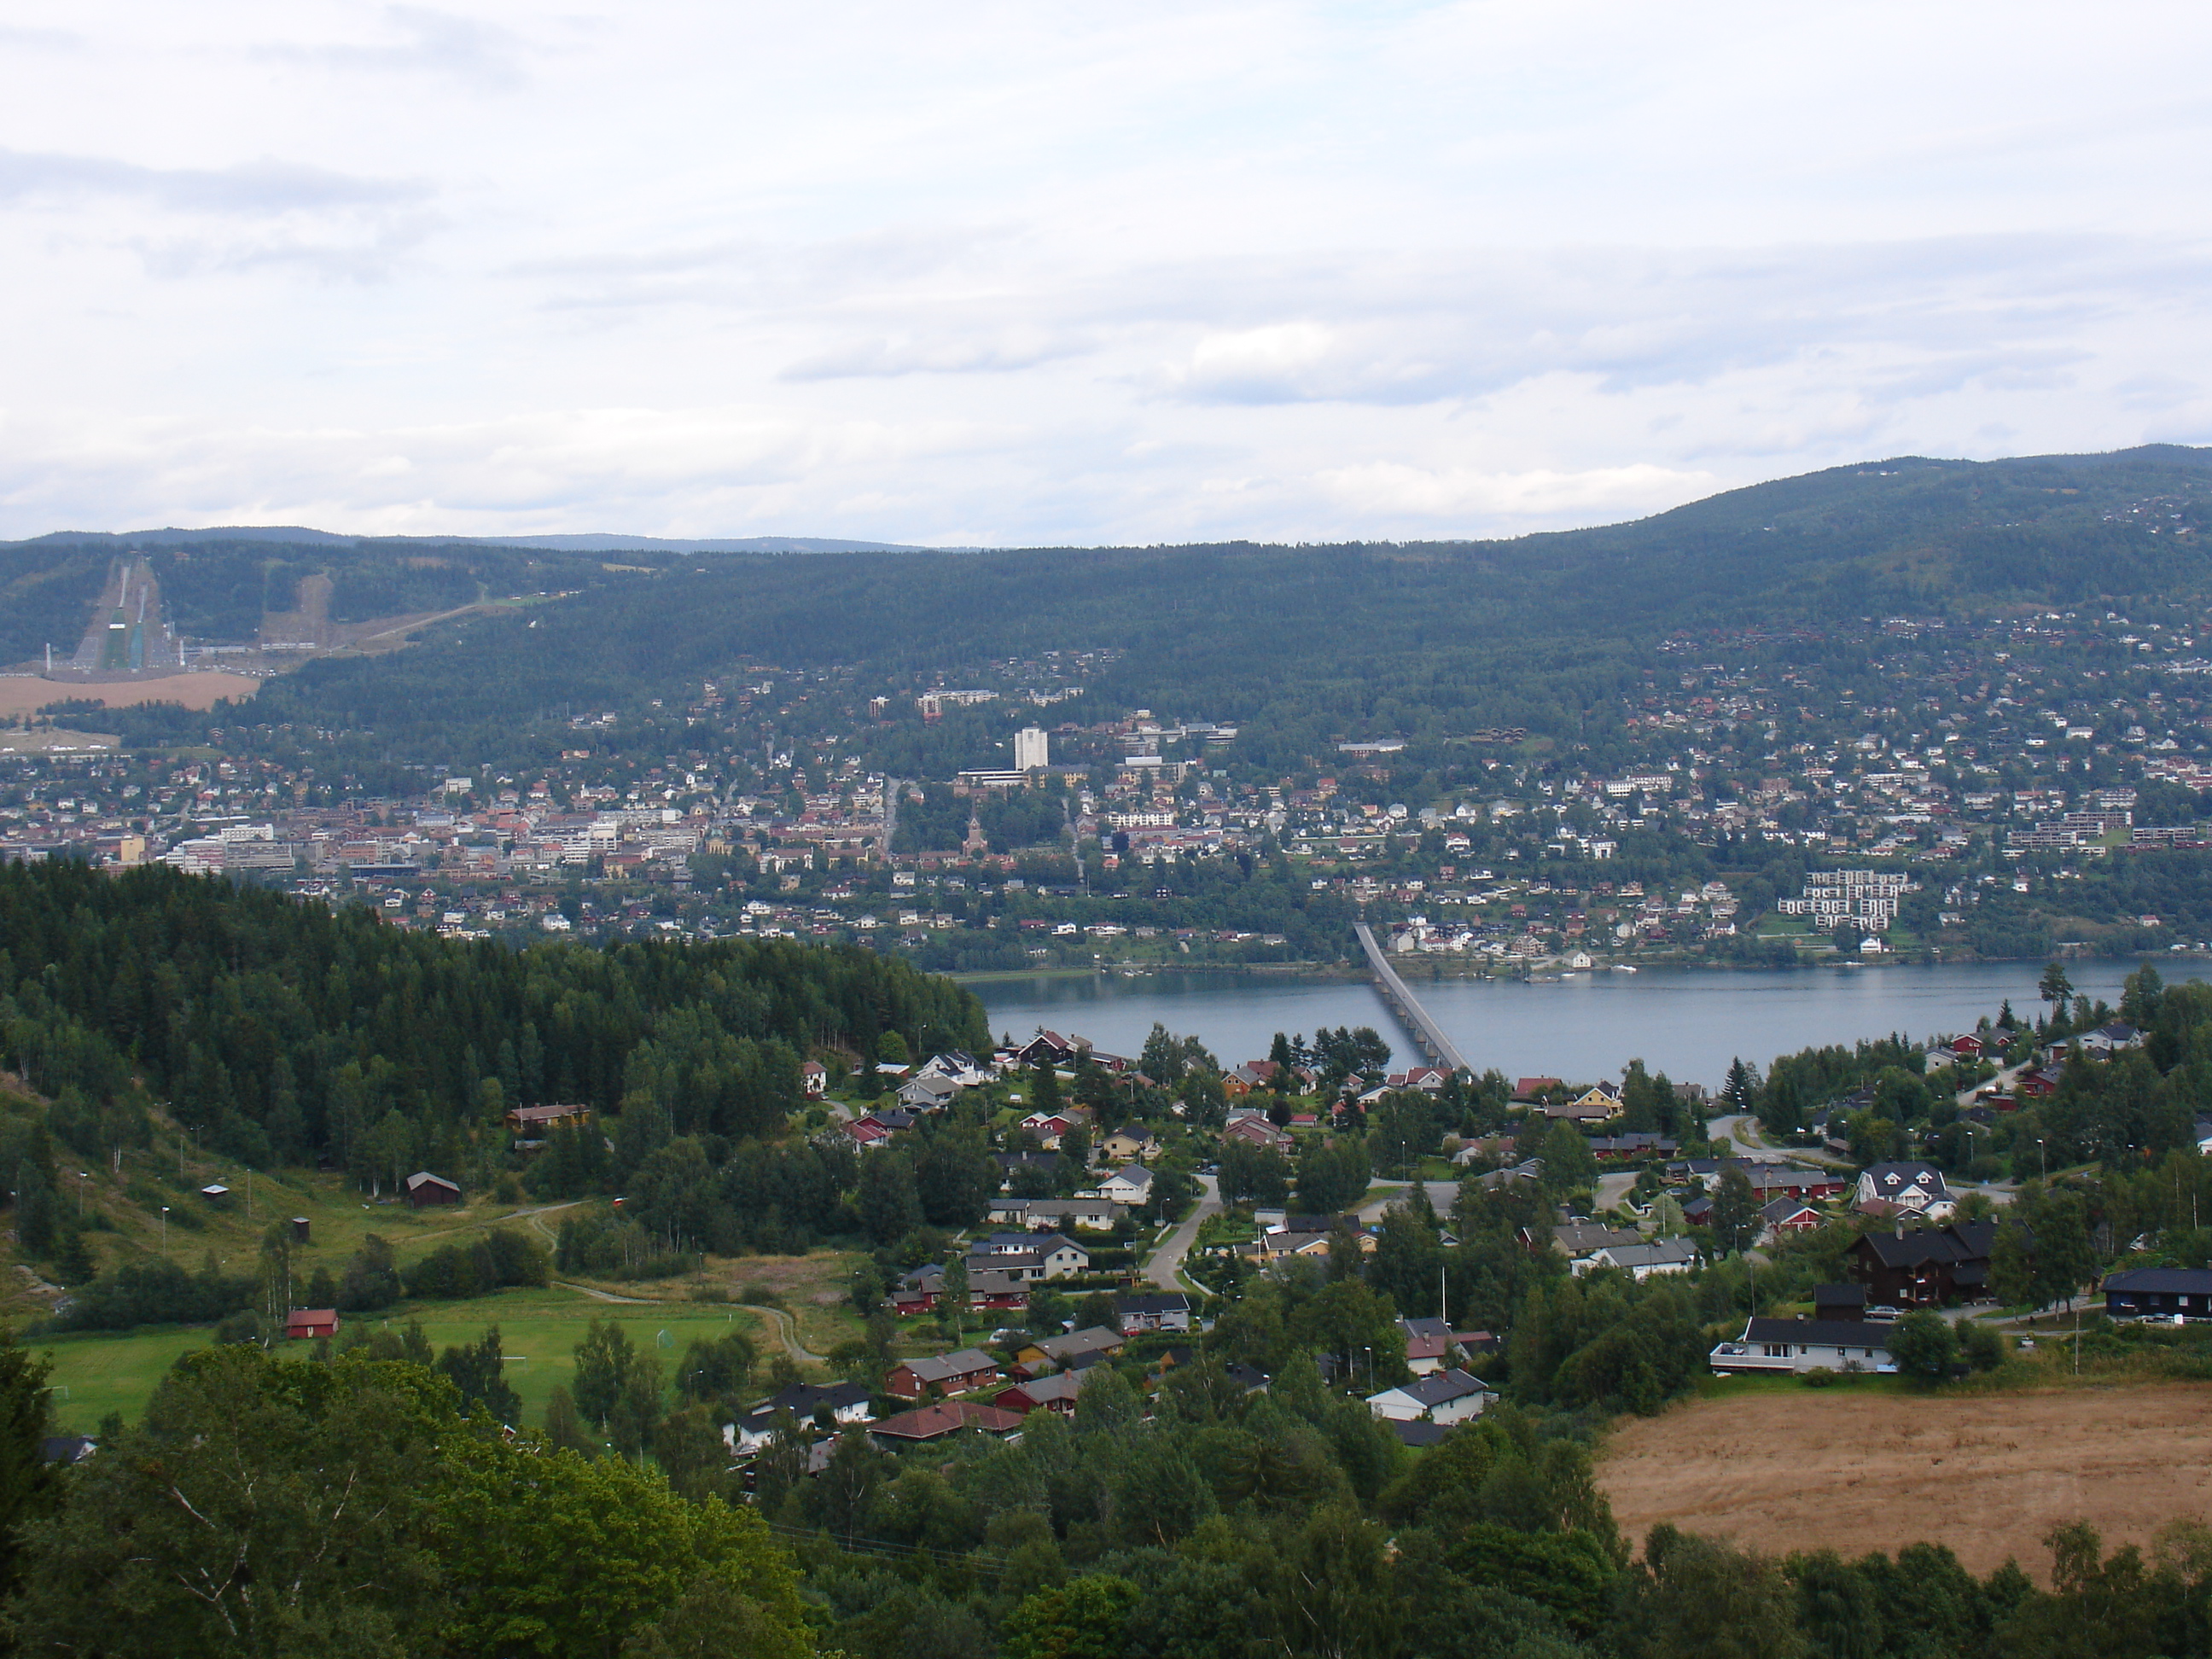
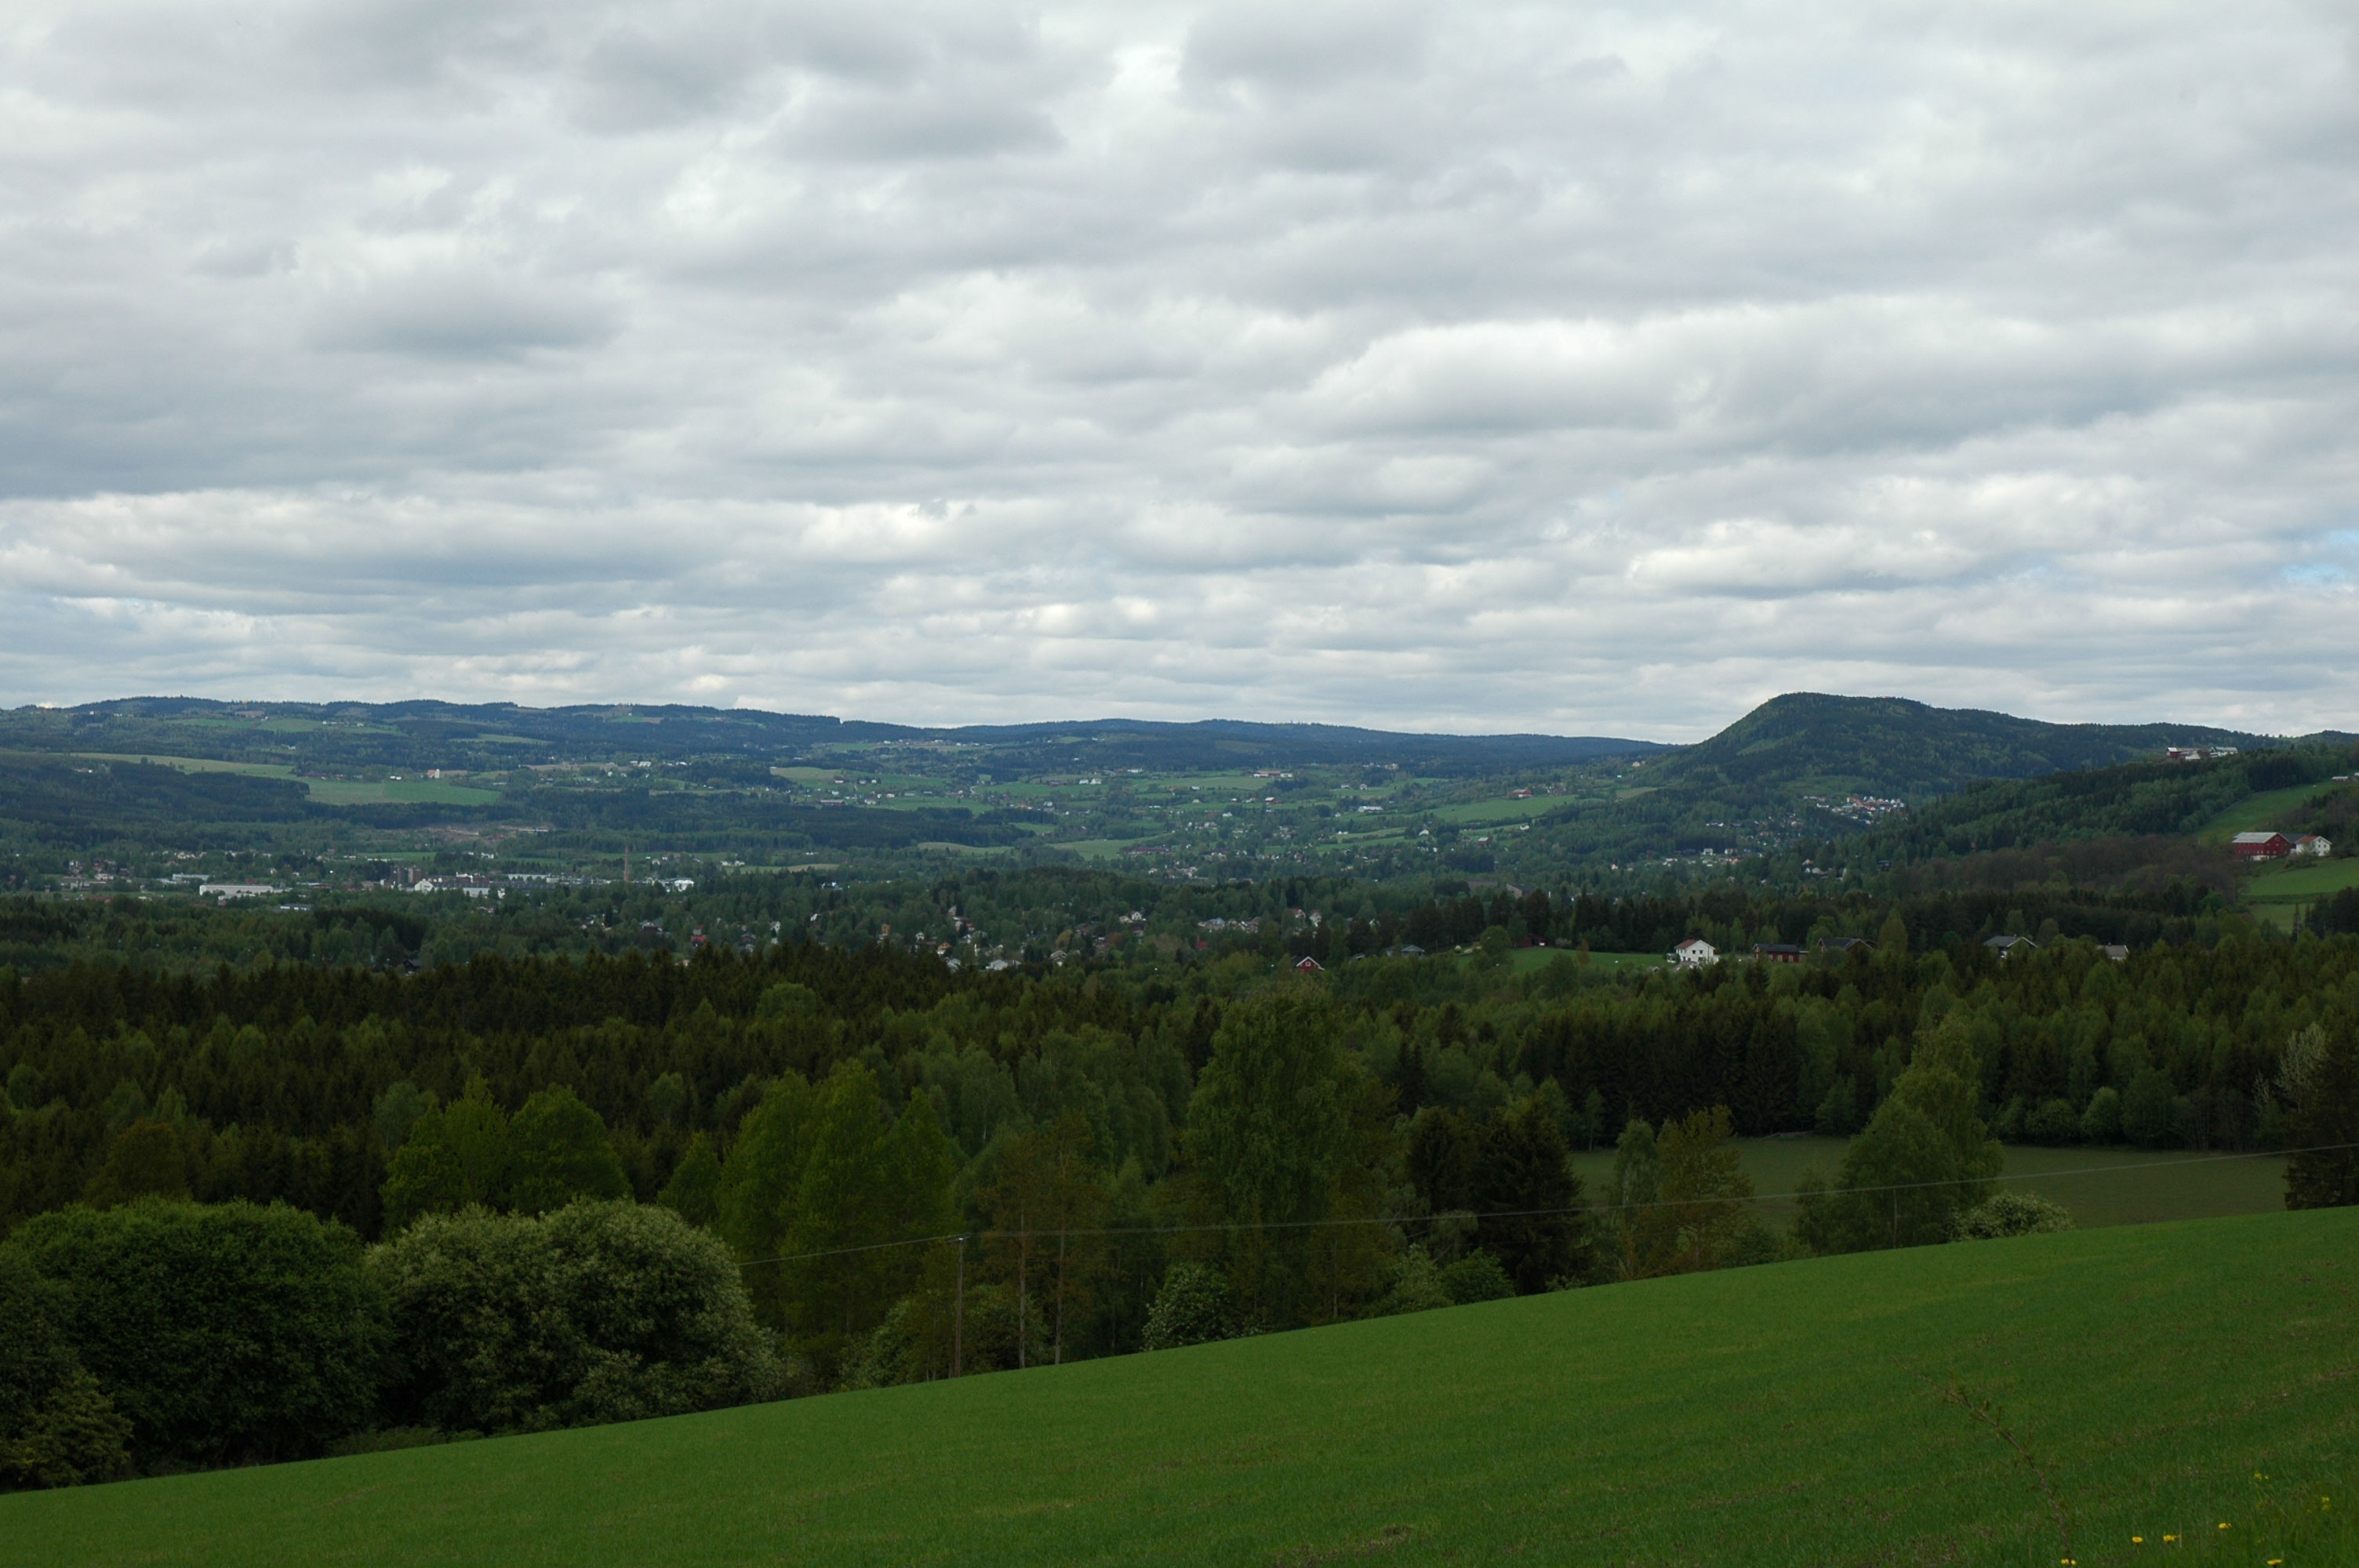
Fåberg
Fåberg is a village and former municipality in Oppland county, Norway. parish of Faaberg was established as a municipality January 1, 1838 (see formannskapsdistrikt). On January 1, 1964 Fåberg was incorporated into the neighboring municipality Lille..
Fåberg Wikipedia Page

About Our Data
The data on this page is estimated using a number of publicly available tools and resources. It is provided without warranty, and could contain inaccuracies. Use at your own risk.