Hanestad Facts
| Area | 0.1 km² |
| Population | 5 |
| Population change (2000 to 2020) | +25.0% |
| Local Time | |
| Timezone | Central European Summer Time |
| Lat & Lng | 61.83796, 10.87985 |
| Postal Codes | 2478 |
Map of Hanestad
Interactive Map
Hanestad Population
Years 1975 to 2020
| Data | 1975 | 1990 | 2000 | 2015 | 2020 |
|---|---|---|---|---|---|
| Population | 0 | 5 | 4 | 4 | 5 |
| Population Density | 0 / km² | 40 / km² | 32 / km² | 32 / km² | 40 / km² |
Sources: JRC (European Commission's Joint Research Centre) work on the GHS built-up grid
Hanestad Population change from 2000 to 2015
Increase of 0% from year 2000 to 2015
| Location | Change since 1975 | Change since 1990 | Change since 2000 |
|---|---|---|---|
| Hanestad | — | -20% | +0% |
| Hedmark | -0.5% | +3.1% | +4.2% |
| Norway | +30.2% | +23.2% | +16.4% |
Sources: JRC (European Commission's Joint Research Centre) work on the GHS built-up grid
Hanestad Population Density
Population Density: 40 / km²
| Location | Population | Area | Density |
|---|---|---|---|
| Hanestad | 5 | 0.125 km² | 40 / km² |
| Hedmark | 196,387 | 27,409.6 km² | 7.2 / km² |
| Norway | 4.9 million | 322,754.2 km² | 15.2 / km² |
Sources: JRC (European Commission's Joint Research Centre) work on the GHS built-up grid
Hanestad Historical and Projected Population
Estimated Population from 1975 to 2100
Sources:
- JRC (European Commission's Joint Research Centre) work on the GHS built-up grid
- CIESIN (Center for International Earth Science Information Network)
- [Link] Klein Goldewijk, K., Beusen, A., Doelman, J., and Stehfest, E.: Anthropogenic land use estimates for the Holocene – HYDE 3.2, Earth Syst. Sci. Data, 9, 927–953, https://doi.org/10.5194/essd-9-927-2017, 2017.
Human Development Index (HDI)
Statistic composite index of life expectancy, education, and per capita income.
Source: [Link] Kummu, M., Taka, M. &Guillaume, J. Gridded global datasets for Gross Domestic Product and Human Development Index over 1990–2015. Sci Data 5, 180004 (2018) doi:10.1038/sdata.2018.4
Hanestad CO2 Emissions
Carbon Dioxide (CO2) Emissions Per Capita in Tonnes Per Year
| Location | CO2 Emissions | CO2 Emissions Per Capita | CO2 Emissions Intensity |
|---|---|---|---|
| Hanestad | 90 tn | 18.05 tn | 721.9 tons/km² |
| Hedmark | 3,538,521 tn | 18.02 tn | 129.1 tons/km² |
| Norway | 86,855,170 tn | 17.74 tn | 269.1 tons/km² |
Sources: [Link] Moran, D., Kanemoto K; Jiborn, M., Wood, R., Többen, J., and Seto, K.C. (2018) Carbon footprints of 13,000 cities. Environmental Research Letters DOI: 10.1088/1748-9326/aac72a
Hanestad CO2 Emissions
| 2013 CO2 emissions (tonnes/year) | 90 tn |
| 2013 CO2 emissions (tonnes/year) per capita | 18.05 tn |
| 2013 CO2 emissions intensity (tonnes/km²/year) | 721.9 tons/km² |
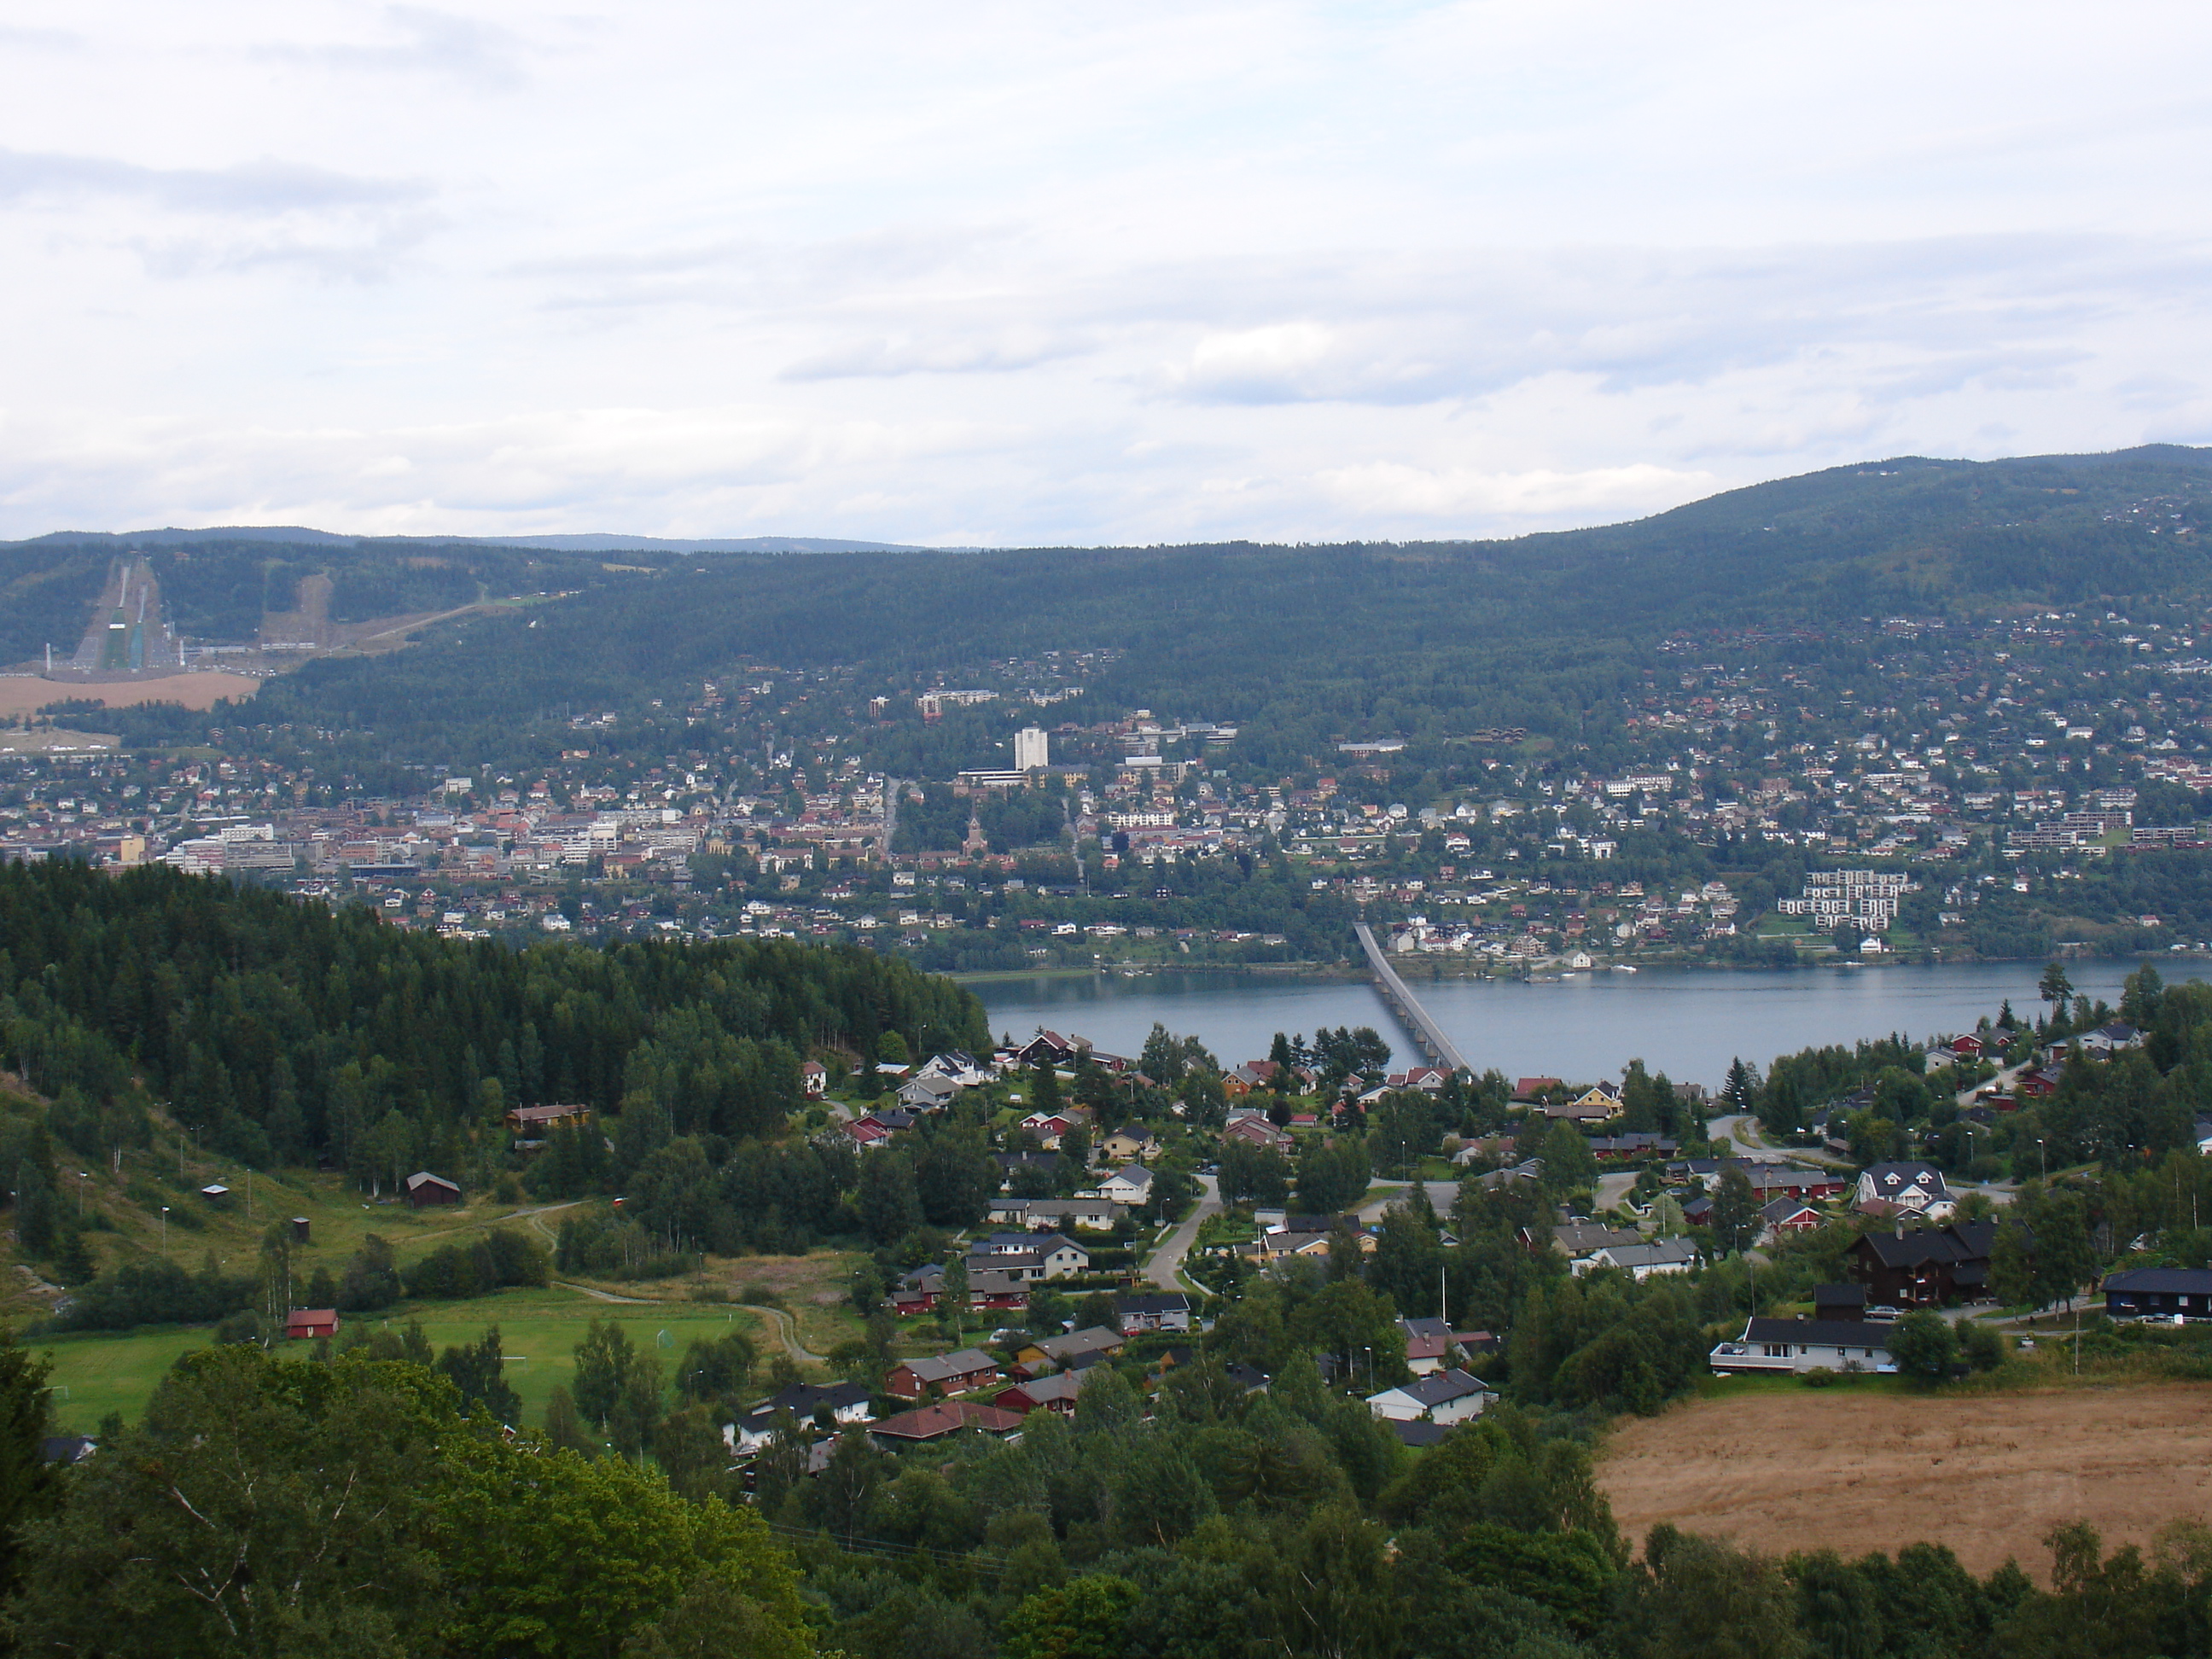
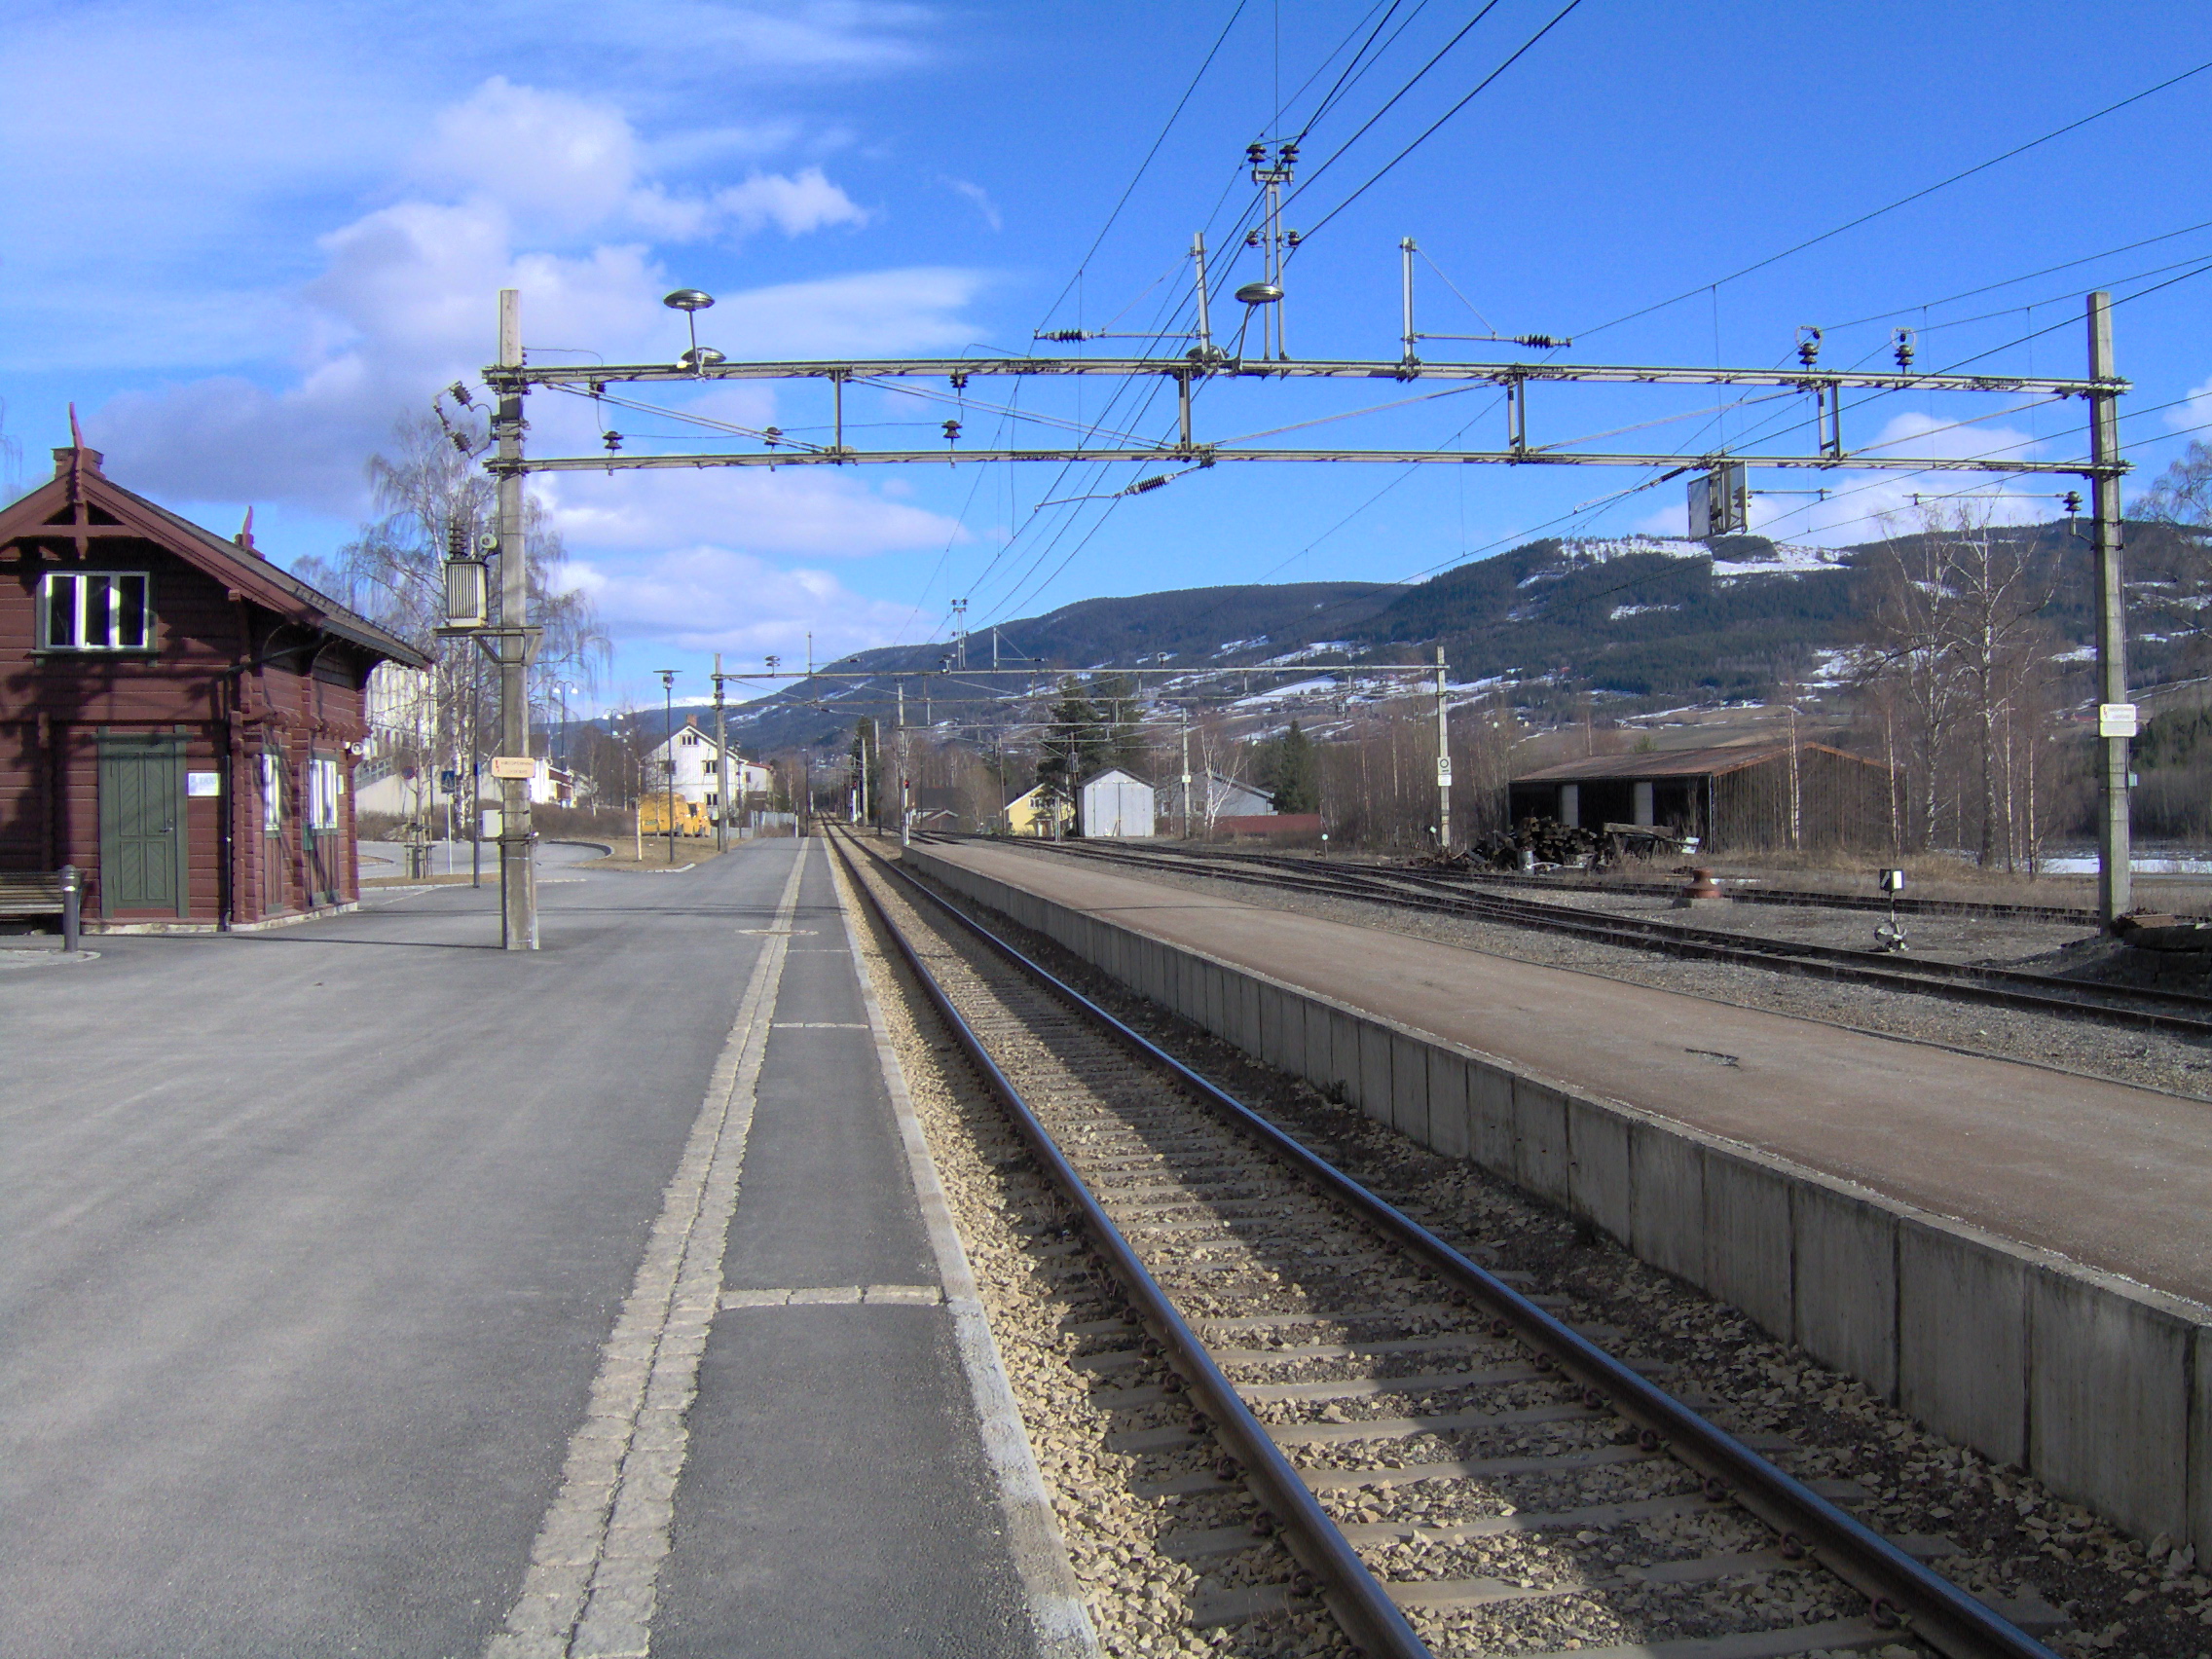
Hanestad
Hanestad is a village in the municipality of Rendalen, Norway. It is situated in Østerdalen approximately 266 kilometres from Oslo, and has the only railroad station in Rendalen. It has 61 inhabitants (2010)[1]. Hanestad there is a train station (No..
Hanestad Wikipedia Page

About Our Data
The data on this page is estimated using a number of publicly available tools and resources. It is provided without warranty, and could contain inaccuracies. Use at your own risk.