Map of Heiås
Interactive Map
Heiås Population
Years 1975 to 2020
| Data | 1975 | 1990 | 2000 | 2015 | 2020 |
|---|---|---|---|---|---|
| Population | 209 | 214 | 182 | 163 | 170 |
| Population Density | 196.7 / km² | 201.4 / km² | 171.3 / km² | 153.4 / km² | 160 / km² |
Sources: JRC (European Commission's Joint Research Centre) work on the GHS built-up grid
Heiås Population change from 2000 to 2015
Decrease of 10.4% from year 2000 to 2015
| Location | Change since 1975 | Change since 1990 | Change since 2000 |
|---|---|---|---|
| Heiås | -22% | -23.8% | -10.4% |
| Østfold | +34.2% | +23.8% | +15.9% |
| Norway | +30.2% | +23.2% | +16.4% |
Sources: JRC (European Commission's Joint Research Centre) work on the GHS built-up grid
Heiås Population Density
Population Density: 160 / km²
| Location | Population | Area | Density |
|---|---|---|---|
| Heiås | 170 | 1.063 km² | 160 / km² |
| Østfold | 290,600 | 5,068.4 km² | 57.3 / km² |
| Norway | 4.9 million | 322,754.2 km² | 15.2 / km² |
Sources: JRC (European Commission's Joint Research Centre) work on the GHS built-up grid
Heiås Historical and Projected Population
Estimated Population from 0 to 2100
Sources:
- JRC (European Commission's Joint Research Centre) work on the GHS built-up grid
- CIESIN (Center for International Earth Science Information Network)
- [Link] Klein Goldewijk, K., Beusen, A., Doelman, J., and Stehfest, E.: Anthropogenic land use estimates for the Holocene – HYDE 3.2, Earth Syst. Sci. Data, 9, 927–953, https://doi.org/10.5194/essd-9-927-2017, 2017.
Human Development Index (HDI)
Statistic composite index of life expectancy, education, and per capita income.
Source: [Link] Kummu, M., Taka, M. &Guillaume, J. Gridded global datasets for Gross Domestic Product and Human Development Index over 1990–2015. Sci Data 5, 180004 (2018) doi:10.1038/sdata.2018.4
Heiås CO2 Emissions
Carbon Dioxide (CO2) Emissions Per Capita in Tonnes Per Year
| Location | CO2 Emissions | CO2 Emissions Per Capita | CO2 Emissions Intensity |
|---|---|---|---|
| Heiås | 3,089 tn | 18.17 tn | 2,907.2 tons/km² |
| Østfold | 4,265,336 tn | 14.68 tn | 841.5 tons/km² |
| Norway | 86,855,170 tn | 17.74 tn | 269.1 tons/km² |
Sources: [Link] Moran, D., Kanemoto K; Jiborn, M., Wood, R., Többen, J., and Seto, K.C. (2018) Carbon footprints of 13,000 cities. Environmental Research Letters DOI: 10.1088/1748-9326/aac72a
Heiås CO2 Emissions
| 2013 CO2 emissions (tonnes/year) | 3,089 tn |
| 2013 CO2 emissions (tonnes/year) per capita | 18.17 tn |
| 2013 CO2 emissions intensity (tonnes/km²/year) | 2,907.2 tons/km² |
Recent Nearby Earthquakes
Magnitude 3.0 and greater
| Date▼ | Time↕ | Magnitude↕ | Distance↕ | Depth↕ | Location↕ | Link |
|---|---|---|---|---|---|---|
| 4/7/04 | 8:53 AM | 3.4 | 89.7 km | 22,900 m | southern Norway | usgs.gov |
| 11/29/00 | 10:07 PM | 3.4 | 84.3 km | 10,000 m | Sweden | usgs.gov |
| 11/19/94 | 9:07 AM | 3.5 | 49.9 km | 10,000 m | southern Norway | usgs.gov |
| 11/27/93 | 6:57 PM | 3.1 | 75.2 km | 10,000 m | southern Norway | usgs.gov |
| 11/12/93 | 7:54 PM | 3.4 | 61.8 km | 10,000 m | Sweden | usgs.gov |
| 2/19/92 | 6:39 AM | 3.8 | 59.4 km | 10,000 m | southern Norway | usgs.gov |
Source: U.S. Geological Survey (USGS)
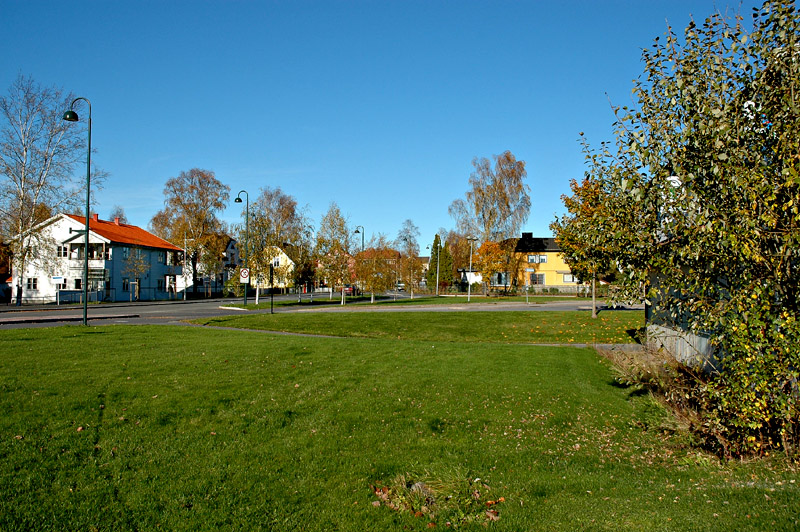
Heiås
Heiås is a village in the municipality of Trøgstad, Norway. Its population (SSB 2005) is 654.
Heiås Wikipedia Page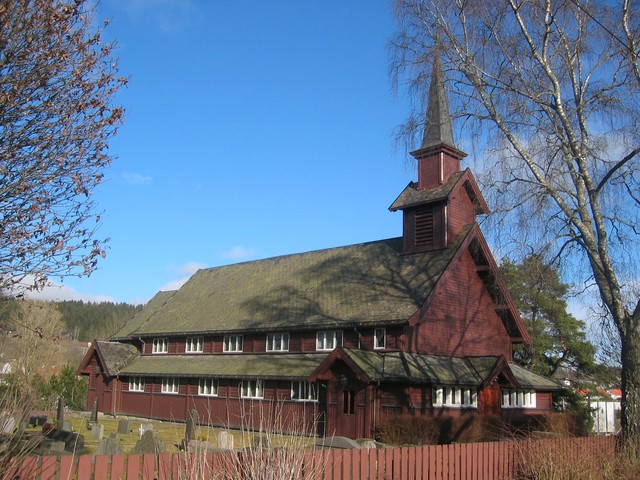
About Our Data
The data on this page is estimated using a number of publicly available tools and resources. It is provided without warranty, and could contain inaccuracies. Use at your own risk.