Categories in Kylstad
Car repairGas stationNew car dealersWholesale of construction suppliesWholesale of machineryWholesalersOther membership organizationsElectronics storesConstruction of buildingsGeneral contractorsHardware storeKitchen and bath cabinets and remodelOther constructionTechnical construction servicesEducationSpecialized designStadiums and arenasAll food and beverageBakeriesFurniture storesHousehold appliances and goodsLandscapingBeauty salonsShoppingShopping otherSports clubsBuses and trainsOther accommodationOther transport activitiesTransportation logisticsUnreachable
Kylstad Facts
| Area | 1.0 km² |
| Population | 164 |
| Population change (1975 to 2020) | +17.1% |
| Population change (2000 to 2020) | +28.1% |
| Local Time | |
| Timezone | Central European Summer Time |
| Lat & Lng | 60.86667, 11.05000 |
| Postal Codes | 2320 |
Map of Kylstad
Interactive Map
Kylstad Population
Years 1975 to 2020
| Data | 1975 | 1990 | 2000 | 2015 | 2020 |
|---|---|---|---|---|---|
| Population | 140 | 124 | 128 | 155 | 164 |
| Population Density | 140 / km² | 124 / km² | 128 / km² | 155 / km² | 164 / km² |
Sources: JRC (European Commission's Joint Research Centre) work on the GHS built-up grid
Kylstad Population change from 2000 to 2015
Increase of 21.1% from year 2000 to 2015
| Location | Change since 1975 | Change since 1990 | Change since 2000 |
|---|---|---|---|
| Kylstad | +10.7% | +25% | +21.1% |
| Hedmark | -0.5% | +3.1% | +4.2% |
| Norway | +30.2% | +23.2% | +16.4% |
Sources: JRC (European Commission's Joint Research Centre) work on the GHS built-up grid
Kylstad Population Density
Population Density: 164 / km²
| Location | Population | Area | Density |
|---|---|---|---|
| Kylstad | 164 | 1 km² | 164 / km² |
| Hedmark | 196,387 | 27,409.6 km² | 7.2 / km² |
| Norway | 4.9 million | 322,754.2 km² | 15.2 / km² |
Sources: JRC (European Commission's Joint Research Centre) work on the GHS built-up grid
Kylstad Historical and Projected Population
Estimated Population from 1100 to 2100
Sources:
- JRC (European Commission's Joint Research Centre) work on the GHS built-up grid
- CIESIN (Center for International Earth Science Information Network)
- [Link] Klein Goldewijk, K., Beusen, A., Doelman, J., and Stehfest, E.: Anthropogenic land use estimates for the Holocene – HYDE 3.2, Earth Syst. Sci. Data, 9, 927–953, https://doi.org/10.5194/essd-9-927-2017, 2017.
Human Development Index (HDI)
Statistic composite index of life expectancy, education, and per capita income.
Source: [Link] Kummu, M., Taka, M. &Guillaume, J. Gridded global datasets for Gross Domestic Product and Human Development Index over 1990–2015. Sci Data 5, 180004 (2018) doi:10.1038/sdata.2018.4
Kylstad CO2 Emissions
Carbon Dioxide (CO2) Emissions Per Capita in Tonnes Per Year
| Location | CO2 Emissions | CO2 Emissions Per Capita | CO2 Emissions Intensity |
|---|---|---|---|
| Kylstad | 2,960 tn | 18.05 tn | 2,959.9 tons/km² |
| Hedmark | 3,538,521 tn | 18.02 tn | 129.1 tons/km² |
| Norway | 86,855,170 tn | 17.74 tn | 269.1 tons/km² |
Sources: [Link] Moran, D., Kanemoto K; Jiborn, M., Wood, R., Többen, J., and Seto, K.C. (2018) Carbon footprints of 13,000 cities. Environmental Research Letters DOI: 10.1088/1748-9326/aac72a
Kylstad CO2 Emissions
| 2013 CO2 emissions (tonnes/year) | 2,960 tn |
| 2013 CO2 emissions (tonnes/year) per capita | 18.05 tn |
| 2013 CO2 emissions intensity (tonnes/km²/year) | 2,959.9 tons/km² |
Recent Nearby Earthquakes
Magnitude 3.0 and greater
| Date▼ | Time↕ | Magnitude↕ | Distance↕ | Depth↕ | Location↕ | Link |
|---|---|---|---|---|---|---|
| 4/7/04 | 8:53 AM | 3.4 | 48 km | 22,900 m | southern Norway | usgs.gov |
| 11/19/94 | 9:07 AM | 3.5 | 80.9 km | 10,000 m | southern Norway | usgs.gov |
| 11/27/93 | 6:57 PM | 3.1 | 60.1 km | 10,000 m | southern Norway | usgs.gov |
Source: U.S. Geological Survey (USGS)
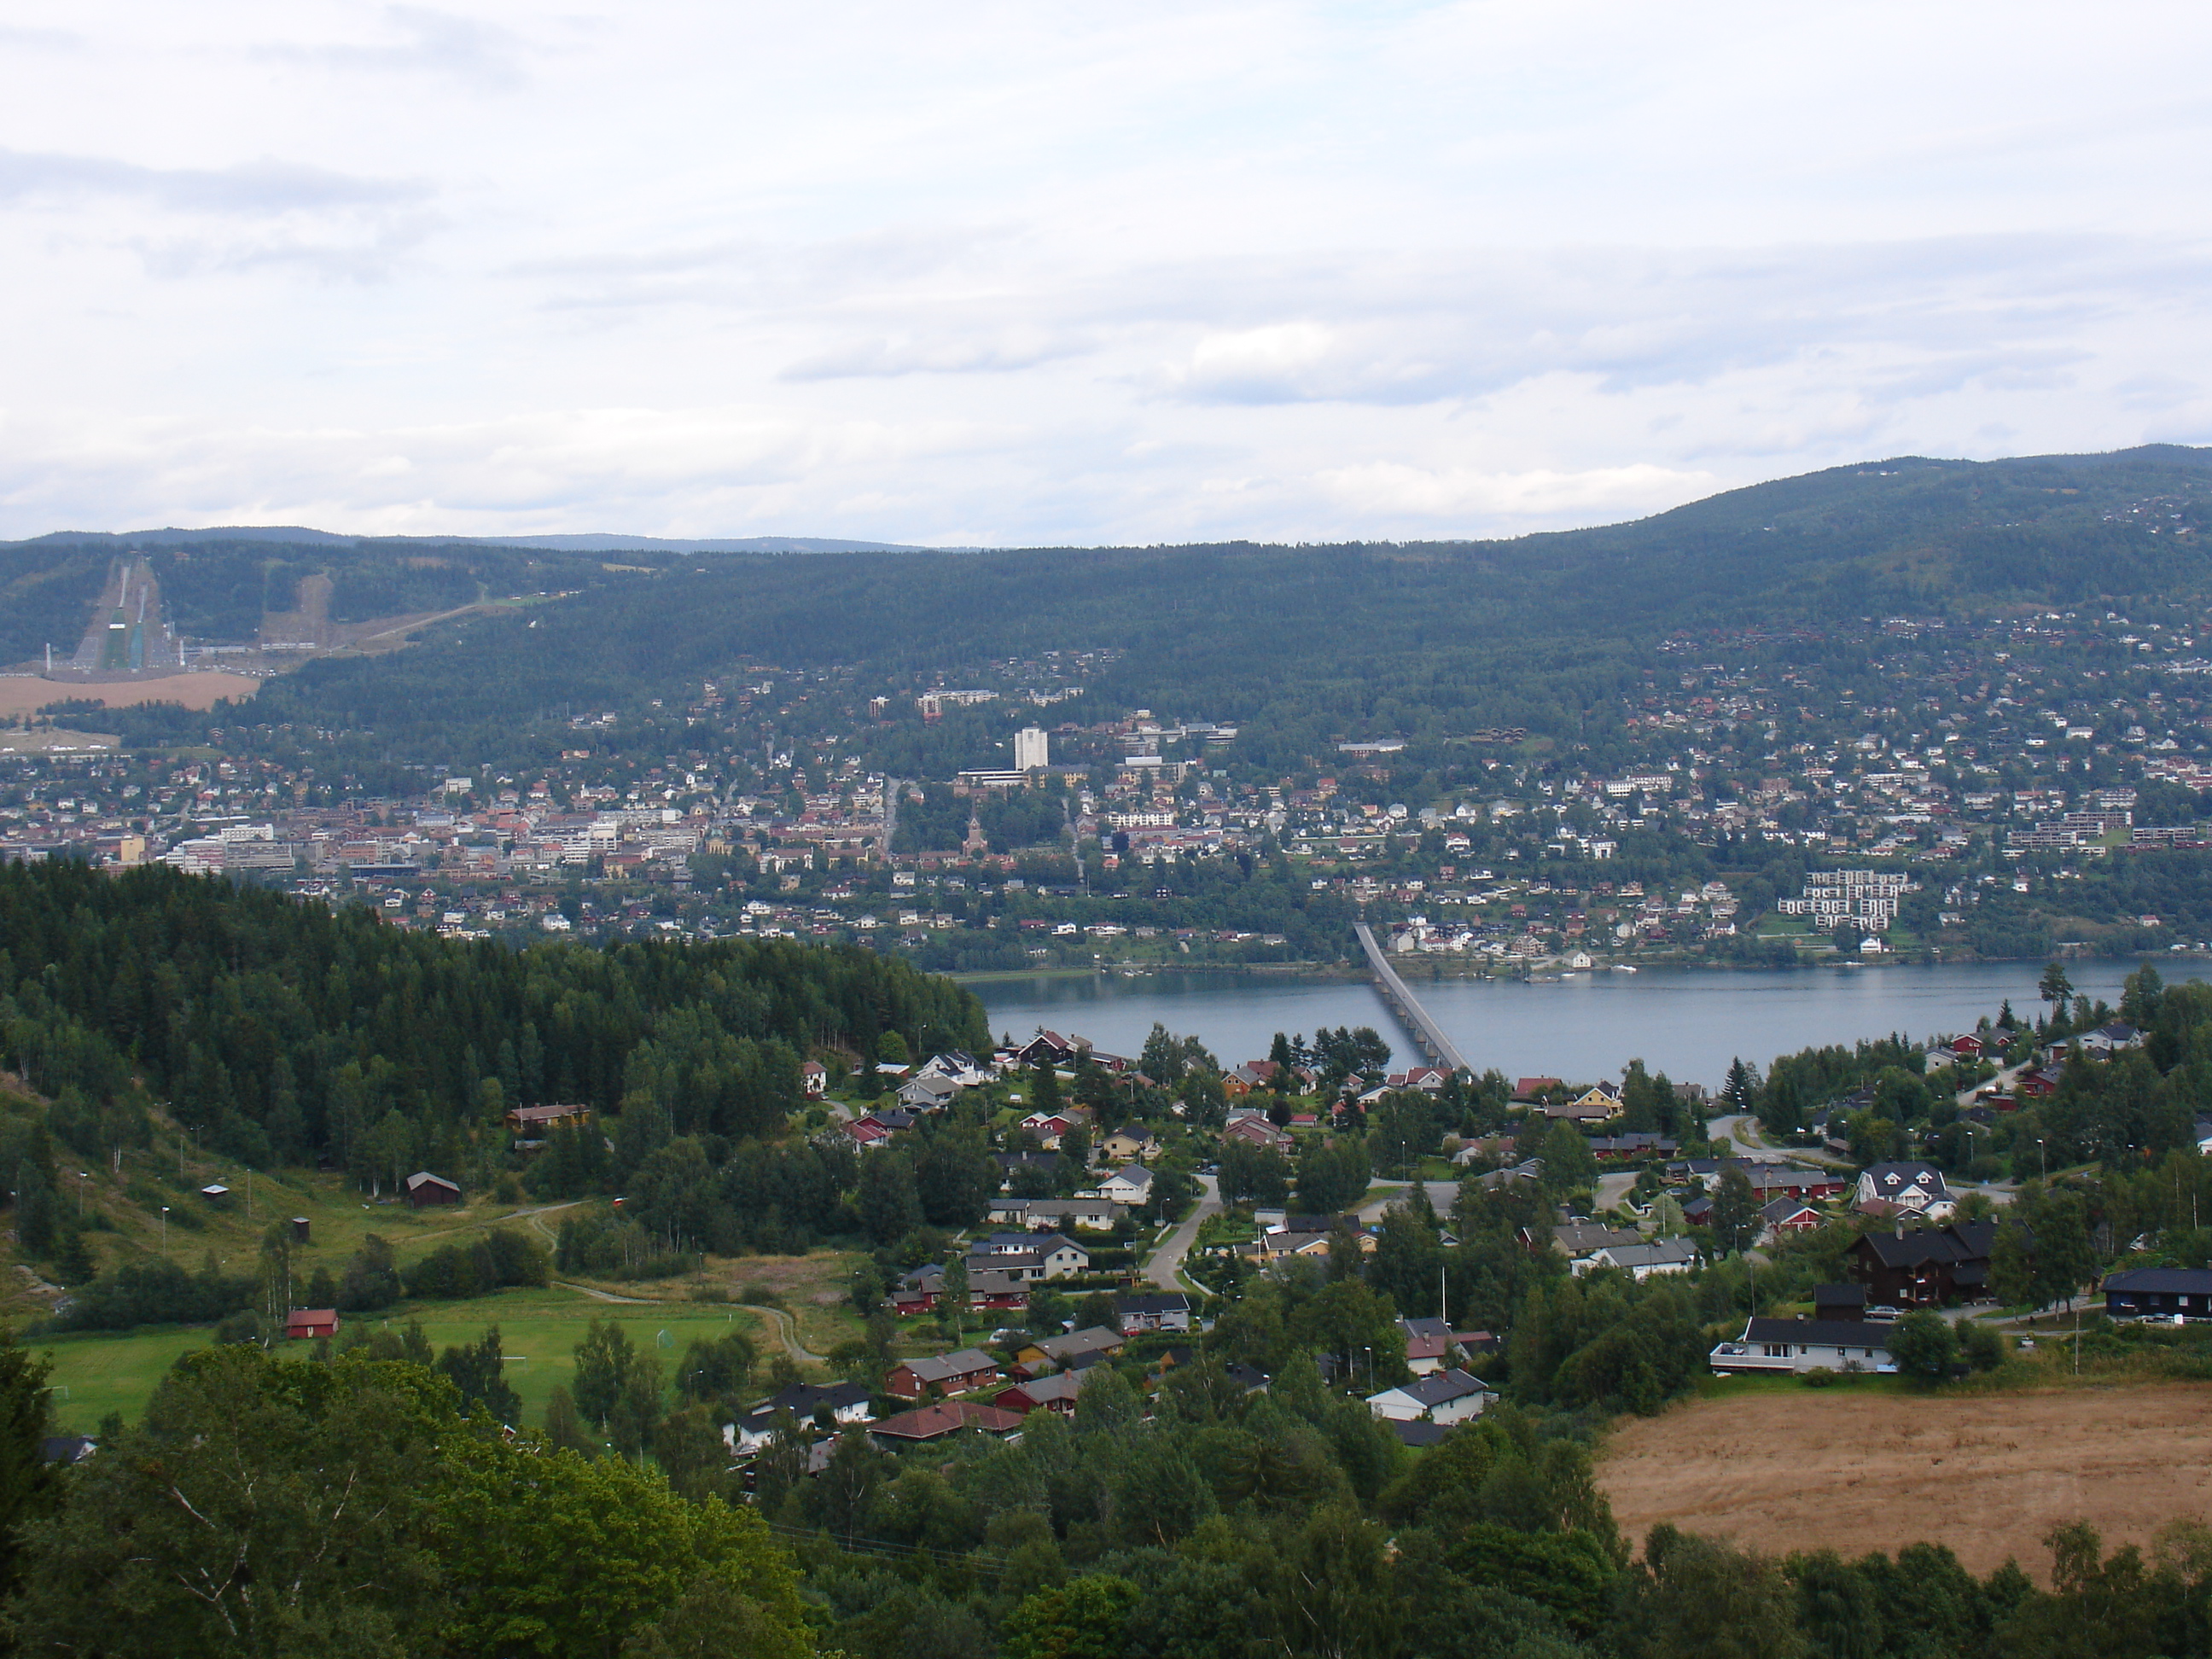
Kylstad
Kylstad is a village in Ringsaker municipality, Norway, 6 kilometres (4 mi) east of the urban area Brumunddal. Its population is 318.
Kylstad Wikipedia Page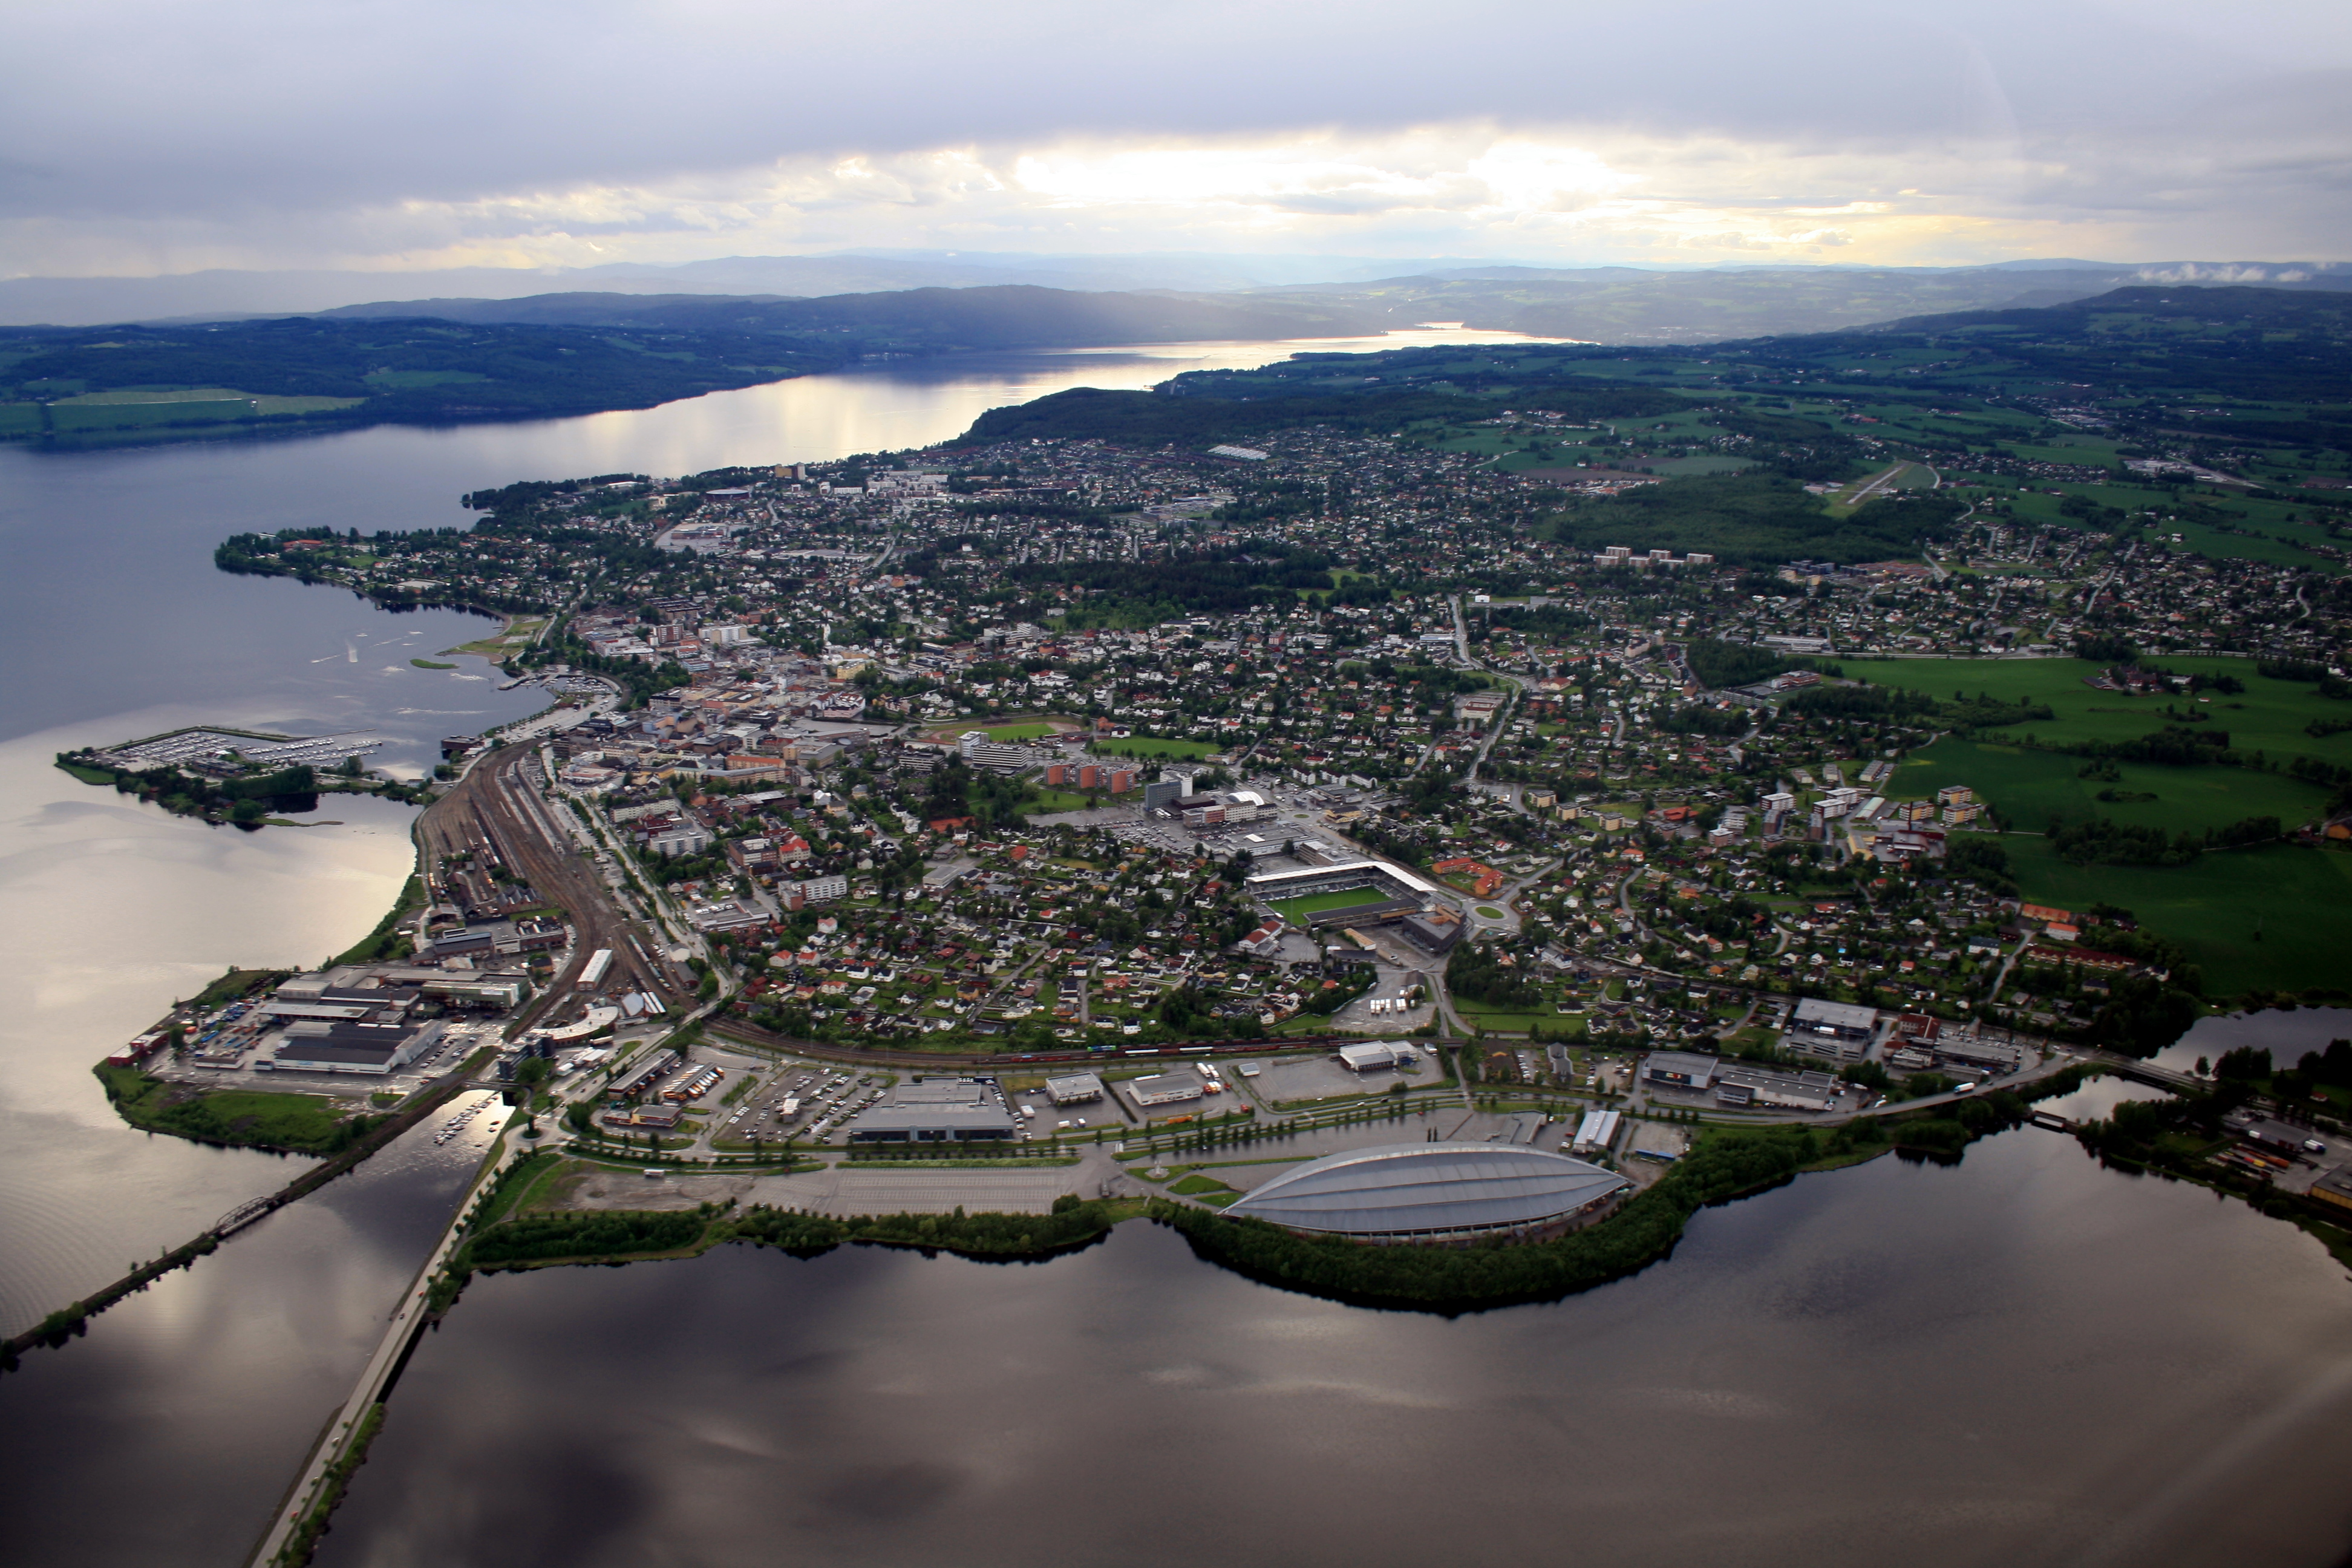

About Our Data
The data on this page is estimated using a number of publicly available tools and resources. It is provided without warranty, and could contain inaccuracies. Use at your own risk.