Industries
Business Distribution by Industry in Lundamo
| Industry Description | Number of Establishments |
|---|---|
| Unreachable | 49 |
| Construction of buildings | 12 |
| Wholesalers | 7 |
| Other construction | 6 |
| Campgrounds | 5 |
| Other accommodation | 5 |
Map of Lundamo
Interactive Map
Lundamo Population
Years 1975 to 2020
| Data | 1975 | 1990 | 2000 | 2015 | 2020 |
|---|---|---|---|---|---|
| Population | 598 | 632 | 635 | 640 | 683 |
| Population Density | 416 / km² | 439.7 / km² | 441.7 / km² | 445.2 / km² | 475.1 / km² |
Lundamo Population change from 2000 to 2015
Increase of 0.8% from year 2000 to 2015
| Location | Change since 1975 | Change since 1990 | Change since 2000 |
|---|---|---|---|
| Lundamo | +7% | +1.3% | +0.8% |
| Sør-Trøndelag | +39.5% | +27.8% | +18.6% |
| Norway | +30.2% | +23.2% | +16.4% |
Lundamo Population Density
Population Density: 475 / km²
| Location | Population | Area | Density |
|---|---|---|---|
| Lundamo | 683 | 1.438 km² | 475 / km² |
| Sør-Trøndelag | 310,476 | 28,974.9 km² | 10.7 / km² |
| Norway | 4.9 million | 322,754.2 km² | 15.2 / km² |
Lundamo Historical and Projected Population
Estimated Population from 400 to 2100
- JRC (European Commission's Joint Research Centre) work on the GHS built-up grid
- CIESIN (Center for International Earth Science Information Network)
- [Link] Klein Goldewijk, K., Beusen, A., Doelman, J., and Stehfest, E.: Anthropogenic land use estimates for the Holocene – HYDE 3.2, Earth Syst. Sci. Data, 9, 927–953, https://doi.org/10.5194/essd-9-927-2017, 2017.
Area Codes
Percentage Area Codes used by businesses in Lundamo
Human Development Index (HDI)
Statistic composite index of life expectancy, education, and per capita income.
Lundamo CO2 Emissions
Carbon Dioxide (CO2) Emissions Per Capita in Tonnes Per Year
| Location | CO2 Emissions | CO2 Emissions Per Capita | CO2 Emissions Intensity |
|---|---|---|---|
| Lundamo | 12,782 tn | 18.71 tn | 8,891.5 tons/km² |
| Sør-Trøndelag | 3,704,104 tn | 11.93 tn | 127.8 tons/km² |
| Norway | 86,855,170 tn | 17.74 tn | 269.1 tons/km² |
| 2013 CO2 emissions (tonnes/year) | 12,782 tn |
| 2013 CO2 emissions (tonnes/year) per capita | 18.71 tn |
| 2013 CO2 emissions intensity (tonnes/km²/year) | 8,891.5 tons/km² |
Natural Hazards Risk
Relative risk out of 10
| Hazard | Risk Level |
|---|---|
| Earthquake | Low (2) |
* Risk, particularly concerning flood or landslide, may not be for the entire area.
- Dilley, M., R.S. Chen, U. Deichmann, A.L. Lerner-Lam, M. Arnold, J. Agwe, P. Buys, O. Kjekstad, B. Lyon, and G. Yetman. 2005. Natural Disaster Hotspots: A Global Risk Analysis. Washington, D.C.: World Bank. https://doi.org/10.1596/0-8213-5930-4.
- Center for Hazards and Risk Research - CHRR - Columbia University, Center for International Earth Science Information Network - CIESIN - Columbia University. 2005. Global Earthquake Hazard Distribution - Peak Ground Acceleration. Palisades, NY: NASA Socioeconomic Data and Applications Center (SEDAC). https://doi.org/10.7927/H4BZ63ZS.
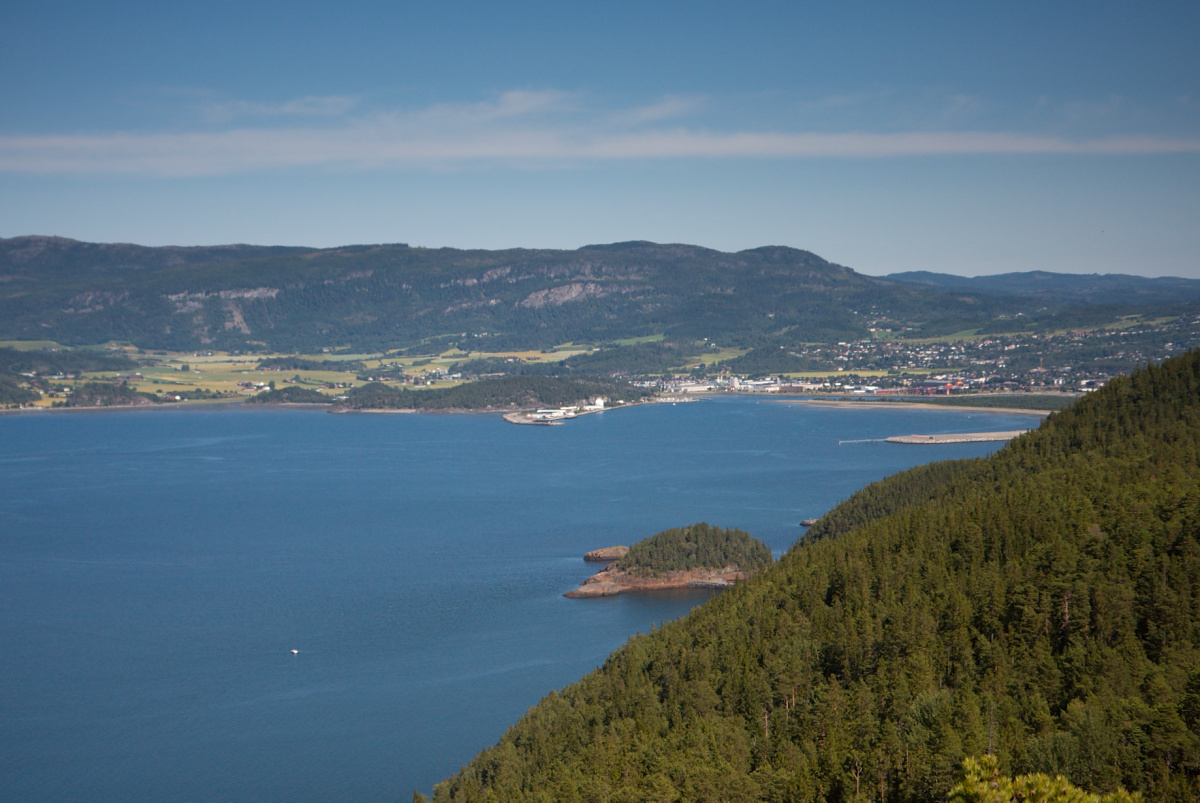
Lundamo
Lundamo is a village in the municipality of Melhus in Sør-Trøndelag county, Norway. It is located along the Gaula River between the villages of Hovin and Ler. The 0.77-square-kilometre (190-acre) village has a population (2013) of 1,079. The populati..
Lundamo Wikipedia Page

About Our Data
The data on this page is estimated using a number of publicly available tools and resources. It is provided without warranty, and could contain inaccuracies. Use at your own risk.