Industries
Business Distribution by Industry in Stemshaug
| Industry Description | Number of Establishments |
|---|---|
| Unreachable | 28 |
| Wholesalers | 5 |
Stemshaug Facts
| Area | 0.2 km² |
| Local Time | |
| Timezone | Central European Summer Time |
| Lat & Lng | 63.32668, 8.70542 |
| Postal Codes | 6697 |
Map of Stemshaug
Interactive Map
Stemshaug Population
Years 1975 to 2030
| Data | 1975 | 1990 | 2000 | 2015 | 2020 | 2025* | 2030* |
|---|---|---|---|---|---|---|---|
| Population | 0 | 0 | 0 | 0 | 0 | 0 | 0 |
| Population Density | 0 / km² | 0 / km² | 0 / km² | 0 / km² | 0 / km² | 0 / km² | 0 / km² |
Stemshaug Population change from 2000 to 2000
| Location | Change since 1975 | Change since 1990 |
|---|---|---|
| Stemshaug | — | — |
| Møre og Romsdal | +0.3% | +1.1% |
| Norway | +11.9% | +5.8% |
Møre og Romsdal Population Density
Population Density: 10 / km²
| Location | Population | Area | Density |
|---|---|---|---|
| Møre og Romsdal | 263,295 | 26,295.1 km² | 10 / km² |
| Norway | 4.9 million | 322,754.2 km² | 15.2 / km² |
Stemshaug Historical and Projected Population
Estimated Population from 1975 to 2030
- JRC (European Commission's Joint Research Centre) work on the GHS built-up grid
- CIESIN (Center for International Earth Science Information Network)
- [Link] Klein Goldewijk, K., Beusen, A., Doelman, J., and Stehfest, E.: Anthropogenic land use estimates for the Holocene – HYDE 3.2, Earth Syst. Sci. Data, 9, 927–953, https://doi.org/10.5194/essd-9-927-2017, 2017.
Human Development Index (HDI)
Statistic composite index of life expectancy, education, and per capita income.
Møre og Romsdal CO2 Emissions
Carbon Dioxide (CO2) Emissions Per Capita in Tonnes Per Year
| Location | CO2 Emissions | CO2 Emissions Per Capita | CO2 Emissions Intensity |
|---|---|---|---|
| Møre og Romsdal | 2,799,053 tn | 10.63 tn | 106.4 tons/km² |
| Norway | 86,855,170 tn | 17.74 tn | 269.1 tons/km² |
| 2013 CO2 emissions (tonnes/year) | 2,799,053 tn |
| 2013 CO2 emissions (tonnes/year) per capita | 10.63 tn |
| 2013 CO2 emissions intensity (tonnes/km²/year) | 106.4 tons/km² |
Natural Hazards Risk
Relative risk out of 10
| Hazard | Risk Level |
|---|---|
| Earthquake | Low (2) |
* Risk, particularly concerning flood or landslide, may not be for the entire area.
- Dilley, M., R.S. Chen, U. Deichmann, A.L. Lerner-Lam, M. Arnold, J. Agwe, P. Buys, O. Kjekstad, B. Lyon, and G. Yetman. 2005. Natural Disaster Hotspots: A Global Risk Analysis. Washington, D.C.: World Bank. https://doi.org/10.1596/0-8213-5930-4.
- Center for Hazards and Risk Research - CHRR - Columbia University, Center for International Earth Science Information Network - CIESIN - Columbia University. 2005. Global Earthquake Hazard Distribution - Peak Ground Acceleration. Palisades, NY: NASA Socioeconomic Data and Applications Center (SEDAC). https://doi.org/10.7927/H4BZ63ZS.
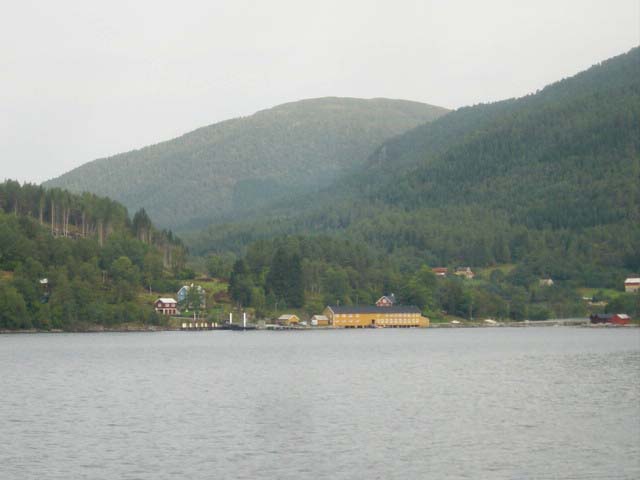
Stemshaug
Stemshaug is a village and former municipality in Møre og Romsdal county, Norway. The village is located on the mainland along the southern shore of the Torsetsundet in the present-day Aure Municipality. The former municipality encompassed the northe..
Stemshaug Wikipedia Page

About Our Data
The data on this page is estimated using a number of publicly available tools and resources. It is provided without warranty, and could contain inaccuracies. Use at your own risk.