Vegusdal Facts
| Area | 0.3 km² |
| Population | 12 |
| Population change (2000 to 2020) | +100.0% |
| Local Time | |
| Timezone | Central European Summer Time |
| Lat & Lng | 58.57863, 8.14725 |
Map of Vegusdal
Interactive Map
Vegusdal Population
Years 1975 to 2020
| Data | 1975 | 1990 | 2000 | 2015 | 2020 |
|---|---|---|---|---|---|
| Population | 0 | 2 | 6 | 12 | 12 |
| Population Density | 0 / km² | 8 / km² | 24 / km² | 48 / km² | 48 / km² |
Vegusdal Population change from 2000 to 2015
Increase of 100% from year 2000 to 2015
| Location | Change since 1975 | Change since 1990 | Change since 2000 |
|---|---|---|---|
| Vegusdal | — | +500% | +100% |
| Aust-Agder | +21.5% | +16.9% | +12.3% |
| Norway | +30.2% | +23.2% | +16.4% |
Vegusdal Population Density
Population Density: 48 / km²
| Location | Population | Area | Density |
|---|---|---|---|
| Vegusdal | 12 | 0.25 km² | 48 / km² |
| Aust-Agder | 115,401 | 11,888.6 km² | 9.7 / km² |
| Norway | 4.9 million | 322,754.2 km² | 15.2 / km² |
Vegusdal Historical and Projected Population
Estimated Population from 1975 to 2100
- JRC (European Commission's Joint Research Centre) work on the GHS built-up grid
- CIESIN (Center for International Earth Science Information Network)
- [Link] Klein Goldewijk, K., Beusen, A., Doelman, J., and Stehfest, E.: Anthropogenic land use estimates for the Holocene – HYDE 3.2, Earth Syst. Sci. Data, 9, 927–953, https://doi.org/10.5194/essd-9-927-2017, 2017.
Human Development Index (HDI)
Statistic composite index of life expectancy, education, and per capita income.
Vegusdal CO2 Emissions
Carbon Dioxide (CO2) Emissions Per Capita in Tonnes Per Year
| Location | CO2 Emissions | CO2 Emissions Per Capita | CO2 Emissions Intensity |
|---|---|---|---|
| Vegusdal | 220 tn | 18.35 tn | 880.6 tons/km² |
| Aust-Agder | 1,624,923 tn | 14.08 tn | 136.7 tons/km² |
| Norway | 86,855,170 tn | 17.74 tn | 269.1 tons/km² |
| 2013 CO2 emissions (tonnes/year) | 220 tn |
| 2013 CO2 emissions (tonnes/year) per capita | 18.35 tn |
| 2013 CO2 emissions intensity (tonnes/km²/year) | 880.6 tons/km² |
Natural Hazards Risk
Relative risk out of 10
| Hazard | Risk Level |
|---|---|
| Earthquake | Low (2) |
* Risk, particularly concerning flood or landslide, may not be for the entire area.
- Dilley, M., R.S. Chen, U. Deichmann, A.L. Lerner-Lam, M. Arnold, J. Agwe, P. Buys, O. Kjekstad, B. Lyon, and G. Yetman. 2005. Natural Disaster Hotspots: A Global Risk Analysis. Washington, D.C.: World Bank. https://doi.org/10.1596/0-8213-5930-4.
- Center for Hazards and Risk Research - CHRR - Columbia University, Center for International Earth Science Information Network - CIESIN - Columbia University. 2005. Global Earthquake Hazard Distribution - Peak Ground Acceleration. Palisades, NY: NASA Socioeconomic Data and Applications Center (SEDAC). https://doi.org/10.7927/H4BZ63ZS.
Recent Nearby Earthquakes
Magnitude 3.0 and greater
| Date▼ | Time↕ | Magnitude↕ | Distance↕ | Depth↕ | Location↕ | Link |
|---|---|---|---|---|---|---|
| 1/20/89 | 9:33 AM | 4.2 | 83.1 km | 10,000 m | Denmark | usgs.gov |
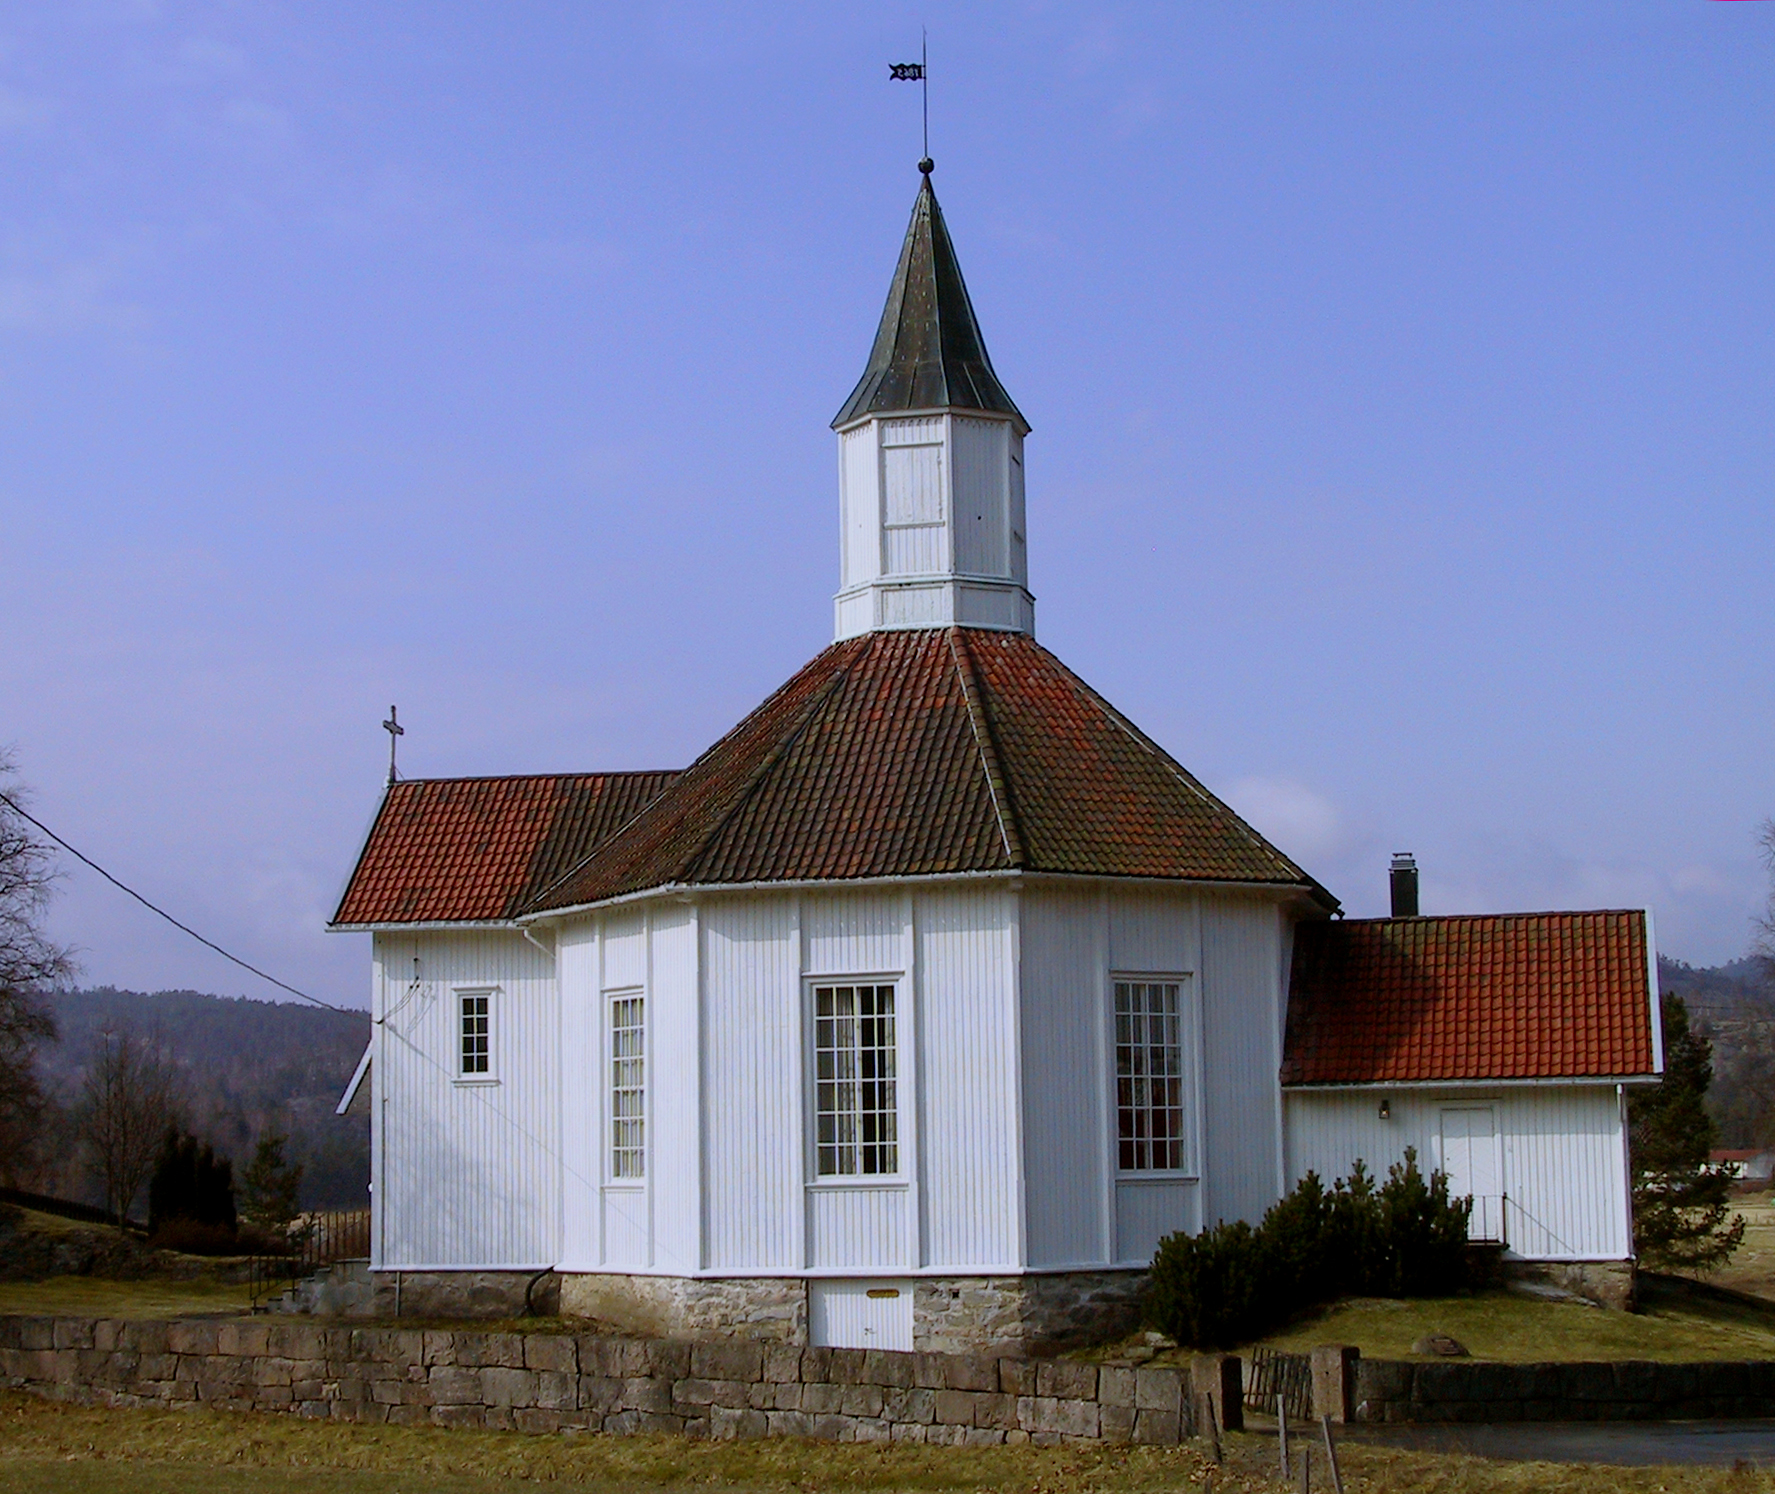
Vegusdal
Vegusdal is a former municipality in Aust-Agder county, Norway. It is located within the present-day municipality of Birkenes in the Sørlandet region. Norwegian national road 405 (Rv405) runs from Vegusdal to Mosby.
Vegusdal Wikipedia Page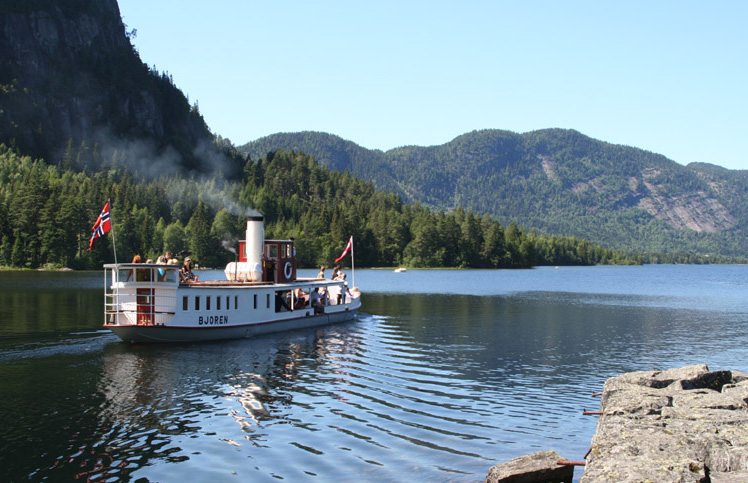

About Our Data
The data on this page is estimated using a number of publicly available tools and resources. It is provided without warranty, and could contain inaccuracies. Use at your own risk.