Categories in Malangawa
Industries
Business Distribution by Industry in Malangawa
| Industry Description | Number of Establishments |
|---|---|
| Shopping | 63 |
| Education | 39 |
| Hardware store | 32 |
| Hospitals | 30 |
| Public administration | 30 |
| Electronics stores | 29 |
| Restaurants | 24 |
| Hindu temple | 23 |
| Hotels and motels | 23 |
| Grocery stores and supermarkets | 21 |
| Clothing stores | 20 |
| Apartments | 17 |
| Shopping other | 15 |
Malangawa Facts
| Area | 8.7 km² |
| Population | 29,537 |
| Male Population | 15,240 (51.6%) |
| Female Population | 14,297 (48.4%) |
| Population change (1975 to 2020) | +1873.1% |
| Population change (2000 to 2020) | +30.0% |
| Median Age | 20.2 years (Male: 19.6, Female: 20.9) |
| Area Codes | 46 |
| Neighborhoods | Madhi Bazar |
| Local Time | |
| Timezone | Nepal Time |
| Lat & Lng | 26.85679, 85.55811 |
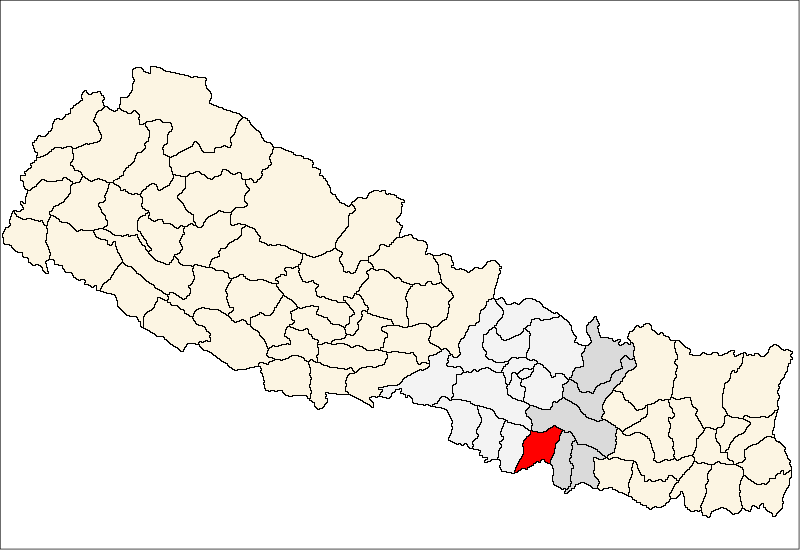
Map of Malangawa
Interactive Map
Malangawa Population
Years 1975 to 2020
| Data | 1975 | 1990 | 2000 | 2015 | 2020 |
|---|---|---|---|---|---|
| Population | 1,497 | 11,344 | 22,725 | 27,504 | 29,537 |
| Population Density | 172.3 / km² | 1,305.8 / km² | 2,615.8 / km² | 3,165.9 / km² | 3,399.9 / km² |
Malangawa Population change from 2000 to 2015
Increase of 21% from year 2000 to 2015
| Location | Change since 1975 | Change since 1990 | Change since 2000 |
|---|---|---|---|
| Malangawa | +1737.3% | +142.5% | +21% |
| Nepal | +115.2% | +52.2% | +20.2% |
Malangawa Median Age
Median Age: 20.2 years
| Location | Median Age | Median Age (Female) | Median Age (Male) |
|---|---|---|---|
| Malangawa | 20.2 yrs | 20.9 yrs | 19.6 yrs |
| Nepal | 21.7 yrs | 22.6 yrs | 20.4 yrs |
Malangawa Population Density
Population Density: 3,400 / km²
| Location | Population | Area | Density |
|---|---|---|---|
| Malangawa | 29,537 | 8.7 km² | 3,400 / km² |
| Nepal | 28.7 million | 147,926.4 km² | 194 / km² |
Malangawa Historical and Projected Population
Estimated Population from 1920 to 2100
- JRC (European Commission's Joint Research Centre) work on the GHS built-up grid
- CIESIN (Center for International Earth Science Information Network)
- [Link] Klein Goldewijk, K., Beusen, A., Doelman, J., and Stehfest, E.: Anthropogenic land use estimates for the Holocene – HYDE 3.2, Earth Syst. Sci. Data, 9, 927–953, https://doi.org/10.5194/essd-9-927-2017, 2017.
Postal Codes
Percentage of businesses by Postal Codes in Malangawa
Human Development Index (HDI)
Statistic composite index of life expectancy, education, and per capita income.
Malangawa CO2 Emissions
Carbon Dioxide (CO2) Emissions Per Capita in Tonnes Per Year
| Location | CO2 Emissions | CO2 Emissions Per Capita | CO2 Emissions Intensity |
|---|---|---|---|
| Malangawa | 10,501 tn | 0.36 tn | 1,208.7 tons/km² |
| Nepal | 11,136,221 tn | 0.39 tn | 75.3 tons/km² |
| 2013 CO2 emissions (tonnes/year) | 10,501 tn |
| 2013 CO2 emissions (tonnes/year) per capita | 0.36 tn |
| 2013 CO2 emissions intensity (tonnes/km²/year) | 1,208.7 tons/km² |
Natural Hazards Risk
Relative risk out of 10
| Hazard | Risk Level |
|---|---|
| Drought | Medium (5) |
| Flood | High (10) |
| Earthquake | High (7.7) |
* Risk, particularly concerning flood or landslide, may not be for the entire area.
- Dilley, M., R.S. Chen, U. Deichmann, A.L. Lerner-Lam, M. Arnold, J. Agwe, P. Buys, O. Kjekstad, B. Lyon, and G. Yetman. 2005. Natural Disaster Hotspots: A Global Risk Analysis. Washington, D.C.: World Bank. https://doi.org/10.1596/0-8213-5930-4.
- Center for Hazards and Risk Research - CHRR - Columbia University, Center for International Earth Science Information Network - CIESIN - Columbia University, and International Research Institute for Climate and Society - IRI - Columbia University. 2005. Global Drought Hazard Frequency and Distribution. Palisades, NY: NASA Socioeconomic Data and Applications Center (SEDAC). https://doi.org/10.7927/H4VX0DFT.
- Center for Hazards and Risk Research - CHRR - Columbia University, Center for International Earth Science Information Network - CIESIN - Columbia University. 2005. Global Flood Hazard Frequency and Distribution. Palisades, NY: NASA Socioeconomic Data and Applications Center (SEDAC). https://doi.org/10.7927/H4668B3D.
- Center for Hazards and Risk Research - CHRR - Columbia University, Center for International Earth Science Information Network - CIESIN - Columbia University. 2005. Global Earthquake Hazard Distribution - Peak Ground Acceleration. Palisades, NY: NASA Socioeconomic Data and Applications Center (SEDAC). https://doi.org/10.7927/H4BZ63ZS.
Recent Nearby Earthquakes
Magnitude 3.0 and greater
| Date▼ | Time↕ | Magnitude↕ | Distance↕ | Depth↕ | Location↕ | Link |
|---|---|---|---|---|---|---|
| 7/2/17 | 1:58 AM | 4.8 | 69.6 km | 10,000 m | 10km SSE of Ramechhap, Nepal | usgs.gov |
| 2/27/17 | 4:21 AM | 4.6 | 67.9 km | 20,280 m | 16km WNW of Ramechhap, Nepal | usgs.gov |
| 2/27/17 | 3:37 AM | 4.7 | 81.5 km | 11,230 m | 11km N of Ramechhap, Nepal | usgs.gov |
| 4/12/16 | 2:41 PM | 4.3 | 96.9 km | 10,000 m | 31km N of Ramechhap, Nepal | usgs.gov |
| 4/9/16 | 1:20 PM | 4.1 | 90 km | 10,220 m | 4km SSW of Patan, Nepal | usgs.gov |
| 4/4/16 | 4:31 AM | 4.2 | 80.4 km | 23,690 m | 32km E of Panaoti, Nepal | usgs.gov |
| 3/14/16 | 9:27 PM | 4.3 | 96.1 km | 27,090 m | 1km NE of Nagarkot, Nepal | usgs.gov |
| 2/10/16 | 4:27 PM | 4.1 | 95 km | 21,150 m | 10km E of Nagarkot, Nepal | usgs.gov |
| 10/6/15 | 11:30 PM | 4.3 | 99.6 km | 14,040 m | 31km S of Kodari, Nepal | usgs.gov |
| 10/5/15 | 7:33 AM | 4.5 | 98.7 km | 10,000 m | 35km SSE of Kodari, Nepal | usgs.gov |
Malangawa
Malangwa ( Nepali pronunciation ) is a town and municipality and the headquarters of Sarlahi District in the Janakpur Zone of Nepal. It is located at 26°52'0N 85°34'0E with an altitude of 79 metres (262 feet) near the border with India at Sonbarsa. T..
Malangawa Wikipedia Page
About Our Data
The data on this page is estimated using a number of publicly available tools and resources. It is provided without warranty, and could contain inaccuracies. Use at your own risk.