Categories in Muktināth
Industries
Business Distribution by Industry in Muktināth
| Industry Description | Number of Establishments |
|---|---|
| Religion | 10 |
| Hotels and motels | 9 |
Muktināth Facts
| Area | 55.1 km² |
| Population | 648 |
| Male Population | 311 (48.0%) |
| Female Population | 337 (52.0%) |
| Population change (1975 to 2020) | +463.5% |
| Population change (2000 to 2020) | -19.8% |
| Median Age | 35.2 years (Male: 36.3, Female: 34.1) |
| Local Time | |
| Timezone | Nepal Time |
| Lat & Lng | 28.81499, 83.87538 |
| Postal Codes | 33107 |
Map of Muktināth
Interactive Map
Muktināth Population
Years 1975 to 2020
| Data | 1975 | 1990 | 2000 | 2015 | 2020 |
|---|---|---|---|---|---|
| Population | 115 | 552 | 808 | 624 | 648 |
| Population Density | 2.1 / km² | 10 / km² | 14.7 / km² | 11.3 / km² | 11.8 / km² |
Muktināth Population change from 2000 to 2015
Decrease of 22.8% from year 2000 to 2015
| Location | Change since 1975 | Change since 1990 | Change since 2000 |
|---|---|---|---|
| Muktināth | +442.6% | +13% | -22.8% |
| Nepal | +115.2% | +52.2% | +20.2% |
Muktināth Median Age
Median Age: 35.2 years
| Location | Median Age | Median Age (Female) | Median Age (Male) |
|---|---|---|---|
| Muktināth | 35.2 yrs | 34.1 yrs | 36.3 yrs |
| Nepal | 21.7 yrs | 22.6 yrs | 20.4 yrs |
Muktināth Population Density
Population Density: 11.8 / km²
| Location | Population | Area | Density |
|---|---|---|---|
| Muktināth | 648 | 55.1 km² | 11.8 / km² |
| Nepal | 28.7 million | 147,926.4 km² | 194 / km² |
Muktināth Historical and Projected Population
Estimated Population from 0 to 2100
- JRC (European Commission's Joint Research Centre) work on the GHS built-up grid
- CIESIN (Center for International Earth Science Information Network)
- [Link] Klein Goldewijk, K., Beusen, A., Doelman, J., and Stehfest, E.: Anthropogenic land use estimates for the Holocene – HYDE 3.2, Earth Syst. Sci. Data, 9, 927–953, https://doi.org/10.5194/essd-9-927-2017, 2017.
Human Development Index (HDI)
Statistic composite index of life expectancy, education, and per capita income.
Muktināth CO2 Emissions
Carbon Dioxide (CO2) Emissions Per Capita in Tonnes Per Year
| Location | CO2 Emissions | CO2 Emissions Per Capita | CO2 Emissions Intensity |
|---|---|---|---|
| Muktināth | 209 tn | 0.32 tn | 3.8 tons/km² |
| Nepal | 11,136,221 tn | 0.39 tn | 75.3 tons/km² |
| 2013 CO2 emissions (tonnes/year) | 209 tn |
| 2013 CO2 emissions (tonnes/year) per capita | 0.32 tn |
| 2013 CO2 emissions intensity (tonnes/km²/year) | 3.8 tons/km² |
Natural Hazards Risk
Relative risk out of 10
| Hazard | Risk Level |
|---|---|
| Drought | Medium (5) |
| Flood | High (9) |
| Earthquake | High (8) |
| Landslide | Medium (6) |
* Risk, particularly concerning flood or landslide, may not be for the entire area.
- Dilley, M., R.S. Chen, U. Deichmann, A.L. Lerner-Lam, M. Arnold, J. Agwe, P. Buys, O. Kjekstad, B. Lyon, and G. Yetman. 2005. Natural Disaster Hotspots: A Global Risk Analysis. Washington, D.C.: World Bank. https://doi.org/10.1596/0-8213-5930-4.
- Center for Hazards and Risk Research - CHRR - Columbia University, Center for International Earth Science Information Network - CIESIN - Columbia University, and Norwegian Geotechnical Institute - NGI. 2005. Global Landslide Hazard Distribution. Palisades, NY: NASA Socioeconomic Data and Applications Center (SEDAC). https://doi.org/10.7927/H4P848VZ.
- Center for Hazards and Risk Research - CHRR - Columbia University, Center for International Earth Science Information Network - CIESIN - Columbia University, and International Research Institute for Climate and Society - IRI - Columbia University. 2005. Global Drought Hazard Frequency and Distribution. Palisades, NY: NASA Socioeconomic Data and Applications Center (SEDAC). https://doi.org/10.7927/H4VX0DFT.
- Center for Hazards and Risk Research - CHRR - Columbia University, Center for International Earth Science Information Network - CIESIN - Columbia University. 2005. Global Flood Hazard Frequency and Distribution. Palisades, NY: NASA Socioeconomic Data and Applications Center (SEDAC). https://doi.org/10.7927/H4668B3D.
- Center for Hazards and Risk Research - CHRR - Columbia University, Center for International Earth Science Information Network - CIESIN - Columbia University. 2005. Global Earthquake Hazard Distribution - Peak Ground Acceleration. Palisades, NY: NASA Socioeconomic Data and Applications Center (SEDAC). https://doi.org/10.7927/H4BZ63ZS.
Recent Nearby Earthquakes
Magnitude 3.0 and greater
| Date▼ | Time↕ | Magnitude↕ | Distance↕ | Depth↕ | Location↕ | Link |
|---|---|---|---|---|---|---|
| 1/31/16 | 4:39 AM | 4.1 | 98.6 km | 10,000 m | 9km E of Zhadong, China | usgs.gov |
| 5/2/15 | 5:35 AM | 4.9 | 94.5 km | 10,000 m | 29km E of Khudi, Nepal | usgs.gov |
| 4/26/15 | 2:48 AM | 4.5 | 95.3 km | 10,000 m | 21km E of Lamjung, Nepal | usgs.gov |
| 4/25/15 | 6:20 AM | 5.4 | 90.7 km | 10,000 m | 12km E of Lamjung, Nepal | usgs.gov |
| 1/31/15 | 1:59 PM | 4.8 | 58 km | 32,409 m | 3km N of Pokhara, Nepal | usgs.gov |
| 6/9/12 | 7:54 AM | 4.8 | 52.1 km | 20,100 m | Nepal | usgs.gov |
| 12/22/08 | 9:19 PM | 3.5 | 78.6 km | 10,000 m | Nepal | usgs.gov |
| 4/8/08 | 8:41 PM | 3.3 | 70.5 km | 27,600 m | Nepal | usgs.gov |
| 3/5/08 | 10:46 AM | 3.4 | 81.9 km | 26,200 m | Nepal | usgs.gov |
| 2/24/08 | 5:07 PM | 3.7 | 67.5 km | 35,000 m | Nepal | usgs.gov |
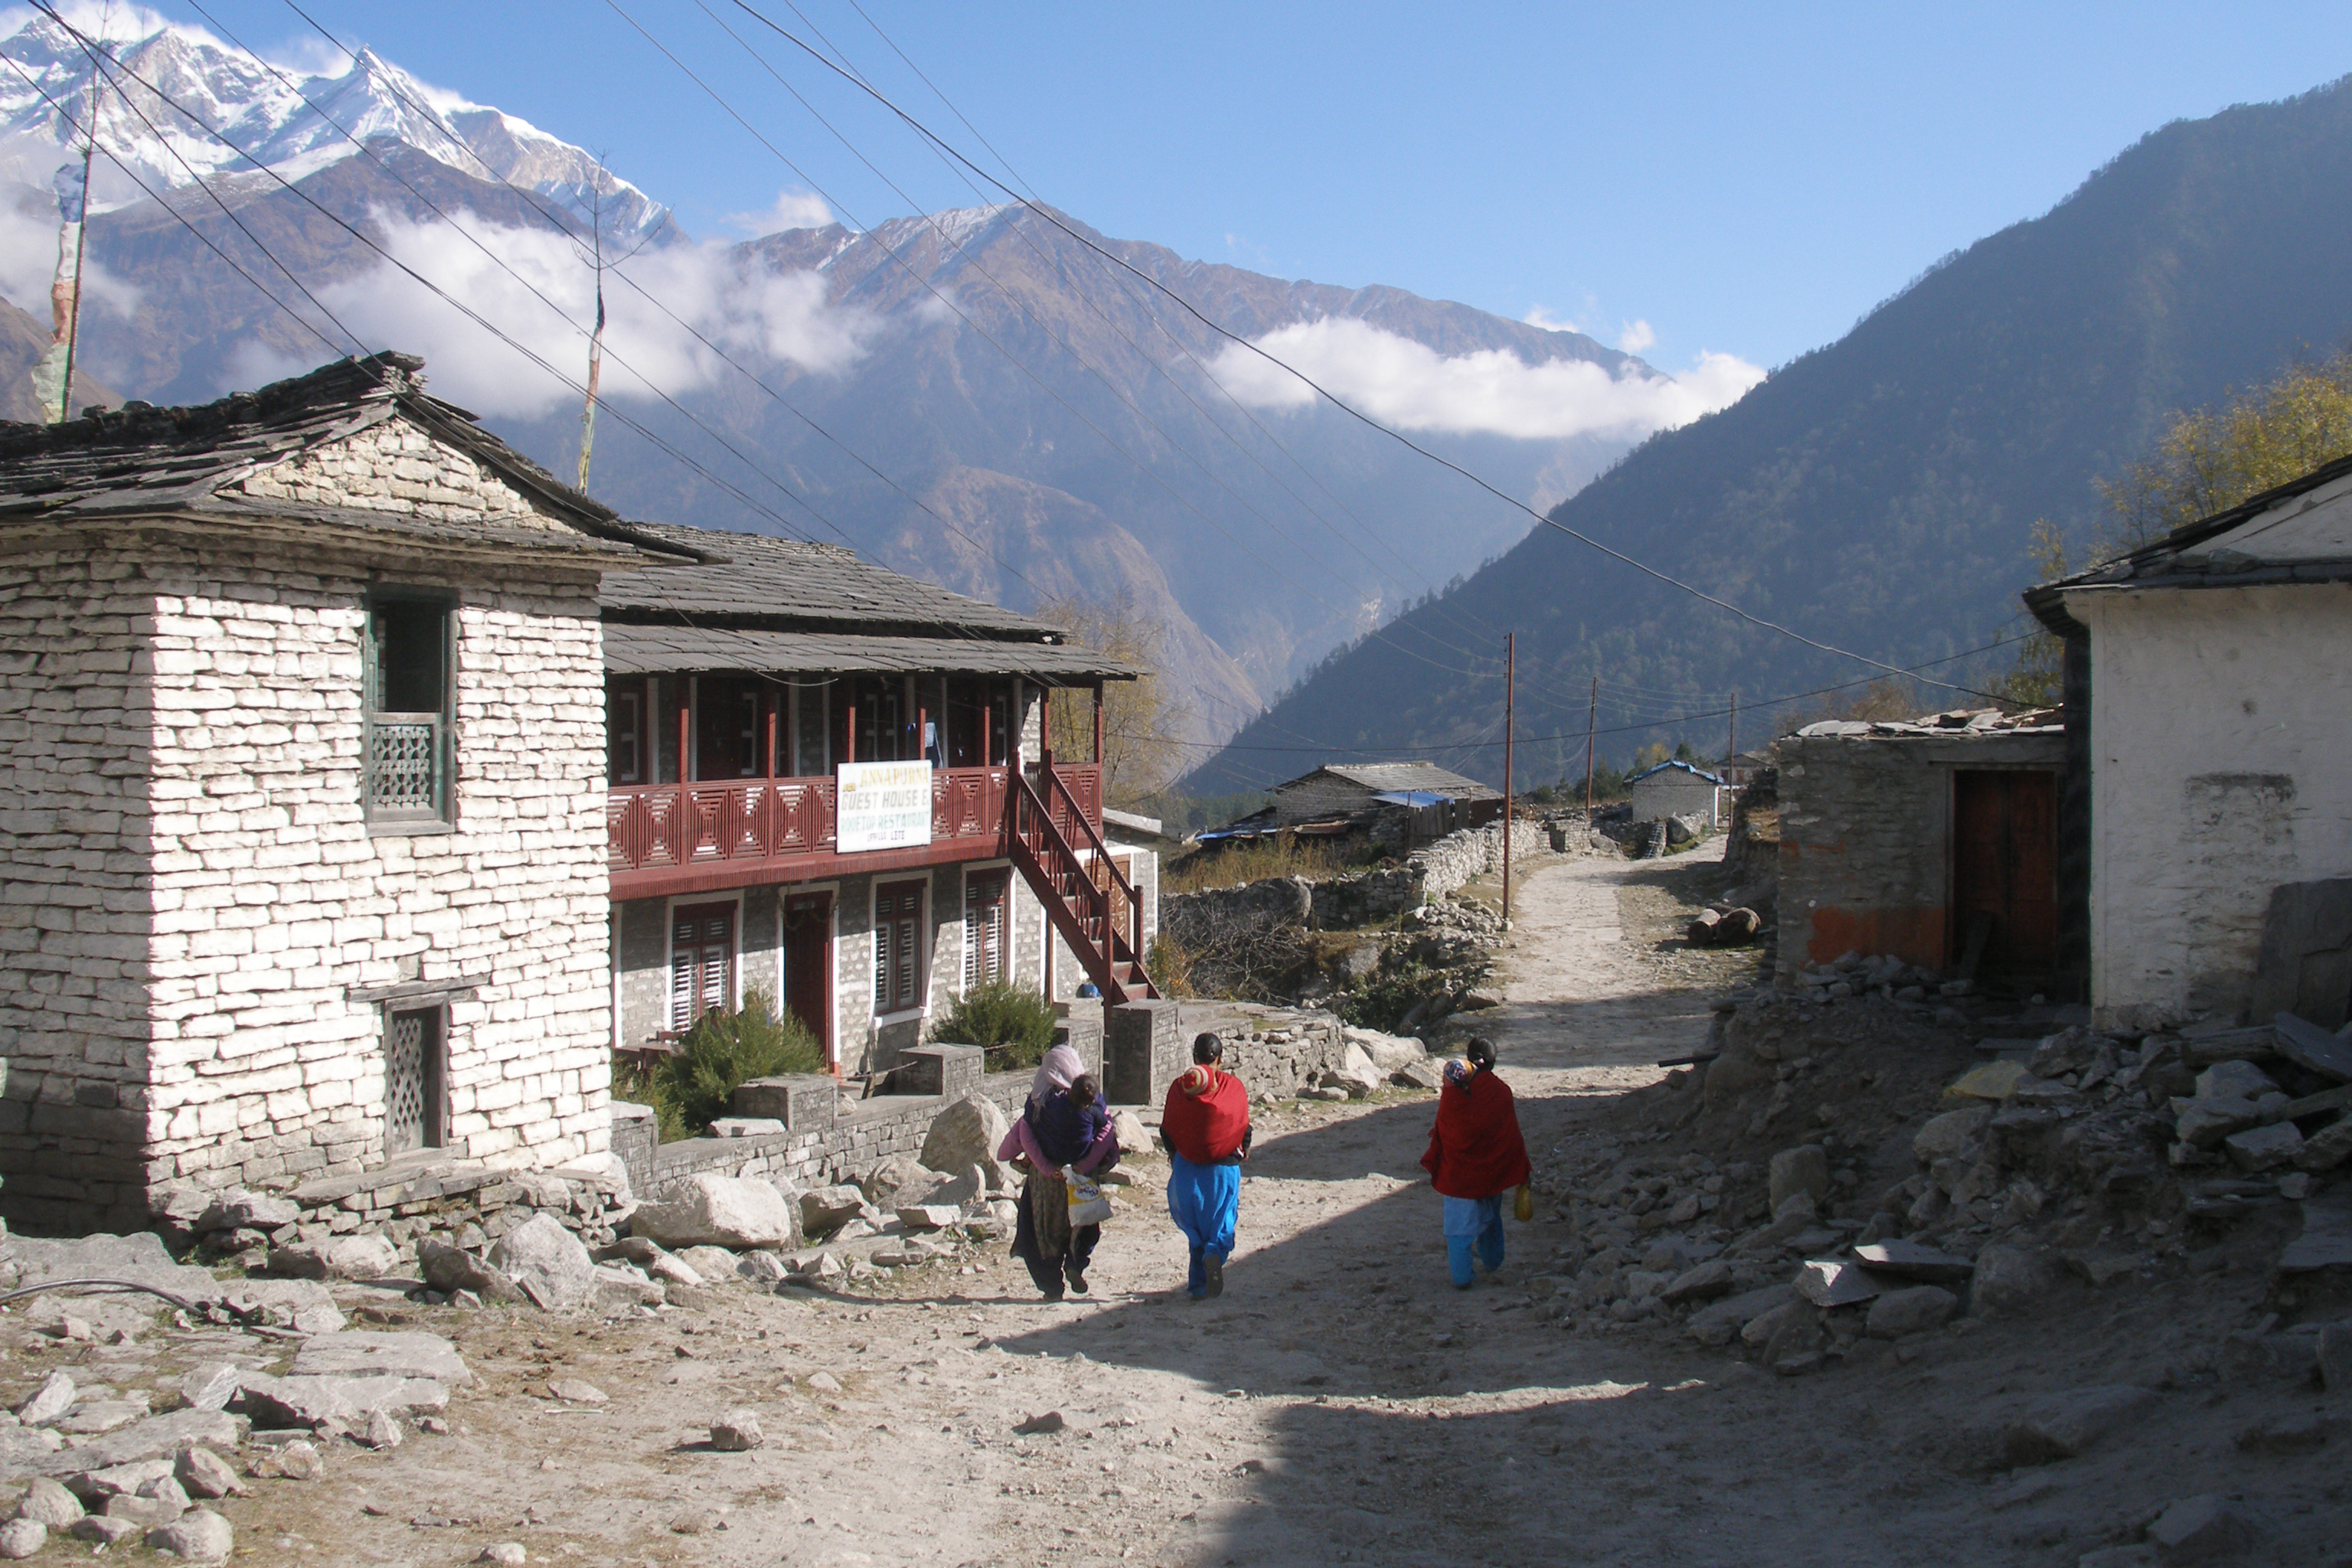
Muktinath
Muktinath is a sacred place both for Hindus and Buddhists located in Muktinath Valley at an altitude of 3,710 meters at the foot of the Thorong La mountain pass (part of the Himalayas), Mustang, Nepal. The site is close to the village of Ranipauwa, w..
Muktinath Wikipedia Page


About Our Data
The data on this page is estimated using a number of publicly available tools and resources. It is provided without warranty, and could contain inaccuracies. Use at your own risk.