Categories in Panchkhal
Panchkhal Facts
| Area | 17.4 km² |
| Population | 19,463 |
| Male Population | 9,317 (47.9%) |
| Female Population | 10,146 (52.1%) |
| Population change (1975 to 2020) | -84.3% |
| Population change (2000 to 2020) | -76.1% |
| Median Age | 25 years (Male: 24.3, Female: 25.7) |
| Neighborhoods | Hokse, Palanchok, Dulalthok, Zero Kilo, Deubhumi Baluwa |
| Local Time | |
| Timezone | Nepal Time |
| Lat & Lng | 27.65660, 85.62745 |
| Postal Codes | 45212 |
Map of Panchkhal
Interactive Map
Panchkhal Population
Years 1975 to 2020
| Data | 1975 | 1990 | 2000 | 2015 | 2020 |
|---|---|---|---|---|---|
| Population | 123,668 | 145,480 | 81,427 | 17,726 | 19,463 |
| Population Density | 7,092.1 / km² | 8,342.9 / km² | 4,669.6 / km² | 1,016.5 / km² | 1,116.2 / km² |
Panchkhal Population change from 2000 to 2015
Decrease of 78.2% from year 2000 to 2015
| Location | Change since 1975 | Change since 1990 | Change since 2000 |
|---|---|---|---|
| Panchkhal | -85.7% | -87.8% | -78.2% |
| Nepal | +115.2% | +52.2% | +20.2% |
Panchkhal Median Age
Median Age: 25 years
| Location | Median Age | Median Age (Female) | Median Age (Male) |
|---|---|---|---|
| Panchkhal | 25 yrs | 25.7 yrs | 24.3 yrs |
| Nepal | 21.7 yrs | 22.6 yrs | 20.4 yrs |
Panchkhal Population Density
Population Density: 1,116 / km²
| Location | Population | Area | Density |
|---|---|---|---|
| Panchkhal | 19,463 | 17.4 km² | 1,116 / km² |
| Nepal | 28.7 million | 147,926.4 km² | 194 / km² |
Panchkhal Historical and Projected Population
Estimated Population from 0 to 2100
- JRC (European Commission's Joint Research Centre) work on the GHS built-up grid
- CIESIN (Center for International Earth Science Information Network)
- [Link] Klein Goldewijk, K., Beusen, A., Doelman, J., and Stehfest, E.: Anthropogenic land use estimates for the Holocene – HYDE 3.2, Earth Syst. Sci. Data, 9, 927–953, https://doi.org/10.5194/essd-9-927-2017, 2017.
Neighborhoods in Panchkhal
Percentage of businesses by neighborhood in Panchkhal
Human Development Index (HDI)
Statistic composite index of life expectancy, education, and per capita income.
Panchkhal CO2 Emissions
Carbon Dioxide (CO2) Emissions Per Capita in Tonnes Per Year
| Location | CO2 Emissions | CO2 Emissions Per Capita | CO2 Emissions Intensity |
|---|---|---|---|
| Panchkhal | 7,000 tn | 0.36 tn | 401.4 tons/km² |
| Nepal | 11,136,221 tn | 0.39 tn | 75.3 tons/km² |
| 2013 CO2 emissions (tonnes/year) | 7,000 tn |
| 2013 CO2 emissions (tonnes/year) per capita | 0.36 tn |
| 2013 CO2 emissions intensity (tonnes/km²/year) | 401.4 tons/km² |
Natural Hazards Risk
Relative risk out of 10
| Hazard | Risk Level |
|---|---|
| Drought | Medium (7) |
| Flood | High (10) |
| Earthquake | High (9.2) |
* Risk, particularly concerning flood or landslide, may not be for the entire area.
- Dilley, M., R.S. Chen, U. Deichmann, A.L. Lerner-Lam, M. Arnold, J. Agwe, P. Buys, O. Kjekstad, B. Lyon, and G. Yetman. 2005. Natural Disaster Hotspots: A Global Risk Analysis. Washington, D.C.: World Bank. https://doi.org/10.1596/0-8213-5930-4.
- Center for Hazards and Risk Research - CHRR - Columbia University, Center for International Earth Science Information Network - CIESIN - Columbia University, and International Research Institute for Climate and Society - IRI - Columbia University. 2005. Global Drought Hazard Frequency and Distribution. Palisades, NY: NASA Socioeconomic Data and Applications Center (SEDAC). https://doi.org/10.7927/H4VX0DFT.
- Center for Hazards and Risk Research - CHRR - Columbia University, Center for International Earth Science Information Network - CIESIN - Columbia University. 2005. Global Flood Hazard Frequency and Distribution. Palisades, NY: NASA Socioeconomic Data and Applications Center (SEDAC). https://doi.org/10.7927/H4668B3D.
- Center for Hazards and Risk Research - CHRR - Columbia University, Center for International Earth Science Information Network - CIESIN - Columbia University. 2005. Global Earthquake Hazard Distribution - Peak Ground Acceleration. Palisades, NY: NASA Socioeconomic Data and Applications Center (SEDAC). https://doi.org/10.7927/H4BZ63ZS.
Recent Nearby Earthquakes
Magnitude 3.0 and greater
| Date▼ | Time↕ | Magnitude↕ | Distance↕ | Depth↕ | Location↕ | Link |
|---|---|---|---|---|---|---|
| 12/22/18 | 11:21 PM | 4.1 | 15.1 km | 10,000 m | 7km NNE of Nagarkot, Nepal | usgs.gov |
| 9/18/16 | 5:14 PM | 4.2 | 23.5 km | 25,200 m | 12km NNW of Nagarkot, Nepal | usgs.gov |
| 4/4/16 | 4:31 AM | 4.2 | 24.6 km | 23,690 m | 32km E of Panaoti, Nepal | usgs.gov |
| 3/30/16 | 12:26 PM | 4.1 | 19.4 km | 10,000 m | 11km NNE of Nagarkot, Nepal | usgs.gov |
| 3/14/16 | 9:27 PM | 4.3 | 11.8 km | 27,090 m | 1km NE of Nagarkot, Nepal | usgs.gov |
| 2/24/16 | 9:22 AM | 4.7 | 22.2 km | 10,000 m | 24km ENE of Nagarkot, Nepal | usgs.gov |
| 2/10/16 | 4:27 PM | 4.1 | 6.1 km | 21,150 m | 10km E of Nagarkot, Nepal | usgs.gov |
| 11/19/15 | 4:15 AM | 5 | 22.3 km | 16,510 m | 21km NE of Nagarkot, Nepal | usgs.gov |
| 9/29/15 | 10:54 AM | 4.4 | 22.9 km | 10,000 m | 23km SSW of Kodari, Nepal | usgs.gov |
| 8/30/15 | 1:17 PM | 4.5 | 4 km | 10,000 m | 14km E of Banepa, Nepal | usgs.gov |
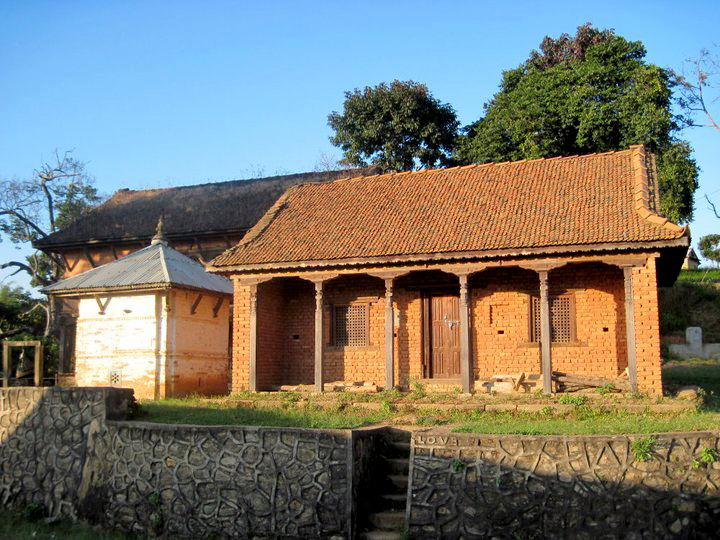
Panchkhal
Panchkhal is a Municipality in Kabhrepalanchok District in the Bagmati Zone of central Nepal. At the time of the 1991 Nepal census it had a population of 9481 in 1657 individual households. This place is situated in Bagmati, Central, Nepal, its geogr..
Panchkhal Wikipedia Page

About Our Data
The data on this page is estimated using a number of publicly available tools and resources. It is provided without warranty, and could contain inaccuracies. Use at your own risk.