Categories in Andersons Bay
Industries
Business Distribution by Industry in Andersons Bay
| Industry Description | Number of Establishments |
|---|---|
| Corporate management | 7 |
Andersons Bay Facts
| Area | 2.0 km² |
| Population | 2,780 |
| Male Population | 1,299 (46.7%) |
| Female Population | 1,481 (53.3%) |
| Population change (1975 to 2020) | +14.1% |
| Population change (2000 to 2020) | +0.6% |
| Median Age | 36.6 years (Male: 35.4, Female: 37.7) |
| Local Time | |
| Timezone | New Zealand Standard Time |
| Lat & Lng | -45.88838, 170.52010 |
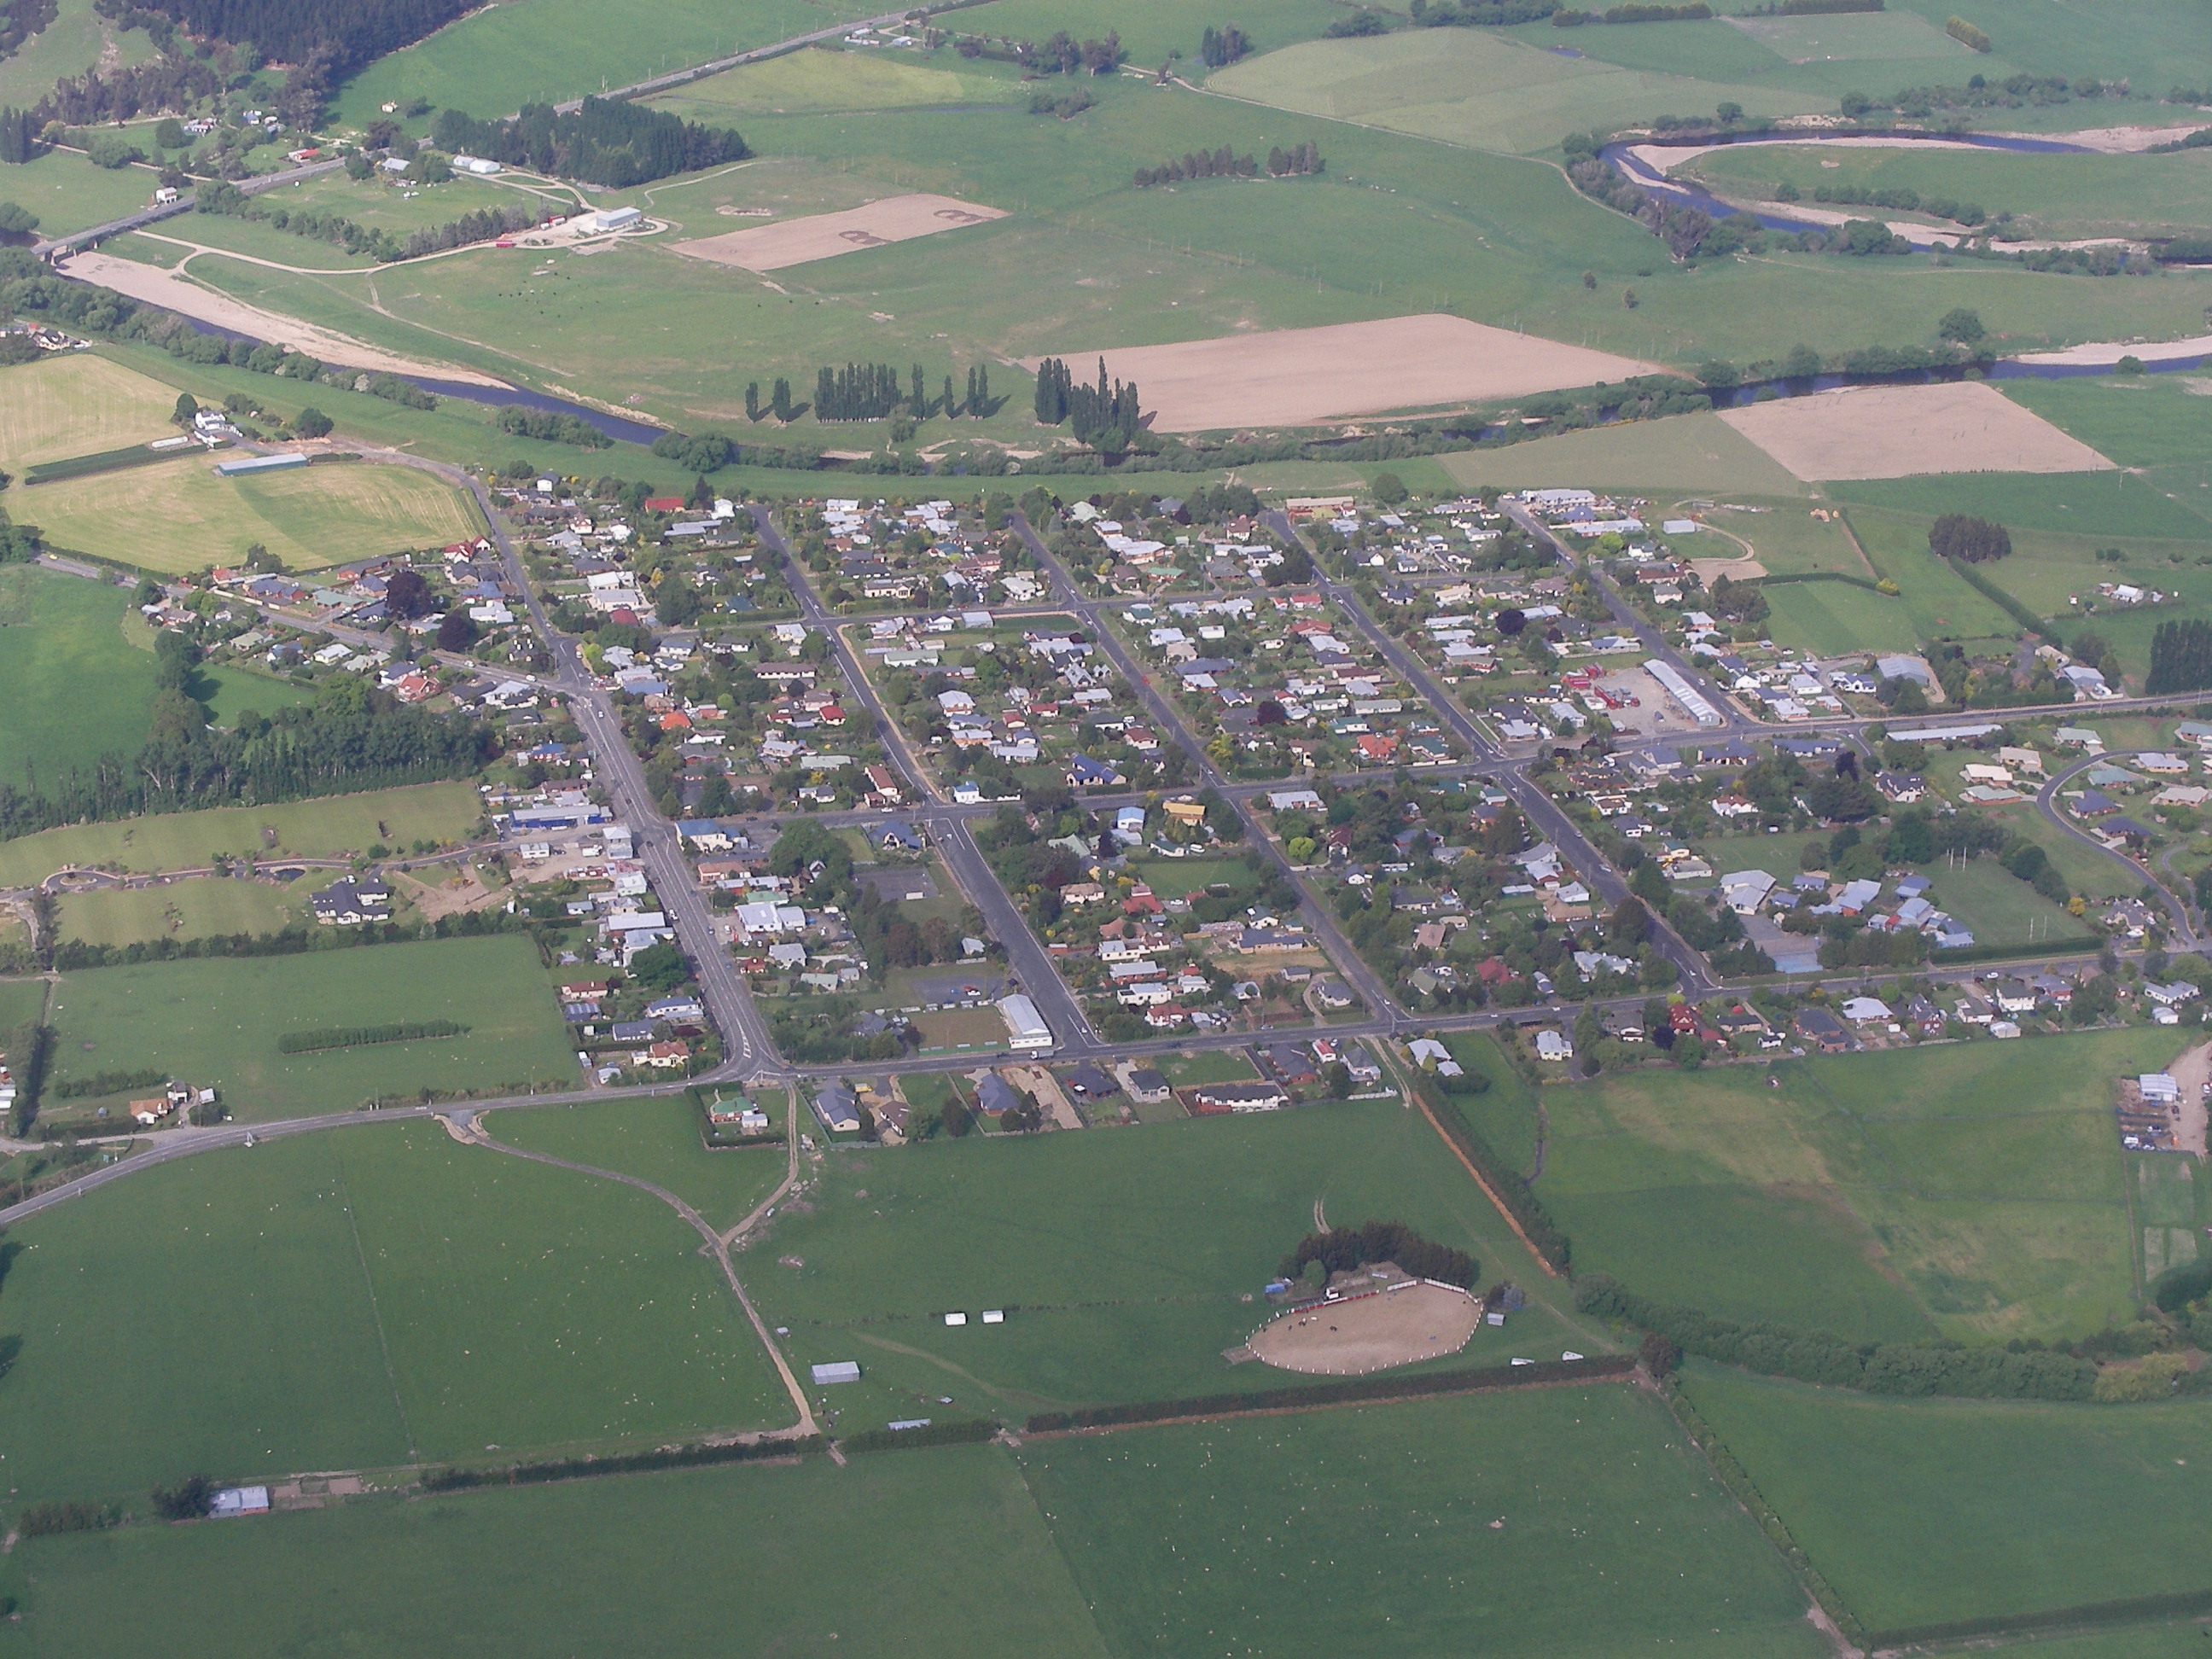
Map of Andersons Bay
Interactive Map
Andersons Bay Population
Years 1975 to 2030
| Data | 1975 | 1990 | 2000 | 2015 | 2020 | 2025* | 2030* |
|---|---|---|---|---|---|---|---|
| Population | 2,436 | 2,552 | 2,763 | 2,993 | 2,780 | 2,872 | 2,973 |
| Population Density | 1,218 / km² | 1,276 / km² | 1,381.5 / km² | 1,496.5 / km² | 1,390 / km² | 1,436 / km² | 1,486.5 / km² |
Andersons Bay Population change from 2000 to 2020
Increase of 0.6% from year 2000 to 2020
| Location | Change since 1975 | Change since 1990 | Change since 2000 |
|---|---|---|---|
| Andersons Bay | +14.1% | +8.9% | +0.6% |
| Otago | — | — | — |
| New Zealand | — | — | — |
Andersons Bay Median Age
Median Age: 36.6 years
| Location | Median Age | Median Age (Female) | Median Age (Male) |
|---|---|---|---|
| Andersons Bay | 36.6 yrs | 37.7 yrs | 35.4 yrs |
| Otago | 38.8 yrs | 39.5 yrs | 38 yrs |
| New Zealand | 37.9 yrs | 38.9 yrs | 36.9 yrs |
Andersons Bay Population Density
Population Density: 1,390 / km²
| Location | Population | Area | Density |
|---|---|---|---|
| Andersons Bay | 2,780 | 2 km² | 1,390 / km² |
| Otago | 215,607 | 38,478.4 km² | 5.6 / km² |
| New Zealand | 4.4 million | 270,103.3 km² | 16.3 / km² |
Andersons Bay Historical and Projected Population
Estimated Population from 1860 to 2100
- JRC (European Commission's Joint Research Centre) work on the GHS built-up grid
- CIESIN (Center for International Earth Science Information Network)
- [Link] Klein Goldewijk, K., Beusen, A., Doelman, J., and Stehfest, E.: Anthropogenic land use estimates for the Holocene – HYDE 3.2, Earth Syst. Sci. Data, 9, 927–953, https://doi.org/10.5194/essd-9-927-2017, 2017.
Human Development Index (HDI)
Statistic composite index of life expectancy, education, and per capita income.
Andersons Bay CO2 Emissions
Carbon Dioxide (CO2) Emissions Per Capita in Tonnes Per Year
| Location | CO2 Emissions | CO2 Emissions Per Capita | CO2 Emissions Intensity |
|---|---|---|---|
| Andersons Bay | 24,816 tn | 8.93 tn | 12,407.9 tons/km² |
| Otago | 1,696,568 tn | 7.87 tn | 44.1 tons/km² |
| New Zealand | 37,929,206 tn | 8.61 tn | 140.4 tons/km² |
| 2013 CO2 emissions (tonnes/year) | 24,816 tn |
| 2013 CO2 emissions (tonnes/year) per capita | 8.93 tn |
| 2013 CO2 emissions intensity (tonnes/km²/year) | 12,407.9 tons/km² |
Natural Hazards Risk
Relative risk out of 10
| Hazard | Risk Level |
|---|---|
| Earthquake | Medium (7) |
| Landslide | Medium (6) |
* Risk, particularly concerning flood or landslide, may not be for the entire area.
- Dilley, M., R.S. Chen, U. Deichmann, A.L. Lerner-Lam, M. Arnold, J. Agwe, P. Buys, O. Kjekstad, B. Lyon, and G. Yetman. 2005. Natural Disaster Hotspots: A Global Risk Analysis. Washington, D.C.: World Bank. https://doi.org/10.1596/0-8213-5930-4.
- Center for Hazards and Risk Research - CHRR - Columbia University, Center for International Earth Science Information Network - CIESIN - Columbia University, and Norwegian Geotechnical Institute - NGI. 2005. Global Landslide Hazard Distribution. Palisades, NY: NASA Socioeconomic Data and Applications Center (SEDAC). https://doi.org/10.7927/H4P848VZ.
- Center for Hazards and Risk Research - CHRR - Columbia University, Center for International Earth Science Information Network - CIESIN - Columbia University. 2005. Global Earthquake Hazard Distribution - Peak Ground Acceleration. Palisades, NY: NASA Socioeconomic Data and Applications Center (SEDAC). https://doi.org/10.7927/H4BZ63ZS.
Recent Nearby Earthquakes
Magnitude 3.0 and greater
| Date▼ | Time↕ | Magnitude↕ | Distance↕ | Depth↕ | Location↕ | Link |
|---|---|---|---|---|---|---|
| 6/1/15 | 11:18 AM | 4.3 | 35.4 km | 8,990 m | 33km WNW of Dunedin, New Zealand | usgs.gov |
| 10/16/14 | 5:44 AM | 4.1 | 31.6 km | 4,000 m | 29km WNW of Dunedin, New Zealand | usgs.gov |
| 12/17/07 | 9:05 AM | 4.2 | 37.2 km | 12,000 m | off the east coast of the South Island of New Zealand | usgs.gov |
| 2/24/06 | 11:03 PM | 3.7 | 55.2 km | 12,000 m | off the east coast of the South Island of New Zealand | usgs.gov |
| 12/24/04 | 8:44 AM | 3.9 | 82.5 km | 12,000 m | South Island of New Zealand | usgs.gov |
| 2/11/04 | 12:31 AM | 4.5 | 78.5 km | 12,000 m | South Island of New Zealand | usgs.gov |
| 6/30/03 | 4:23 PM | 3.8 | 80.9 km | 21,000 m | South Island of New Zealand | usgs.gov |
| 10/21/00 | 1:57 PM | 4 | 95 km | 12,000 m | off the east coast of the South Island of New Zealand | usgs.gov |
| 10/12/00 | 8:40 AM | 4.5 | 97.9 km | 31,000 m | South Island of New Zealand | usgs.gov |
| 5/3/94 | 7:29 AM | 3.8 | 23.4 km | 33,000 m | off the east coast of the South Island of New Zealand | usgs.gov |
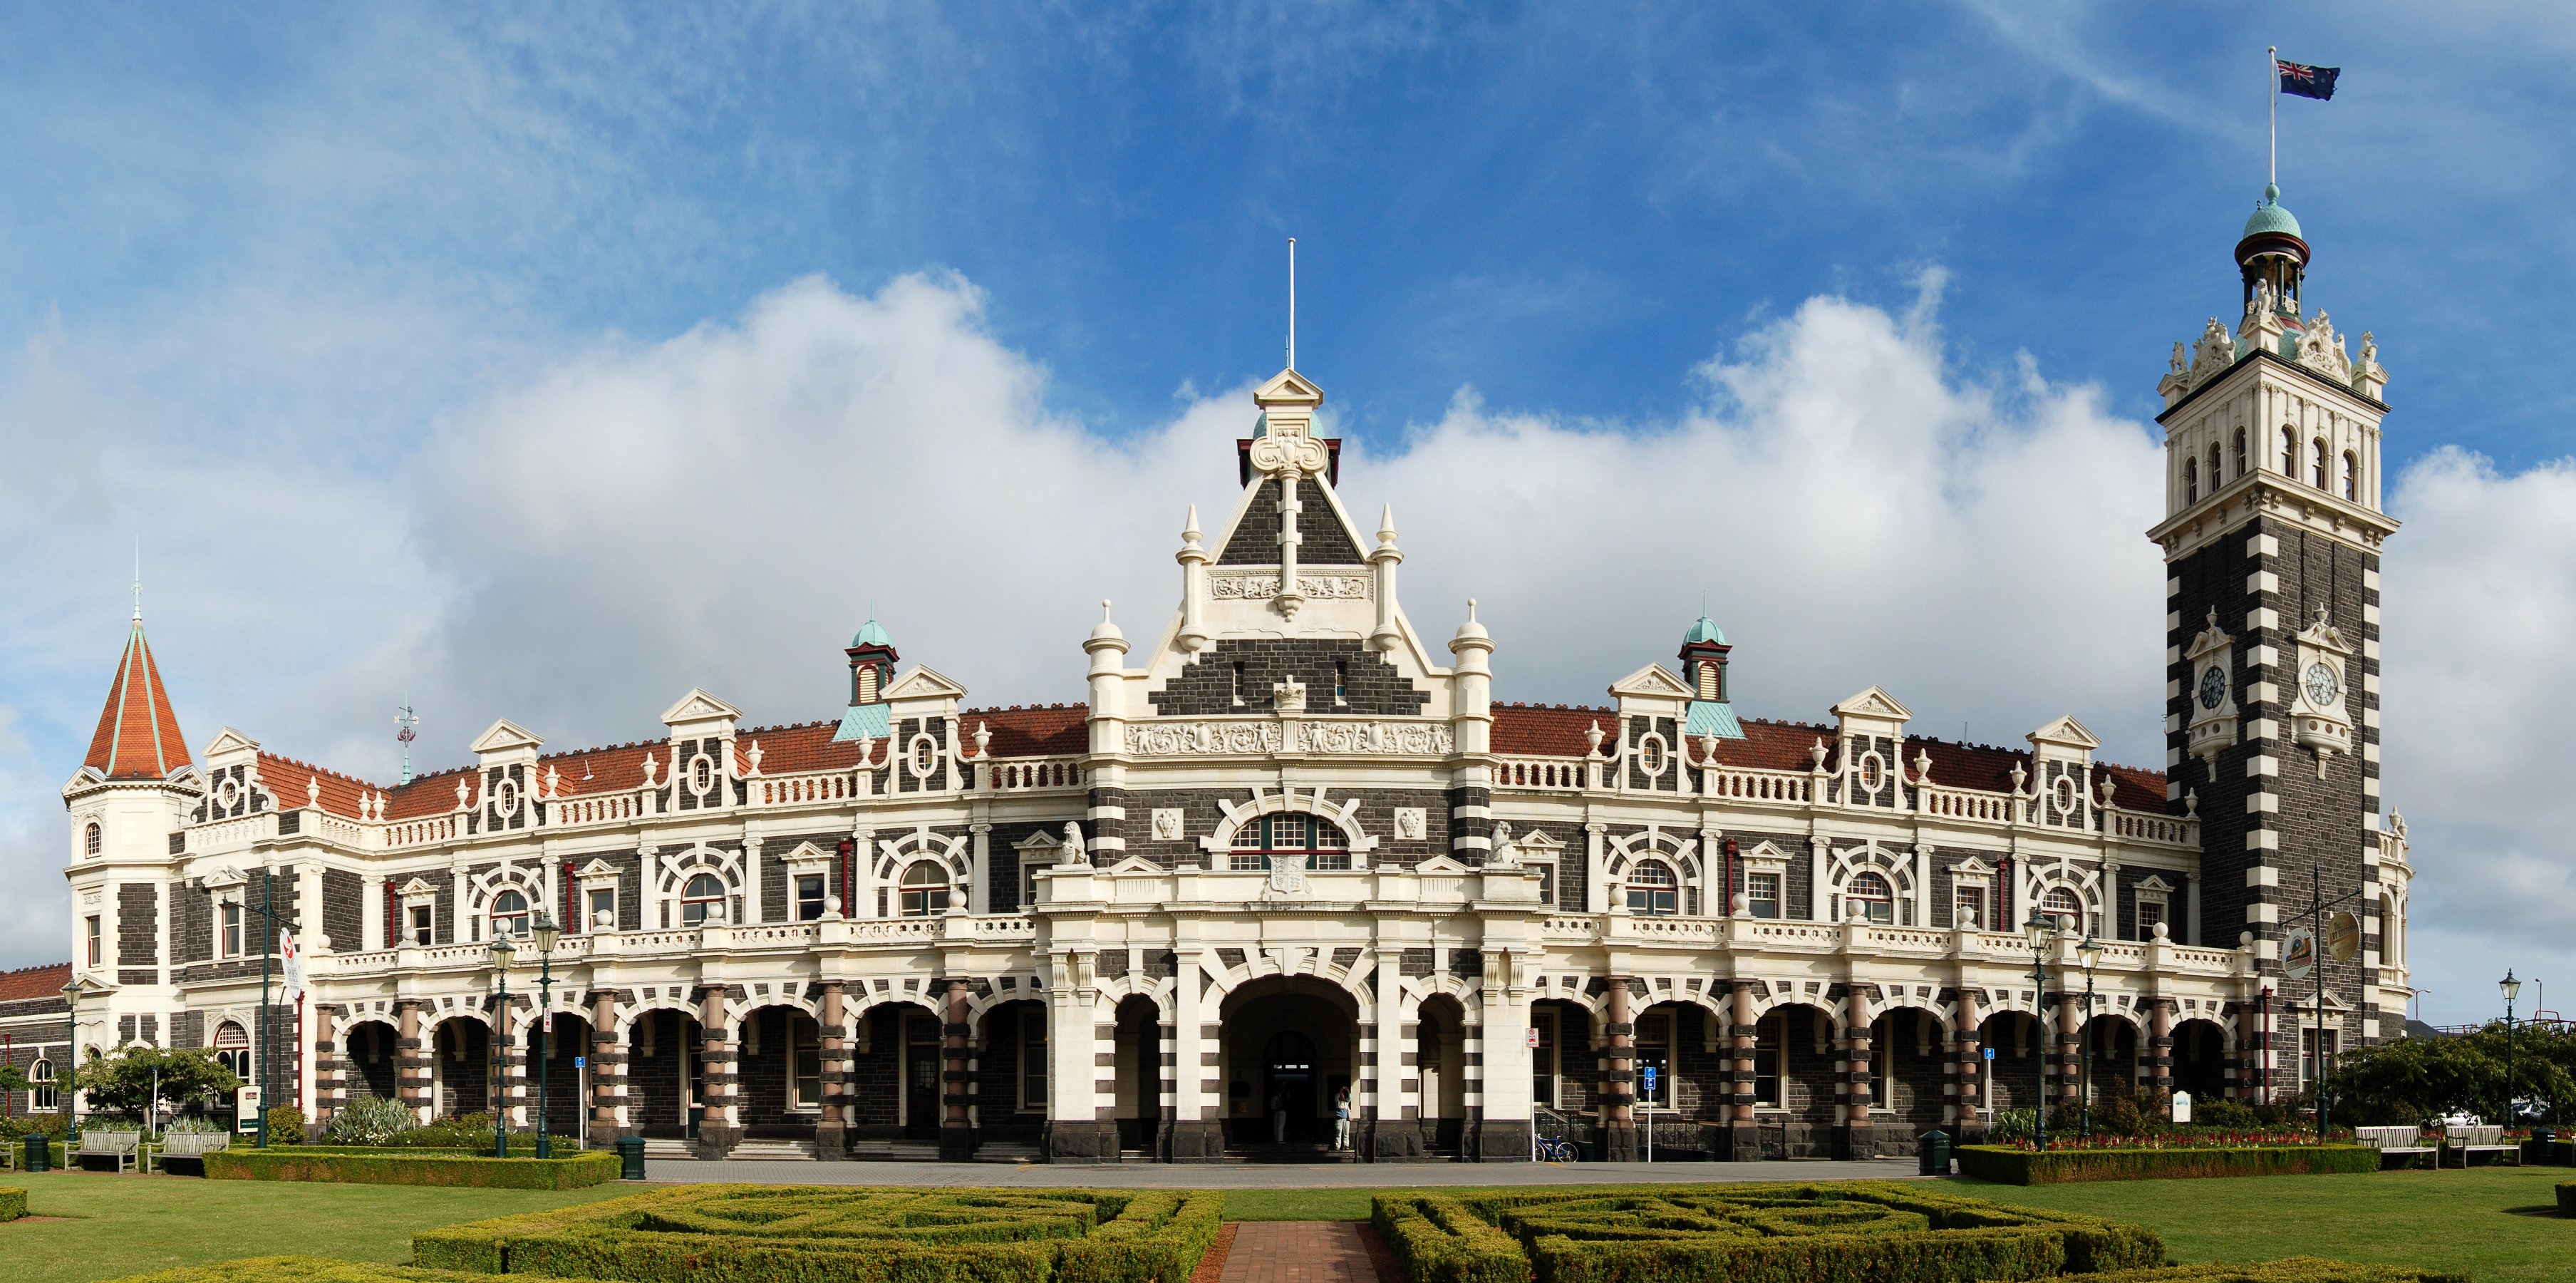
Andersons Bay
Andersons Bay (sometimes spelt in the grammatically correct former form Anderson's Bay, and often known locally simply as "Andy Bay") is a suburb of the New Zealand city of Dunedin. It is located in the southeast of the city's urban area, 2.8 kilomet..
Andersons Bay Wikipedia Page

About Our Data
The data on this page is estimated using a number of publicly available tools and resources. It is provided without warranty, and could contain inaccuracies. Use at your own risk.