Luggate Facts
| Area | 203.0 km² |
| Population | 532 |
| Male Population | 266 (50.1%) |
| Female Population | 266 (49.9%) |
| Population change (1975 to 2020) | +202.3% |
| Population change (2000 to 2020) | +34.3% |
| Median Age | 36.5 years (Male: 36.5, Female: 36.6) |
| GDP per capita (PPP) | $27,308 (2022) |
| Neighborhoods | Rd 3 Cromwell, Wanaka Airport |
| Local Time | |
| Timezone | New Zealand Standard Time |
| Lat & Lng | -44.75000, 169.26667 |
Map of Luggate
Interactive Map
Luggate Population
Years 1975 to 2030
| Data | 1975 | 1990 | 2000 | 2015 | 2020 | 2025* | 2030* |
|---|---|---|---|---|---|---|---|
| Population | 176 | 278 | 396 | 648 | 532 | 618 | 685 |
| Population Density | 0.9 / km² | 1.4 / km² | 2 / km² | 3.2 / km² | 2.6 / km² | 3 / km² | 3.4 / km² |
Luggate Population change from 2000 to 2020
Increase of 34.3% from year 2000 to 2020
| Location | Change since 1975 | Change since 1990 | Change since 2000 |
|---|---|---|---|
| Luggate | +202.3% | +91.4% | +34.3% |
| Otago | — | — | — |
| New Zealand | — | — | — |
Luggate Median Age
Median Age: 36.5 years
| Location | Median Age | Median Age (Female) | Median Age (Male) |
|---|---|---|---|
| Luggate | 36.5 yrs | 36.6 yrs | 36.5 yrs |
| Otago | 38.8 yrs | 39.5 yrs | 38 yrs |
| New Zealand | 37.9 yrs | 38.9 yrs | 36.9 yrs |
Luggate Population Density
Population Density: 2.6 / km²
| Location | Population | Area | Density |
|---|---|---|---|
| Luggate | 532 | 203 km² | 2.6 / km² |
| Otago | 215,607 | 38,478.4 km² | 5.6 / km² |
| New Zealand | 4.4 million | 270,103.3 km² | 16.3 / km² |
Luggate Historical and Projected Population
Estimated Population from 1600 to 2100
- JRC (European Commission's Joint Research Centre) work on the GHS built-up grid
- CIESIN (Center for International Earth Science Information Network)
- [Link] Klein Goldewijk, K., Beusen, A., Doelman, J., and Stehfest, E.: Anthropogenic land use estimates for the Holocene – HYDE 3.2, Earth Syst. Sci. Data, 9, 927–953, https://doi.org/10.5194/essd-9-927-2017, 2017.
Area Codes
Percentage Area Codes used by businesses in Luggate
Postal Codes
Percentage of businesses by Postal Codes in Luggate
Human Development Index (HDI)
Statistic composite index of life expectancy, education, and per capita income.
Luggate Gross Domestic Product (GDP)
GDP per capita, PPP (constant 2017 international $)
| Data | 1990 | 1995 | 2000 | 2005 | 2010 | 2015 | 2020 | 2022 |
|---|---|---|---|---|---|---|---|---|
| GDP per capita | $13,677 | $18,193 | $19,608 | $26,081 | $30,546 | $27,008 | $21,497 | $27,308 |
| Total GDP | $2.6M | $4.1M | $5.1M | $8.3M | $11.8M | $12.3M | $11.4M | $15.4M |
Luggate CO2 Emissions
Carbon Dioxide (CO2) Emissions Per Capita in Tonnes Per Year
| Location | CO2 Emissions | CO2 Emissions Per Capita | CO2 Emissions Intensity |
|---|---|---|---|
| Luggate | 5,363 tn | 10.08 tn | 26.4 tons/km² |
| Otago | 1,696,568 tn | 7.87 tn | 44.1 tons/km² |
| New Zealand | 37,929,206 tn | 8.61 tn | 140.4 tons/km² |
| 2013 CO2 emissions (tonnes/year) | 5,363 tn |
| 2013 CO2 emissions (tonnes/year) per capita | 10.08 tn |
| 2013 CO2 emissions intensity (tonnes/km²/year) | 26.4 tons/km² |
Natural Hazards Risk
Relative risk out of 10
| Hazard | Risk Level |
|---|---|
| Earthquake | Medium (7) |
| Landslide | Medium (6) |
* Risk, particularly concerning flood or landslide, may not be for the entire area.
- Dilley, M., R.S. Chen, U. Deichmann, A.L. Lerner-Lam, M. Arnold, J. Agwe, P. Buys, O. Kjekstad, B. Lyon, and G. Yetman. 2005. Natural Disaster Hotspots: A Global Risk Analysis. Washington, D.C.: World Bank. https://doi.org/10.1596/0-8213-5930-4.
- Center for Hazards and Risk Research - CHRR - Columbia University, Center for International Earth Science Information Network - CIESIN - Columbia University, and Norwegian Geotechnical Institute - NGI. 2005. Global Landslide Hazard Distribution. Palisades, NY: NASA Socioeconomic Data and Applications Center (SEDAC). https://doi.org/10.7927/H4P848VZ.
- Center for Hazards and Risk Research - CHRR - Columbia University, Center for International Earth Science Information Network - CIESIN - Columbia University. 2005. Global Earthquake Hazard Distribution - Peak Ground Acceleration. Palisades, NY: NASA Socioeconomic Data and Applications Center (SEDAC). https://doi.org/10.7927/H4BZ63ZS.
Recent Nearby Earthquakes
Magnitude 3.0 and greater
| Date▼ | Time↕ | Magnitude↕ | Distance↕ | Depth↕ | Location↕ | Link |
|---|---|---|---|---|---|---|
| 7/1/17 | 11:21 PM | 4.1 | 28 km | 5,460 m | 34km SSE of Wanaka, New Zealand | usgs.gov |
| 1/30/17 | 1:53 PM | 4.9 | 82.4 km | 10,000 m | 72km NNW of Wanaka, New Zealand | usgs.gov |
| 4/28/16 | 9:44 AM | 3.9 | 88.6 km | 5,156 m | 70km NW of Arrowtown, New Zealand | usgs.gov |
| 3/28/16 | 3:12 AM | 4.1 | 63 km | 10,000 m | 52km NW of Wanaka, New Zealand | usgs.gov |
| 11/11/15 | 8:03 PM | 4.4 | 73.9 km | 19,720 m | 72km NNE of Wanaka, New Zealand | usgs.gov |
| 10/26/15 | 10:14 PM | 4.3 | 39.9 km | 3,000 m | 29km NW of Wanaka, New Zealand | usgs.gov |
| 7/6/15 | 5:45 AM | 5.1 | 53.1 km | 10,000 m | 56km NE of Wanaka, New Zealand | usgs.gov |
| 5/4/15 | 2:29 AM | 5.6 | 39.5 km | 10,000 m | 28km NW of Wanaka, New Zealand | usgs.gov |
| 8/3/14 | 10:09 AM | 4.2 | 50.2 km | 40,000 m | 52km NE of Wanaka, New Zealand | usgs.gov |
| 12/11/13 | 11:59 PM | 4.3 | 79.9 km | 6,563 m | 77km NNE of Wanaka, New Zealand | usgs.gov |
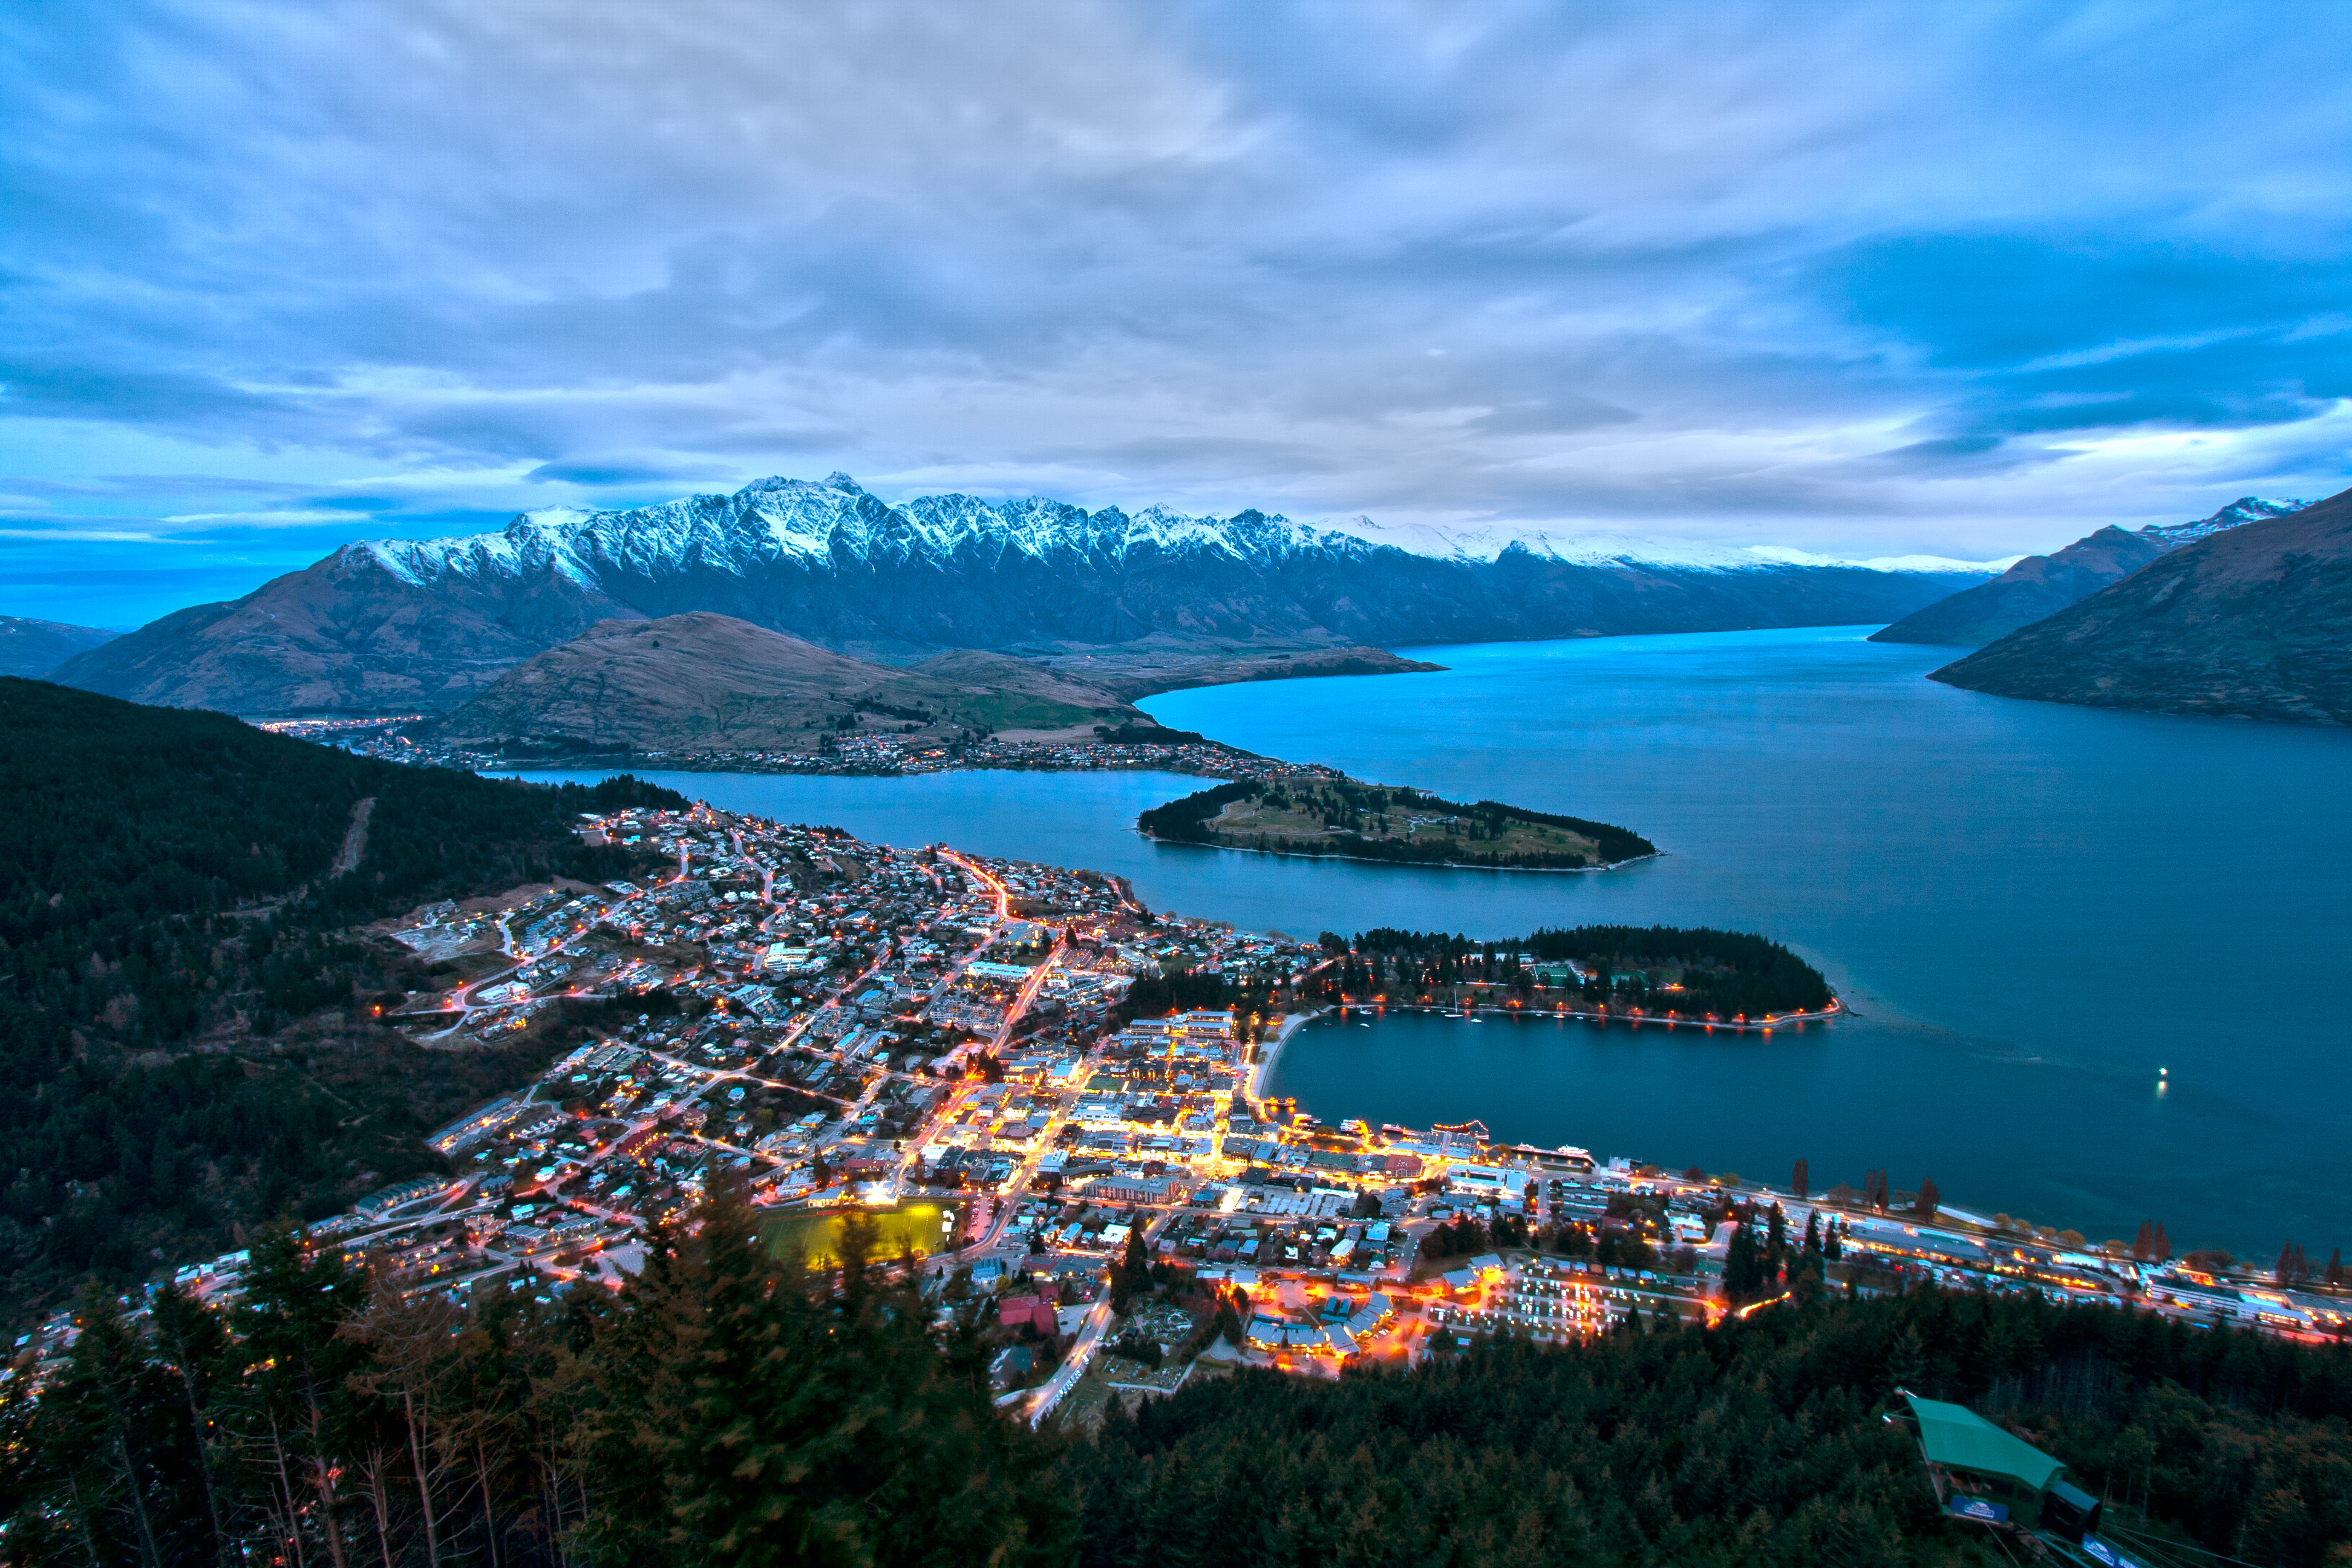
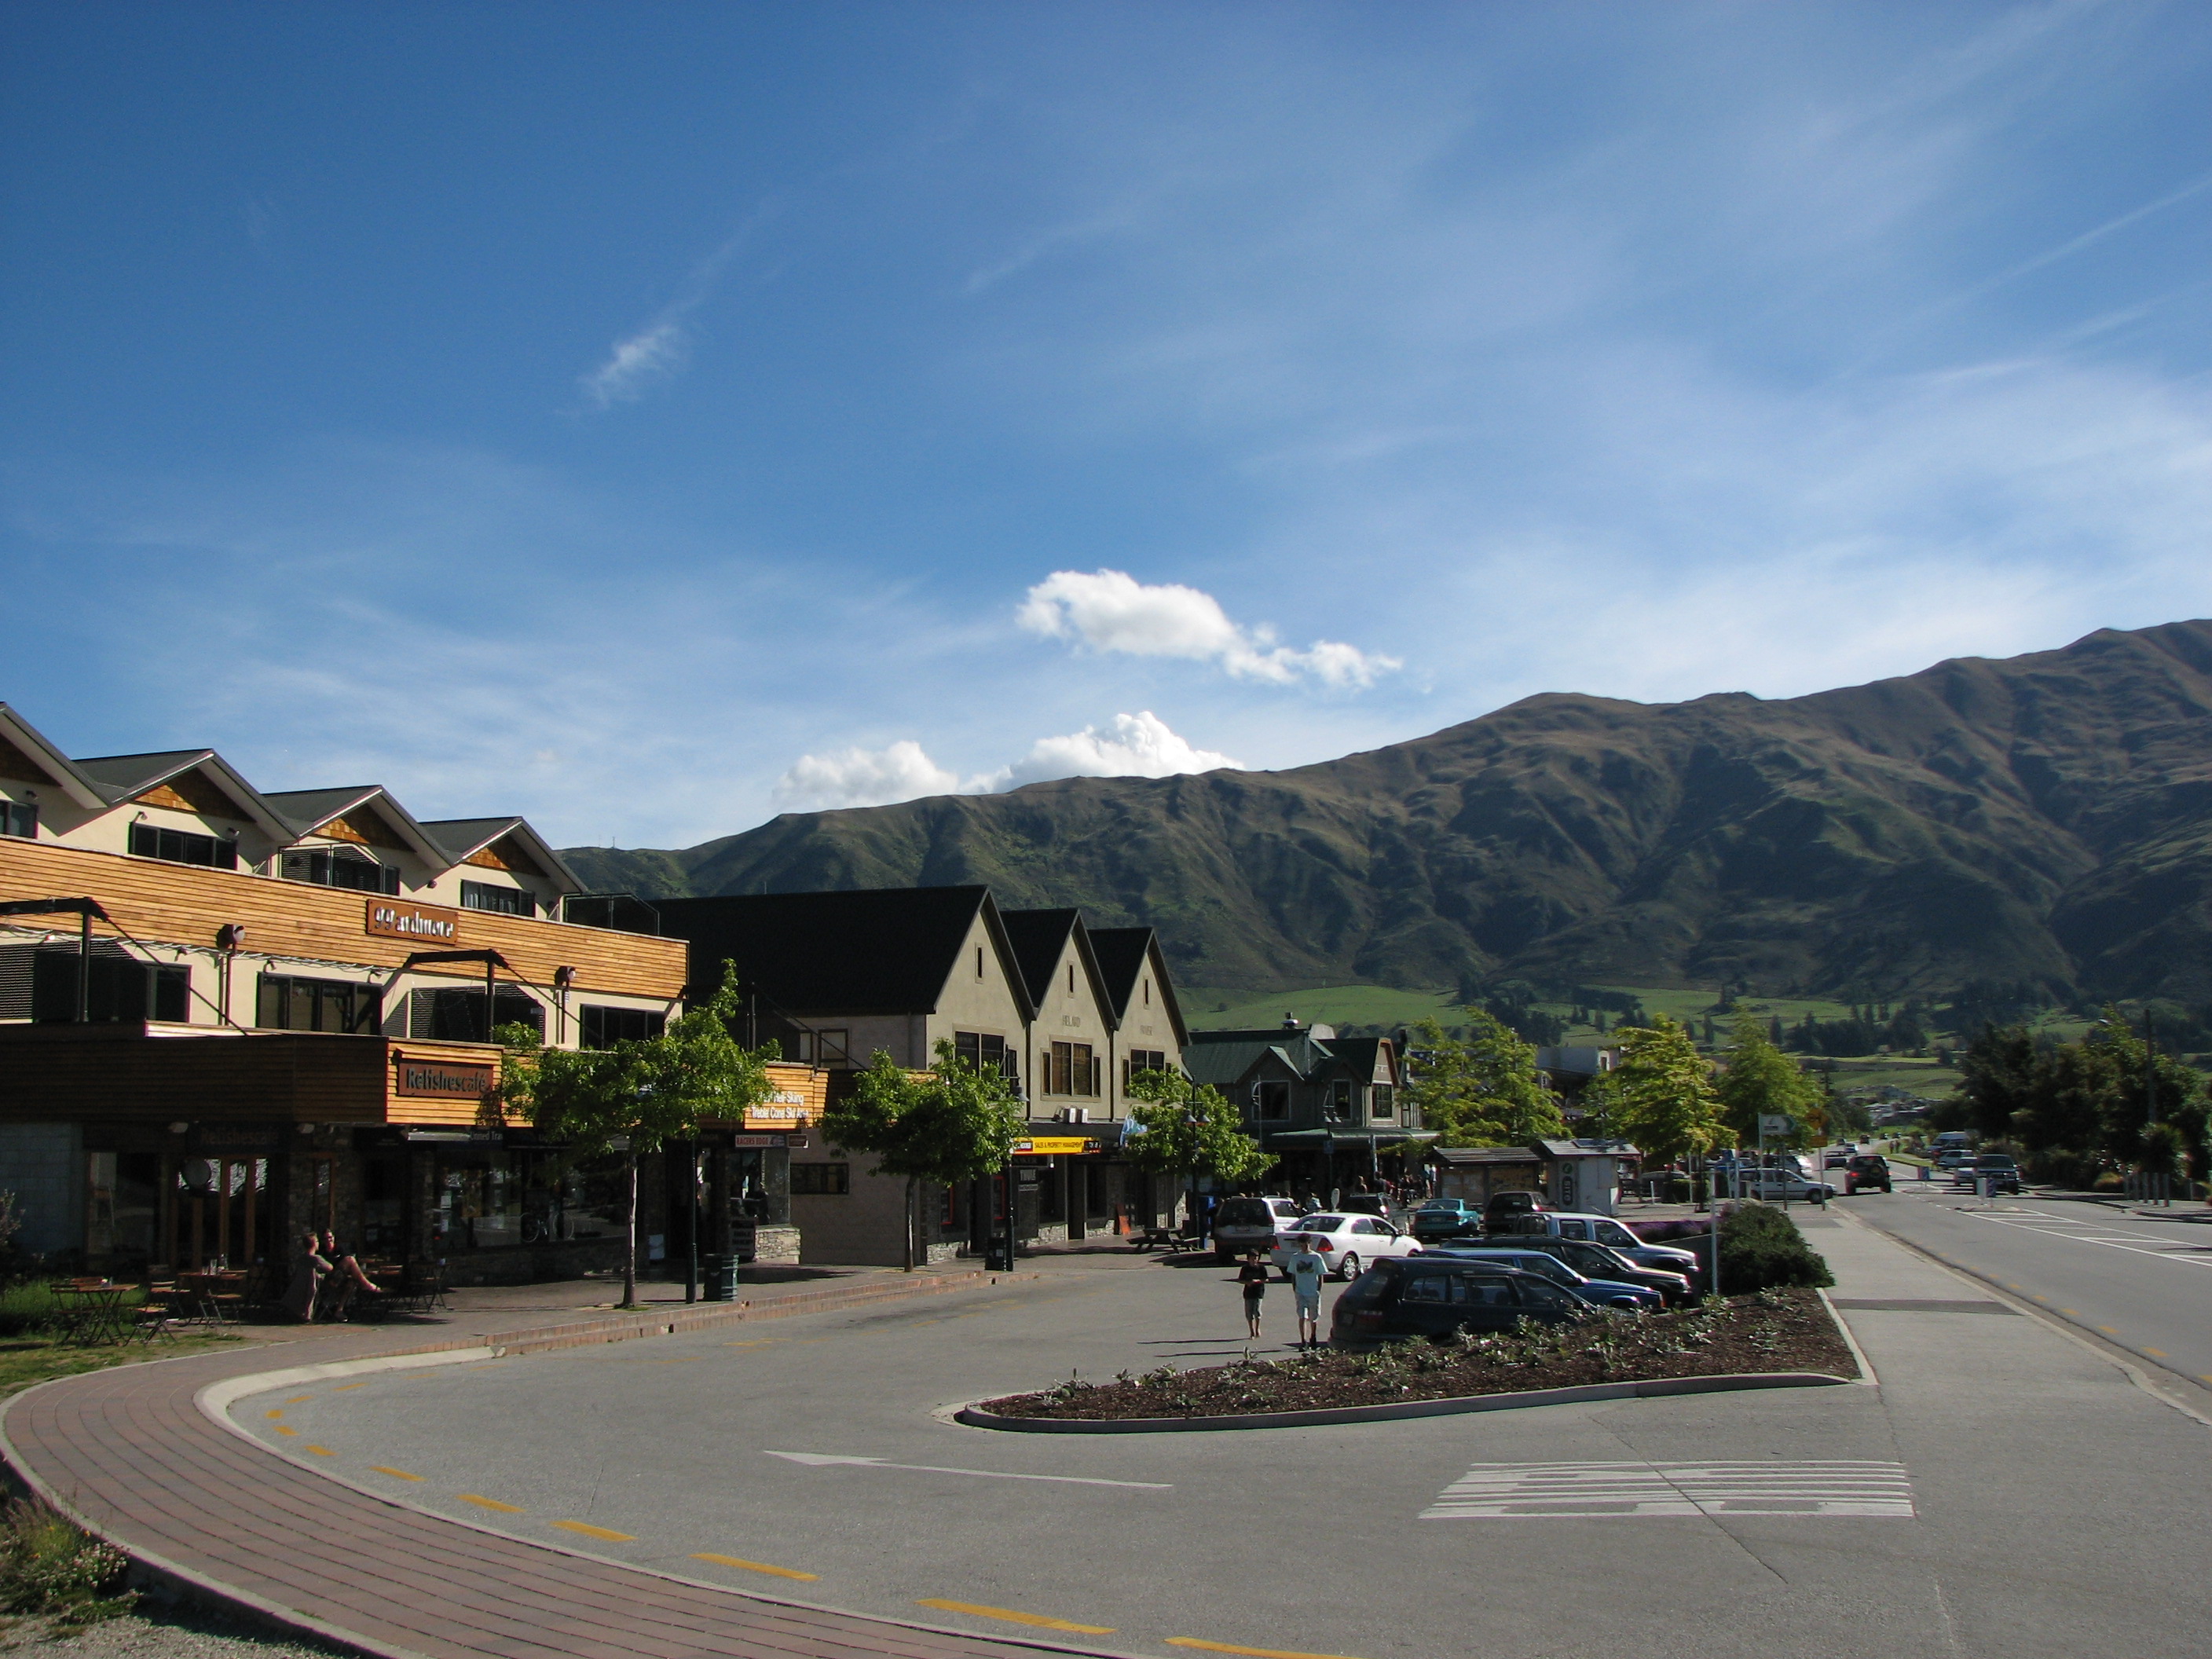
Luggate
Luggate is a small township in the South Island of New Zealand. It is located on State Highway 6 between Wanaka and Cromwell, near the junction with State Highway 8A, approximately 15 km from the Wanaka township, just past Wanaka Airport. Luggate 'G..
Luggate Wikipedia Page

About Our Data
The data on this page is estimated using a number of publicly available tools and resources. It is provided without warranty, and could contain inaccuracies. Use at your own risk.