Industries
Business Distribution by Industry in Ngatea
| Industry Description | Number of Establishments |
|---|---|
| Shopping | 10 |
| Sports clubs | 9 |
| Scientific and technical services | 7 |
| Corporate management | 7 |
| Restaurants | 7 |
| Car repair | 6 |
| Cafes | 5 |
| General contractors | 5 |
Ngatea Facts
| Area | 0.6 km² |
| Population | 1,341 |
| Male Population | 610 (45.5%) |
| Female Population | 731 (54.5%) |
| Population change (1975 to 2020) | +91.8% |
| Population change (2000 to 2020) | +83.2% |
| Median Age | 45.5 years (Male: 45.2, Female: 45.7) |
| GDP per capita (PPP) | $27,710 (2022) |
| Neighborhoods | Ngatea, RD 1, Pipiroa |
| Local Time | |
| Timezone | New Zealand Standard Time |
| Lat & Lng | -37.28333, 175.50000 |
| Postal Codes | 3503, 3541, 3597 |
Map of Ngatea
Interactive Map
Ngatea Population
Years 1975 to 2030
| Data | 1975 | 1990 | 2000 | 2015 | 2020 | 2025* | 2030* |
|---|---|---|---|---|---|---|---|
| Population | 699 | 708 | 732 | 768 | 1,341 | 1,357 | 1,360 |
| Population Density | 1,242.7 / km² | 1,258.7 / km² | 1,301.3 / km² | 1,365.3 / km² | 2,384 / km² | 2,412.4 / km² | 2,417.8 / km² |
Ngatea Population change from 2000 to 2020
Increase of 83.2% from year 2000 to 2020
| Location | Change since 1975 | Change since 1990 | Change since 2000 |
|---|---|---|---|
| Ngatea | +91.8% | +89.4% | +83.2% |
| Waikato | — | — | — |
| New Zealand | — | — | — |
Ngatea Median Age
Median Age: 45.5 years
| Location | Median Age | Median Age (Female) | Median Age (Male) |
|---|---|---|---|
| Ngatea | 45.5 yrs | 45.7 yrs | 45.2 yrs |
| Waikato | 38 yrs | 38.9 yrs | 37 yrs |
| New Zealand | 37.9 yrs | 38.9 yrs | 36.9 yrs |
Ngatea Population Density
Population Density: 2,384 / km²
| Location | Population | Area | Density |
|---|---|---|---|
| Ngatea | 1,341 | 0.563 km² | 2,384 / km² |
| Waikato | 431,484 | 34,877.4 km² | 12.4 / km² |
| New Zealand | 4.4 million | 270,103.3 km² | 16.3 / km² |
Ngatea Historical and Projected Population
Estimated Population from 1700 to 2100
- JRC (European Commission's Joint Research Centre) work on the GHS built-up grid
- CIESIN (Center for International Earth Science Information Network)
- [Link] Klein Goldewijk, K., Beusen, A., Doelman, J., and Stehfest, E.: Anthropogenic land use estimates for the Holocene – HYDE 3.2, Earth Syst. Sci. Data, 9, 927–953, https://doi.org/10.5194/essd-9-927-2017, 2017.
Area Codes
Percentage Area Codes used by businesses in Ngatea
Postal Codes
Percentage of businesses by Postal Codes in Ngatea
Price Distribution
Business distribution by price for Ngatea
Human Development Index (HDI)
Statistic composite index of life expectancy, education, and per capita income.
Ngatea Gross Domestic Product (GDP)
GDP per capita, PPP (constant 2017 international $)
| Data | 1990 | 1995 | 2000 | 2005 | 2010 | 2015 | 2020 | 2022 |
|---|---|---|---|---|---|---|---|---|
| GDP per capita | $19,061 | $19,560 | $21,964 | $24,906 | $27,327 | $29,656 | $26,494 | $27,710 |
| Total GDP | $30.6M | $31.9M | $35.9M | $42.1M | $47.4M | $51.7M | $45.6M | $47.9M |
Ngatea CO2 Emissions
Carbon Dioxide (CO2) Emissions Per Capita in Tonnes Per Year
| Location | CO2 Emissions | CO2 Emissions Per Capita | CO2 Emissions Intensity |
|---|---|---|---|
| Ngatea | 11,201 tn | 8.35 tn | 19,912.2 tons/km² |
| Waikato | 2,637,485 tn | 6.11 tn | 75.6 tons/km² |
| New Zealand | 37,929,206 tn | 8.61 tn | 140.4 tons/km² |
| 2013 CO2 emissions (tonnes/year) | 11,201 tn |
| 2013 CO2 emissions (tonnes/year) per capita | 8.35 tn |
| 2013 CO2 emissions intensity (tonnes/km²/year) | 19,912.2 tons/km² |
Natural Hazards Risk
Relative risk out of 10
| Hazard | Risk Level |
|---|---|
| Flood | High (9) |
| Earthquake | Medium (6) |
* Risk, particularly concerning flood or landslide, may not be for the entire area.
- Dilley, M., R.S. Chen, U. Deichmann, A.L. Lerner-Lam, M. Arnold, J. Agwe, P. Buys, O. Kjekstad, B. Lyon, and G. Yetman. 2005. Natural Disaster Hotspots: A Global Risk Analysis. Washington, D.C.: World Bank. https://doi.org/10.1596/0-8213-5930-4.
- Center for Hazards and Risk Research - CHRR - Columbia University, Center for International Earth Science Information Network - CIESIN - Columbia University. 2005. Global Flood Hazard Frequency and Distribution. Palisades, NY: NASA Socioeconomic Data and Applications Center (SEDAC). https://doi.org/10.7927/H4668B3D.
- Center for Hazards and Risk Research - CHRR - Columbia University, Center for International Earth Science Information Network - CIESIN - Columbia University. 2005. Global Earthquake Hazard Distribution - Peak Ground Acceleration. Palisades, NY: NASA Socioeconomic Data and Applications Center (SEDAC). https://doi.org/10.7927/H4BZ63ZS.
Recent Nearby Earthquakes
Magnitude 3.0 and greater
| Date▼ | Time↕ | Magnitude↕ | Distance↕ | Depth↕ | Location↕ | Link |
|---|---|---|---|---|---|---|
| 11/6/14 | 2:43 PM | 3.9 | 56.1 km | 6,000 m | 7km NW of Matamata, New Zealand | usgs.gov |
| 8/8/14 | 7:41 AM | 4.2 | 78.1 km | 289,000 m | 4km E of Tauranga, New Zealand | usgs.gov |
| 6/18/14 | 2:37 PM | 4.2 | 80.6 km | 314,630 m | 11km ENE of Tauranga, New Zealand | usgs.gov |
| 3/13/14 | 2:48 AM | 3.7 | 90.5 km | 311,610 m | 20km N of Tokoroa, New Zealand | usgs.gov |
| 4/16/13 | 8:37 AM | 4.1 | 71 km | 198,900 m | North Island of New Zealand | usgs.gov |
| 7/17/12 | 1:35 AM | 4.6 | 83.3 km | 310,900 m | North Island of New Zealand | usgs.gov |
| 5/4/12 | 10:20 PM | 4.2 | 61.6 km | 286,300 m | North Island of New Zealand | usgs.gov |
| 4/6/12 | 1:52 AM | 4.6 | 86.9 km | 207,900 m | North Island of New Zealand | usgs.gov |
| 12/27/11 | 5:32 PM | 4.4 | 73.2 km | 271,600 m | North Island of New Zealand | usgs.gov |
| 12/15/11 | 1:55 AM | 4.3 | 51.3 km | 248,200 m | North Island of New Zealand | usgs.gov |
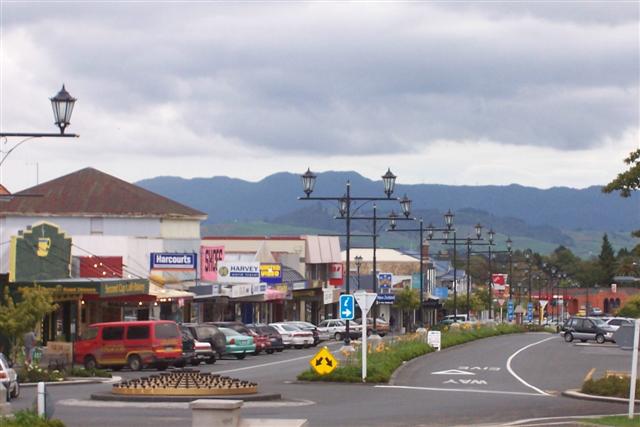
Ngatea
Ngatea is a small town on the Hauraki Plains in the North Island of New Zealand. It is located 18 kilometres southwest of Thames and 70 kilometres southeast of Auckland. Ngatea lies on the Piako River, eight kilometres south of its outflow into the F..
Ngatea Wikipedia Page

About Our Data
The data on this page is estimated using a number of publicly available tools and resources. It is provided without warranty, and could contain inaccuracies. Use at your own risk.