Categories in Nuhaka
Industries
Business Distribution by Industry in Nuhaka
| Industry Description | Number of Establishments |
|---|---|
| Other accommodation | 14 |
Nuhaka Facts
| Area | 287.1 km² |
| Population | 472 |
| Male Population | 250 (53.1%) |
| Female Population | 222 (46.9%) |
| Population change (1975 to 2020) | -22.0% |
| Population change (2000 to 2020) | -6.0% |
| Median Age | 38.7 years (Male: 38.9, Female: 38.4) |
| Neighborhoods | Nuhaka |
| Local Time | |
| Timezone | New Zealand Standard Time |
| Lat & Lng | -39.05000, 177.75000 |
| Postal Codes | 4165, 4198 |
Map of Nuhaka
Interactive Map
Nuhaka Population
Years 1975 to 2020
| Data | 1975 | 1990 | 2000 | 2015 | 2020 |
|---|---|---|---|---|---|
| Population | 605 | 528 | 502 | 453 | 472 |
| Population Density | 2.1 / km² | 1.8 / km² | 1.7 / km² | 1.6 / km² | 1.6 / km² |
Nuhaka Population change from 2000 to 2015
Decrease of 9.8% from year 2000 to 2015
| Location | Change since 1975 | Change since 1990 | Change since 2000 |
|---|---|---|---|
| Nuhaka | -25.1% | -14.2% | -9.8% |
| New Zealand | +47.1% | +33.3% | +17.4% |
Nuhaka Median Age
Median Age: 38.7 years
| Location | Median Age | Median Age (Female) | Median Age (Male) |
|---|---|---|---|
| Nuhaka | 38.7 yrs | 38.4 yrs | 38.9 yrs |
| New Zealand | 37.9 yrs | 38.9 yrs | 36.9 yrs |
Nuhaka Population Density
Population Density: 1.6 / km²
| Location | Population | Area | Density |
|---|---|---|---|
| Nuhaka | 472 | 287.1 km² | 1.6 / km² |
| New Zealand | 4.4 million | 270,103.3 km² | 16.3 / km² |
Nuhaka Historical and Projected Population
Estimated Population from 1200 to 2100
- JRC (European Commission's Joint Research Centre) work on the GHS built-up grid
- CIESIN (Center for International Earth Science Information Network)
- [Link] Klein Goldewijk, K., Beusen, A., Doelman, J., and Stehfest, E.: Anthropogenic land use estimates for the Holocene – HYDE 3.2, Earth Syst. Sci. Data, 9, 927–953, https://doi.org/10.5194/essd-9-927-2017, 2017.
Human Development Index (HDI)
Statistic composite index of life expectancy, education, and per capita income.
Nuhaka CO2 Emissions
Carbon Dioxide (CO2) Emissions Per Capita in Tonnes Per Year
| Location | CO2 Emissions | CO2 Emissions Per Capita | CO2 Emissions Intensity |
|---|---|---|---|
| Nuhaka | 3,750 tn | 7.95 tn | 13.1 tons/km² |
| New Zealand | 37,929,206 tn | 8.61 tn | 140.4 tons/km² |
| 2013 CO2 emissions (tonnes/year) | 3,750 tn |
| 2013 CO2 emissions (tonnes/year) per capita | 7.95 tn |
| 2013 CO2 emissions intensity (tonnes/km²/year) | 13.1 tons/km² |
Natural Hazards Risk
Relative risk out of 10
| Hazard | Risk Level |
|---|---|
| Flood | Medium (4) |
| Earthquake | High (9.1) |
| Landslide | High (9) |
* Risk, particularly concerning flood or landslide, may not be for the entire area.
- Dilley, M., R.S. Chen, U. Deichmann, A.L. Lerner-Lam, M. Arnold, J. Agwe, P. Buys, O. Kjekstad, B. Lyon, and G. Yetman. 2005. Natural Disaster Hotspots: A Global Risk Analysis. Washington, D.C.: World Bank. https://doi.org/10.1596/0-8213-5930-4.
- Center for Hazards and Risk Research - CHRR - Columbia University, Center for International Earth Science Information Network - CIESIN - Columbia University, and Norwegian Geotechnical Institute - NGI. 2005. Global Landslide Hazard Distribution. Palisades, NY: NASA Socioeconomic Data and Applications Center (SEDAC). https://doi.org/10.7927/H4P848VZ.
- Center for Hazards and Risk Research - CHRR - Columbia University, Center for International Earth Science Information Network - CIESIN - Columbia University. 2005. Global Flood Hazard Frequency and Distribution. Palisades, NY: NASA Socioeconomic Data and Applications Center (SEDAC). https://doi.org/10.7927/H4668B3D.
- Center for Hazards and Risk Research - CHRR - Columbia University, Center for International Earth Science Information Network - CIESIN - Columbia University. 2005. Global Earthquake Hazard Distribution - Peak Ground Acceleration. Palisades, NY: NASA Socioeconomic Data and Applications Center (SEDAC). https://doi.org/10.7927/H4BZ63ZS.
Recent Nearby Earthquakes
Magnitude 3.0 and greater
| Date▼ | Time↕ | Magnitude↕ | Distance↕ | Depth↕ | Location↕ | Link |
|---|---|---|---|---|---|---|
| 4/3/19 | 1:42 AM | 4.2 | 34.3 km | 10,000 m | 64km ESE of Wairoa, New Zealand | usgs.gov |
| 2/4/18 | 6:15 PM | 4.7 | 6.6 km | 39,560 m | 27km E of Wairoa, New Zealand | usgs.gov |
| 11/5/17 | 1:49 PM | 4.2 | 34.9 km | 17,240 m | 41km SSE of Wairoa, New Zealand | usgs.gov |
| 4/19/17 | 3:08 AM | 5 | 41.2 km | 28,870 m | 8km SW of Gisborne, New Zealand | usgs.gov |
| 3/17/17 | 8:21 PM | 4.2 | 11.8 km | 19,400 m | 22km E of Wairoa, New Zealand | usgs.gov |
| 1/2/17 | 12:21 PM | 4.4 | 20.6 km | 62,420 m | 21km ENE of Wairoa, New Zealand | usgs.gov |
| 12/3/16 | 9:19 PM | 4.6 | 29.6 km | 15,510 m | 26km NE of Wairoa, New Zealand | usgs.gov |
| 11/26/16 | 7:21 AM | 5 | 21.6 km | 18,550 m | 27km NE of Wairoa, New Zealand | usgs.gov |
| 12/20/15 | 10:02 AM | 4.5 | 36.2 km | 26,440 m | 30km SSE of Wairoa, New Zealand | usgs.gov |
| 2/5/15 | 11:02 PM | 4.3 | 33.1 km | 4,920 m | 18km S of Gisborne, New Zealand | usgs.gov |
Nuhaka
Nuhaka is a small settlement in the northern Hawke's Bay Region of New Zealand's eastern North Island, lying on State Highway 2 between Wairoa and Gisborne. is the tribal centre of the Ngāti Rakaipaaka people, a Māori subtribe of Ngāti Kahungunu. Th..
Nuhaka Wikipedia Page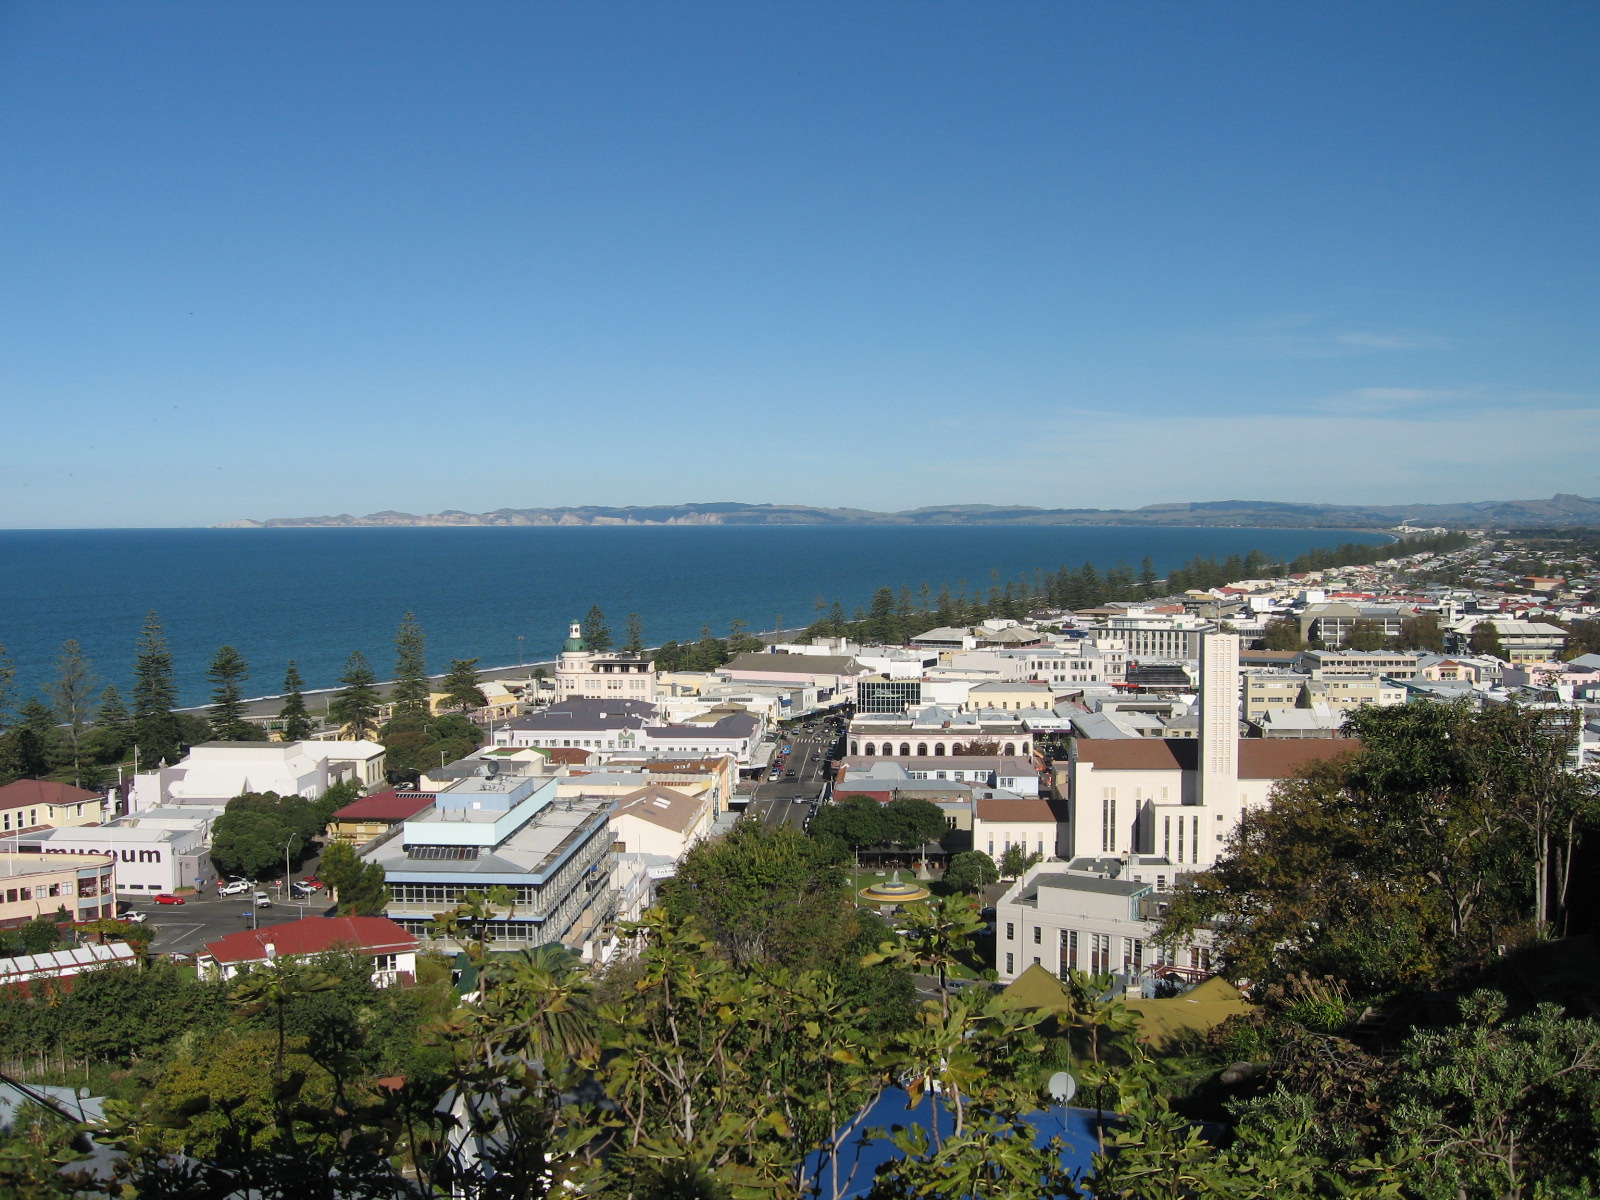


About Our Data
The data on this page is estimated using a number of publicly available tools and resources. It is provided without warranty, and could contain inaccuracies. Use at your own risk.