Opoho Facts
| Area | 1.1 km² |
| Population | 1 |
| Population change (1975 to 2020) | -99.5% |
| Population change (2000 to 2020) | -99.6% |
| Local Time | |
| Timezone | New Zealand Standard Time |
| Lat & Lng | -45.84838, 170.52010 |
| Postal Codes | 9041 |
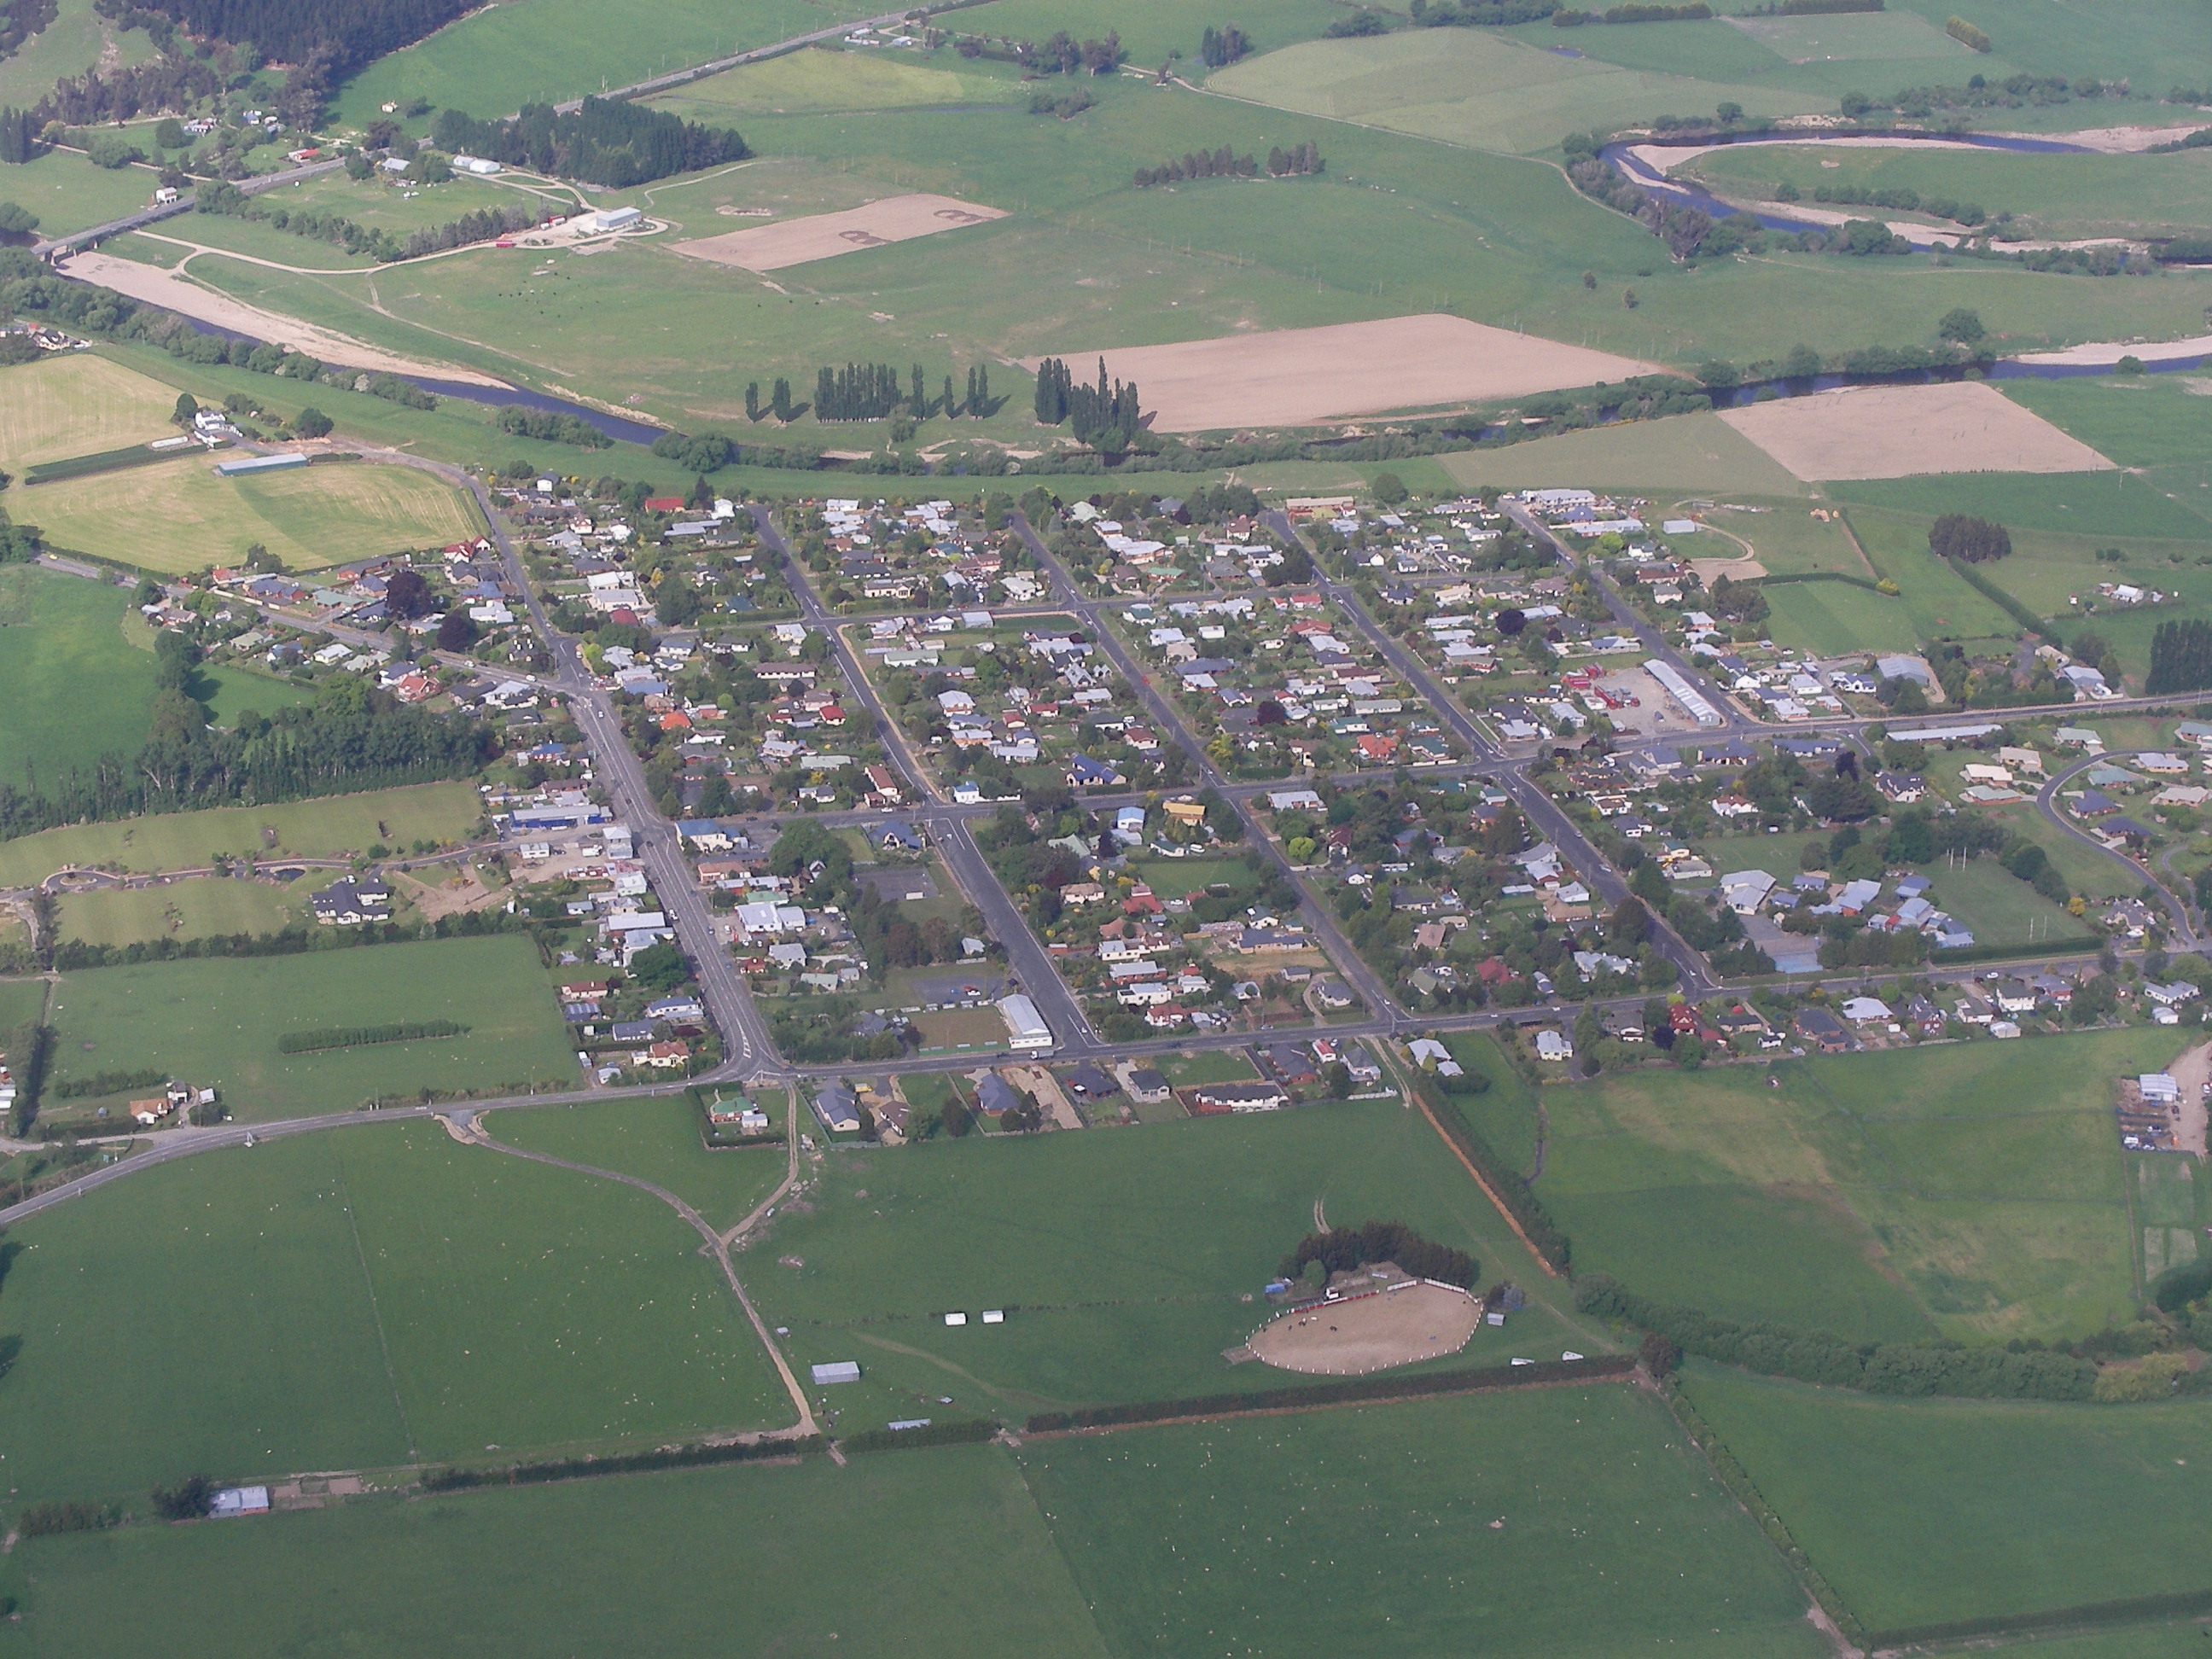
Map of Opoho
Interactive Map
Opoho Population
Years 1975 to 2030
| Data | 1975 | 1990 | 2000 | 2015 | 2020 | 2025* | 2030* |
|---|---|---|---|---|---|---|---|
| Population | 199 | 209 | 224 | 242 | 1 | 1 | 1 |
| Population Density | 187.3 / km² | 196.7 / km² | 210.8 / km² | 227.8 / km² | 0.9 / km² | 0.9 / km² | 0.9 / km² |
Opoho Population change from 2000 to 2020
Decrease of 99.6% from year 2000 to 2020
| Location | Change since 1975 | Change since 1990 | Change since 2000 |
|---|---|---|---|
| Opoho | -99.5% | -99.5% | -99.6% |
| Otago | — | — | — |
| New Zealand | — | — | — |
Opoho Population Density
Population Density: 0.9 / km²
| Location | Population | Area | Density |
|---|---|---|---|
| Opoho | 1 | 1.063 km² | 0.9 / km² |
| Otago | 215,607 | 38,478.4 km² | 5.6 / km² |
| New Zealand | 4.4 million | 270,103.3 km² | 16.3 / km² |
Opoho Historical and Projected Population
Estimated Population from 0 to 2100
- JRC (European Commission's Joint Research Centre) work on the GHS built-up grid
- CIESIN (Center for International Earth Science Information Network)
- [Link] Klein Goldewijk, K., Beusen, A., Doelman, J., and Stehfest, E.: Anthropogenic land use estimates for the Holocene – HYDE 3.2, Earth Syst. Sci. Data, 9, 927–953, https://doi.org/10.5194/essd-9-927-2017, 2017.
Human Development Index (HDI)
Statistic composite index of life expectancy, education, and per capita income.
Opoho CO2 Emissions
Carbon Dioxide (CO2) Emissions Per Capita in Tonnes Per Year
| Location | CO2 Emissions | CO2 Emissions Per Capita | CO2 Emissions Intensity |
|---|---|---|---|
| Opoho | 9 tn | 8.93 tn | 8.4 tons/km² |
| Otago | 1,696,568 tn | 7.87 tn | 44.1 tons/km² |
| New Zealand | 37,929,206 tn | 8.61 tn | 140.4 tons/km² |
| 2013 CO2 emissions (tonnes/year) | 9 tn |
| 2013 CO2 emissions (tonnes/year) per capita | 8.93 tn |
| 2013 CO2 emissions intensity (tonnes/km²/year) | 8.4 tons/km² |
Natural Hazards Risk
Relative risk out of 10
| Hazard | Risk Level |
|---|---|
| Earthquake | Medium (7) |
| Landslide | Medium (7) |
* Risk, particularly concerning flood or landslide, may not be for the entire area.
- Dilley, M., R.S. Chen, U. Deichmann, A.L. Lerner-Lam, M. Arnold, J. Agwe, P. Buys, O. Kjekstad, B. Lyon, and G. Yetman. 2005. Natural Disaster Hotspots: A Global Risk Analysis. Washington, D.C.: World Bank. https://doi.org/10.1596/0-8213-5930-4.
- Center for Hazards and Risk Research - CHRR - Columbia University, Center for International Earth Science Information Network - CIESIN - Columbia University, and Norwegian Geotechnical Institute - NGI. 2005. Global Landslide Hazard Distribution. Palisades, NY: NASA Socioeconomic Data and Applications Center (SEDAC). https://doi.org/10.7927/H4P848VZ.
- Center for Hazards and Risk Research - CHRR - Columbia University, Center for International Earth Science Information Network - CIESIN - Columbia University. 2005. Global Earthquake Hazard Distribution - Peak Ground Acceleration. Palisades, NY: NASA Socioeconomic Data and Applications Center (SEDAC). https://doi.org/10.7927/H4BZ63ZS.
Recent Nearby Earthquakes
Magnitude 3.0 and greater
| Date▼ | Time↕ | Magnitude↕ | Distance↕ | Depth↕ | Location↕ | Link |
|---|---|---|---|---|---|---|
| 6/1/15 | 11:18 AM | 4.3 | 33.5 km | 8,990 m | 33km WNW of Dunedin, New Zealand | usgs.gov |
| 10/16/14 | 5:44 AM | 4.1 | 30.1 km | 4,000 m | 29km WNW of Dunedin, New Zealand | usgs.gov |
| 12/17/07 | 9:05 AM | 4.2 | 41 km | 12,000 m | off the east coast of the South Island of New Zealand | usgs.gov |
| 2/24/06 | 11:03 PM | 3.7 | 52 km | 12,000 m | off the east coast of the South Island of New Zealand | usgs.gov |
| 12/24/04 | 8:44 AM | 3.9 | 78.5 km | 12,000 m | South Island of New Zealand | usgs.gov |
| 2/11/04 | 12:31 AM | 4.5 | 74.5 km | 12,000 m | South Island of New Zealand | usgs.gov |
| 6/30/03 | 4:23 PM | 3.8 | 79 km | 21,000 m | South Island of New Zealand | usgs.gov |
| 10/21/00 | 1:57 PM | 4 | 91.8 km | 12,000 m | off the east coast of the South Island of New Zealand | usgs.gov |
| 2/8/98 | 6:26 PM | 4.8 | 97.3 km | 10,000 m | South Island of New Zealand | usgs.gov |
| 5/3/94 | 7:29 AM | 3.8 | 27.8 km | 33,000 m | off the east coast of the South Island of New Zealand | usgs.gov |
Opoho
Opoho is a suburb of the New Zealand city of Dunedin. It sits on the western flank of Signal Hill, New Zealand, 3 kilometres (1.9 mi) to the northeast of the city centre, overlooking North East Valley and the Dunedin Botanic Gardens. is one of Duned..
Opoho Wikipedia Page


About Our Data
The data on this page is estimated using a number of publicly available tools and resources. It is provided without warranty, and could contain inaccuracies. Use at your own risk.