Categories in Owaka
Industries
Business Distribution by Industry in Owaka
| Industry Description | Number of Establishments | Average Google Rating |
|---|---|---|
| Other accommodation | 16 | 4.4 |
| Hotels and motels | 11 | 4.4 |
| Shopping | 7 | 4.4 |
Owaka Facts
| Area | 0.2 km² |
| Population | 71 |
| Male Population | 35 (49.0%) |
| Female Population | 36 (51.0%) |
| Population change (1975 to 2020) | +24.6% |
| Population change (2000 to 2020) | +10.9% |
| Median Age | 41.6 years (Male: 41.2, Female: 42) |
| Neighborhoods | Rd 2, Owaka, New Haven, Papatowai |
| Local Time | |
| Timezone | New Zealand Standard Time |
| Lat & Lng | -46.45000, 169.66667 |
| Postal Codes | 9535, 9546 |
Map of Owaka
Interactive Map
Owaka Population
Years 1975 to 2020
| Data | 1975 | 1990 | 2000 | 2015 | 2020 |
|---|---|---|---|---|---|
| Population | 57 | 58 | 64 | 67 | 71 |
| Population Density | 304 / km² | 309.3 / km² | 341.3 / km² | 357.3 / km² | 378.7 / km² |
Owaka Population change from 2000 to 2015
Increase of 4.7% from year 2000 to 2015
| Location | Change since 1975 | Change since 1990 | Change since 2000 |
|---|---|---|---|
| Owaka | +17.5% | +15.5% | +4.7% |
| Otago | +36.4% | +28.9% | +15.3% |
| New Zealand | +47.1% | +33.3% | +17.4% |
Owaka Median Age
Median Age: 41.6 years
| Location | Median Age | Median Age (Female) | Median Age (Male) |
|---|---|---|---|
| Owaka | 41.6 yrs | 42 yrs | 41.2 yrs |
| Otago | 38.8 yrs | 39.5 yrs | 38 yrs |
| New Zealand | 37.9 yrs | 38.9 yrs | 36.9 yrs |
Owaka Population Density
Population Density: 379 / km²
| Location | Population | Area | Density |
|---|---|---|---|
| Owaka | 71 | 0.188 km² | 379 / km² |
| Otago | 215,607 | 38,478.4 km² | 5.6 / km² |
| New Zealand | 4.4 million | 270,103.3 km² | 16.3 / km² |
Owaka Historical and Projected Population
Estimated Population from 1200 to 2100
- JRC (European Commission's Joint Research Centre) work on the GHS built-up grid
- CIESIN (Center for International Earth Science Information Network)
- [Link] Klein Goldewijk, K., Beusen, A., Doelman, J., and Stehfest, E.: Anthropogenic land use estimates for the Holocene – HYDE 3.2, Earth Syst. Sci. Data, 9, 927–953, https://doi.org/10.5194/essd-9-927-2017, 2017.
Postal Codes
Percentage of businesses by Postal Codes in Owaka
Price Distribution
Business distribution by price for Owaka
Human Development Index (HDI)
Statistic composite index of life expectancy, education, and per capita income.
Owaka CO2 Emissions
Carbon Dioxide (CO2) Emissions Per Capita in Tonnes Per Year
| Location | CO2 Emissions | CO2 Emissions Per Capita | CO2 Emissions Intensity |
|---|---|---|---|
| Owaka | 630 tn | 8.87 tn | 3,358.6 tons/km² |
| Otago | 1,696,568 tn | 7.87 tn | 44.1 tons/km² |
| New Zealand | 37,929,206 tn | 8.61 tn | 140.4 tons/km² |
| 2013 CO2 emissions (tonnes/year) | 630 tn |
| 2013 CO2 emissions (tonnes/year) per capita | 8.87 tn |
| 2013 CO2 emissions intensity (tonnes/km²/year) | 3,358.6 tons/km² |
Natural Hazards Risk
Relative risk out of 10
| Hazard | Risk Level |
|---|---|
| Earthquake | Medium (7) |
| Landslide | Medium (6) |
* Risk, particularly concerning flood or landslide, may not be for the entire area.
- Dilley, M., R.S. Chen, U. Deichmann, A.L. Lerner-Lam, M. Arnold, J. Agwe, P. Buys, O. Kjekstad, B. Lyon, and G. Yetman. 2005. Natural Disaster Hotspots: A Global Risk Analysis. Washington, D.C.: World Bank. https://doi.org/10.1596/0-8213-5930-4.
- Center for Hazards and Risk Research - CHRR - Columbia University, Center for International Earth Science Information Network - CIESIN - Columbia University, and Norwegian Geotechnical Institute - NGI. 2005. Global Landslide Hazard Distribution. Palisades, NY: NASA Socioeconomic Data and Applications Center (SEDAC). https://doi.org/10.7927/H4P848VZ.
- Center for Hazards and Risk Research - CHRR - Columbia University, Center for International Earth Science Information Network - CIESIN - Columbia University. 2005. Global Earthquake Hazard Distribution - Peak Ground Acceleration. Palisades, NY: NASA Socioeconomic Data and Applications Center (SEDAC). https://doi.org/10.7927/H4BZ63ZS.
Recent Nearby Earthquakes
Magnitude 3.0 and greater
| Date▼ | Time↕ | Magnitude↕ | Distance↕ | Depth↕ | Location↕ | Link |
|---|---|---|---|---|---|---|
| 6/1/15 | 11:18 AM | 4.3 | 87.5 km | 8,990 m | 33km WNW of Dunedin, New Zealand | usgs.gov |
| 10/16/14 | 5:44 AM | 4.1 | 84.3 km | 4,000 m | 29km WNW of Dunedin, New Zealand | usgs.gov |
| 2/6/11 | 12:52 AM | 4.1 | 21.1 km | 12,000 m | South Island of New Zealand | usgs.gov |
| 12/17/07 | 9:05 AM | 4.2 | 91.2 km | 12,000 m | off the east coast of the South Island of New Zealand | usgs.gov |
| 9/26/07 | 12:31 AM | 3.9 | 59.1 km | 12,000 m | South Island of New Zealand | usgs.gov |
| 5/10/04 | 11:19 AM | 3.7 | 32.2 km | 13,000 m | South Island of New Zealand | usgs.gov |
| 10/12/00 | 8:40 AM | 4.5 | 12.5 km | 31,000 m | South Island of New Zealand | usgs.gov |
| 5/3/94 | 7:29 AM | 3.8 | 72.8 km | 33,000 m | off the east coast of the South Island of New Zealand | usgs.gov |
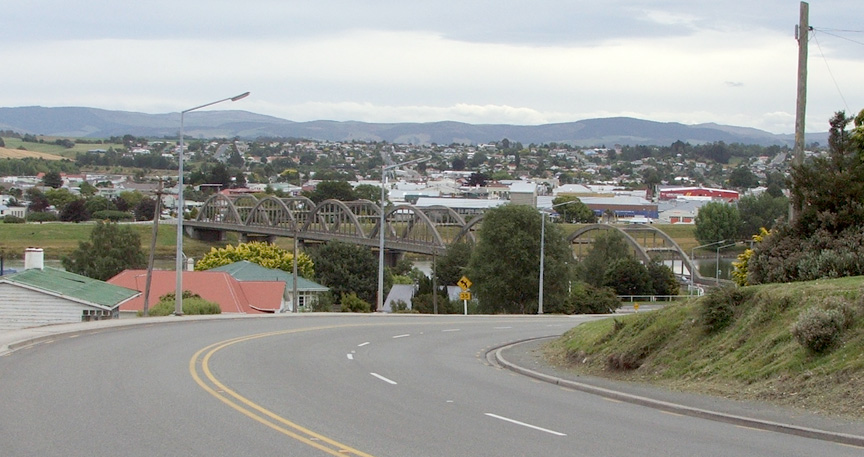
Owaka
Owaka is a small town in the Clutha District of South Otago, in the South Island of New Zealand. It is the largest community in the rugged, forested Catlins area, close to the border with Southland, some 35 km (22 mi) south of Balclutha on the Southe..
Owaka Wikipedia Page

About Our Data
The data on this page is estimated using a number of publicly available tools and resources. It is provided without warranty, and could contain inaccuracies. Use at your own risk.