La Mesa District Facts
| Area | 138.7 km² |
| Population | 4,995 |
| Male Population | 2,661 (53.3%) |
| Female Population | 2,334 (46.7%) |
| Population change (1975 to 2020) | +85.9% |
| Population change (2000 to 2020) | +30.8% |
| Median Age | 30.1 years (Male: 31.6, Female: 28.6) |
| Local Time | |
| Timezone | Eastern Standard Time |
| Lat & Lng | 8.14707, -81.18114 |
Map of La Mesa District
Interactive Map
La Mesa District Population
Years 1975 to 2020
| Data | 1975 | 1990 | 2000 | 2015 | 2020 |
|---|---|---|---|---|---|
| Population | 2,687 | 3,200 | 3,818 | 4,658 | 4,995 |
| Population Density | 19.4 / km² | 23.1 / km² | 27.5 / km² | 33.6 / km² | 36 / km² |
La Mesa District Population change from 2000 to 2015
Increase of 22% from year 2000 to 2015
| Location | Change since 1975 | Change since 1990 | Change since 2000 |
|---|---|---|---|
| La Mesa District | +73.4% | +45.6% | +22% |
| Veraguas Province | +55.2% | +25.1% | +11.8% |
| Panama | +124.3% | +58.5% | +29.2% |
La Mesa District Median Age
Median Age: 30.1 years
| Location | Median Age | Median Age (Female) | Median Age (Male) |
|---|---|---|---|
| La Mesa District | 30.1 yrs | 28.6 yrs | 31.6 yrs |
| Veraguas Province | 27.6 yrs | 27.2 yrs | 28 yrs |
| Panama | 27.4 yrs | 27.7 yrs | 27.1 yrs |
La Mesa District Population Density
Population Density: 36 / km²
| Location | Population | Area | Density |
|---|---|---|---|
| La Mesa District | 4,995 | 138.7 km² | 36 / km² |
| Veraguas Province | 238,132 | 10,675.2 km² | 22.3 / km² |
| Panama | 3.8 million | 75,430.4 km² | 50.9 / km² |
La Mesa District Historical and Projected Population
Estimated Population from 0 to 2100
- JRC (European Commission's Joint Research Centre) work on the GHS built-up grid
- CIESIN (Center for International Earth Science Information Network)
- [Link] Klein Goldewijk, K., Beusen, A., Doelman, J., and Stehfest, E.: Anthropogenic land use estimates for the Holocene – HYDE 3.2, Earth Syst. Sci. Data, 9, 927–953, https://doi.org/10.5194/essd-9-927-2017, 2017.
Human Development Index (HDI)
Statistic composite index of life expectancy, education, and per capita income.
La Mesa District CO2 Emissions
Carbon Dioxide (CO2) Emissions Per Capita in Tonnes Per Year
| Location | CO2 Emissions | CO2 Emissions Per Capita | CO2 Emissions Intensity |
|---|---|---|---|
| La Mesa District | 18,098 tn | 3.62 tn | 130.5 tons/km² |
| Veraguas Province | 858,602 tn | 3.61 tn | 80.4 tons/km² |
| Panama | 14,498,748 tn | 3.78 tn | 192.2 tons/km² |
| 2013 CO2 emissions (tonnes/year) | 18,098 tn |
| 2013 CO2 emissions (tonnes/year) per capita | 3.62 tn |
| 2013 CO2 emissions intensity (tonnes/km²/year) | 130.5 tons/km² |
Natural Hazards Risk
Relative risk out of 10
| Hazard | Risk Level |
|---|---|
| Earthquake | Medium (6) |
| Landslide | Medium (7) |
* Risk, particularly concerning flood or landslide, may not be for the entire area.
- Dilley, M., R.S. Chen, U. Deichmann, A.L. Lerner-Lam, M. Arnold, J. Agwe, P. Buys, O. Kjekstad, B. Lyon, and G. Yetman. 2005. Natural Disaster Hotspots: A Global Risk Analysis. Washington, D.C.: World Bank. https://doi.org/10.1596/0-8213-5930-4.
- Center for Hazards and Risk Research - CHRR - Columbia University, Center for International Earth Science Information Network - CIESIN - Columbia University, and Norwegian Geotechnical Institute - NGI. 2005. Global Landslide Hazard Distribution. Palisades, NY: NASA Socioeconomic Data and Applications Center (SEDAC). https://doi.org/10.7927/H4P848VZ.
- Center for Hazards and Risk Research - CHRR - Columbia University, Center for International Earth Science Information Network - CIESIN - Columbia University. 2005. Global Earthquake Hazard Distribution - Peak Ground Acceleration. Palisades, NY: NASA Socioeconomic Data and Applications Center (SEDAC). https://doi.org/10.7927/H4BZ63ZS.
Recent Nearby Earthquakes
Magnitude 3.0 and greater
| Date▼ | Time↕ | Magnitude↕ | Distance↕ | Depth↕ | Location↕ | Link |
|---|---|---|---|---|---|---|
| 6/23/19 | 3:42 PM | 4.6 | 90.2 km | 5,490 m | 72km S of Rio de Jesus, Panama | usgs.gov |
| 12/14/17 | 1:11 AM | 4.8 | 95.4 km | 18,980 m | 61km SSW of Las Minas, Panama | usgs.gov |
| 12/11/16 | 12:46 PM | 4.5 | 63.4 km | 35,000 m | 18km SW of Las Minas, Panama | usgs.gov |
| 3/3/16 | 9:47 AM | 4.3 | 84.8 km | 36,950 m | 67km SSW of Rio de Jesus, Panama | usgs.gov |
| 3/24/15 | 7:19 PM | 4.8 | 94.4 km | 10,000 m | 71km S of San Felix, Panama | usgs.gov |
| 2/12/15 | 10:21 PM | 4.8 | 92.3 km | 40,530 m | 71km SW of San Francisco, Panama | usgs.gov |
| 2/11/15 | 4:31 PM | 4.3 | 70.6 km | 48,910 m | 49km SW of Sona, Panama | usgs.gov |
| 5/18/12 | 5:56 AM | 4.3 | 53.7 km | 36,000 m | Panama | usgs.gov |
| 5/18/12 | 4:26 AM | 4.9 | 55.1 km | 28,700 m | Panama | usgs.gov |
| 5/14/12 | 12:29 AM | 4.2 | 53.1 km | 44,900 m | Panama | usgs.gov |
La Mesa District
La Mesa District is a district (distrito) of Veraguas Province in Panama. The population according to the 2000 census was 11,746.The district covers a total area of 516 km². The capital lies at the city of La Mesa.
La Mesa District Wikipedia Page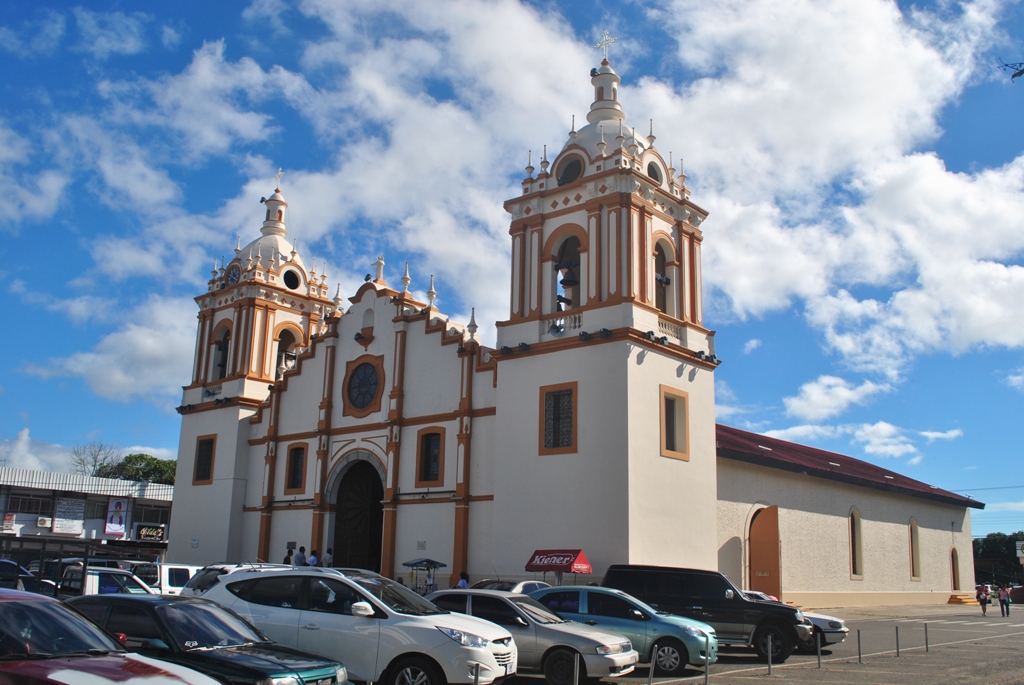

About Our Data
The data on this page is estimated using a number of publicly available tools and resources. It is provided without warranty, and could contain inaccuracies. Use at your own risk.