Categories in Celendín
Industries
Business Distribution by Industry in Celendín
| Industry Description | Number of Establishments |
|---|---|
| Restaurants | 16 |
| Churches | 11 |
| Education | 10 |
| Public parks | 7 |
| Grocery stores and supermarkets | 7 |
| Car repair | 6 |
| Hotels and motels | 6 |
| Travel agencies | 5 |
| Banks | 5 |
| Shopping | 5 |
| Other membership organizations | 5 |
Celendín Facts
| Area | 330.7 km² |
| Population | 26,008 |
| Male Population | 12,508 (48.1%) |
| Female Population | 13,500 (51.9%) |
| Population change (1975 to 2020) | +91.0% |
| Population change (2000 to 2020) | +8.8% |
| Median Age | 23.2 years (Male: 22.5, Female: 23.9) |
| GDP per capita (PPP) | $5,617 (2022) |
| Local Time | |
| Timezone | Peru Standard Time |
| Lat & Lng | -6.86590, -78.14585 |
| Postal Codes | 06226 |
Map of Celendín
Interactive Map
Celendín Population
Years 1975 to 2030
| Data | 1975 | 1990 | 2000 | 2015 | 2020 | 2025* | 2030* |
|---|---|---|---|---|---|---|---|
| Population | 13,615 | 20,397 | 23,914 | 26,607 | 26,008 | 26,067 | 26,094 |
| Population Density | 41.2 / km² | 61.7 / km² | 72.3 / km² | 80.5 / km² | 78.6 / km² | 78.8 / km² | 78.9 / km² |
Celendín Population change from 2000 to 2020
Increase of 8.8% from year 2000 to 2020
| Location | Change since 1975 | Change since 1990 | Change since 2000 |
|---|---|---|---|
| Celendín | +91% | +27.5% | +8.8% |
| Cajamarca Region | — | — | — |
| Peru | — | — | — |
Celendín Median Age
Median Age: 23.2 years
| Location | Median Age | Median Age (Female) | Median Age (Male) |
|---|---|---|---|
| Celendín | 23.2 yrs | 23.9 yrs | 22.5 yrs |
| Cajamarca Region | 22.8 yrs | 23.3 yrs | 22.3 yrs |
| Peru | 25.1 yrs | 25.6 yrs | 24.6 yrs |
Celendín Population Density
Population Density: 78.6 / km²
| Location | Population | Area | Density |
|---|---|---|---|
| Celendín | 26,008 | 330.7 km² | 78.6 / km² |
| Cajamarca Region | 1.5 million | 32,940.7 km² | 44.4 / km² |
| Peru | 31 million | 1,291,975 km² | 24 / km² |
Celendín Historical and Projected Population
Estimated Population from 0 to 2100
- JRC (European Commission's Joint Research Centre) work on the GHS built-up grid
- CIESIN (Center for International Earth Science Information Network)
- [Link] Klein Goldewijk, K., Beusen, A., Doelman, J., and Stehfest, E.: Anthropogenic land use estimates for the Holocene – HYDE 3.2, Earth Syst. Sci. Data, 9, 927–953, https://doi.org/10.5194/essd-9-927-2017, 2017.
Human Development Index (HDI)
Statistic composite index of life expectancy, education, and per capita income.
Celendín Gross Domestic Product (GDP)
GDP per capita, PPP (constant 2017 international $)
| Data | 1990 | 1995 | 2000 | 2005 | 2010 | 2015 | 2020 | 2022 |
|---|---|---|---|---|---|---|---|---|
| GDP per capita | $2,329 | $3,213 | $3,826 | $5,129 | $7,344 | $7,950 | $4,954 | $5,617 |
| Total GDP | $48.1M | $73.6M | $96.6M | $132.5M | $185.5M | $197.6M | $130.3M | $147.9M |
Celendín CO2 Emissions
Carbon Dioxide (CO2) Emissions Per Capita in Tonnes Per Year
| Location | CO2 Emissions | CO2 Emissions Per Capita | CO2 Emissions Intensity |
|---|---|---|---|
| Celendín | 53,341 tn | 2.05 tn | 161.3 tons/km² |
| Cajamarca Region | 2,997,835 tn | 2.05 tn | 91 tons/km² |
| Peru | 71,626,946 tn | 2.31 tn | 55.4 tons/km² |
| 2013 CO2 emissions (tonnes/year) | 53,341 tn |
| 2013 CO2 emissions (tonnes/year) per capita | 2.05 tn |
| 2013 CO2 emissions intensity (tonnes/km²/year) | 161.3 tons/km² |
Natural Hazards Risk
Relative risk out of 10
| Hazard | Risk Level |
|---|---|
| Drought | Low (2) |
| Flood | Medium (7) |
| Earthquake | Medium (7) |
| Landslide | Medium (7) |
* Risk, particularly concerning flood or landslide, may not be for the entire area.
- Dilley, M., R.S. Chen, U. Deichmann, A.L. Lerner-Lam, M. Arnold, J. Agwe, P. Buys, O. Kjekstad, B. Lyon, and G. Yetman. 2005. Natural Disaster Hotspots: A Global Risk Analysis. Washington, D.C.: World Bank. https://doi.org/10.1596/0-8213-5930-4.
- Center for Hazards and Risk Research - CHRR - Columbia University, Center for International Earth Science Information Network - CIESIN - Columbia University, and Norwegian Geotechnical Institute - NGI. 2005. Global Landslide Hazard Distribution. Palisades, NY: NASA Socioeconomic Data and Applications Center (SEDAC). https://doi.org/10.7927/H4P848VZ.
- Center for Hazards and Risk Research - CHRR - Columbia University, Center for International Earth Science Information Network - CIESIN - Columbia University, and International Research Institute for Climate and Society - IRI - Columbia University. 2005. Global Drought Hazard Frequency and Distribution. Palisades, NY: NASA Socioeconomic Data and Applications Center (SEDAC). https://doi.org/10.7927/H4VX0DFT.
- Center for Hazards and Risk Research - CHRR - Columbia University, Center for International Earth Science Information Network - CIESIN - Columbia University. 2005. Global Flood Hazard Frequency and Distribution. Palisades, NY: NASA Socioeconomic Data and Applications Center (SEDAC). https://doi.org/10.7927/H4668B3D.
- Center for Hazards and Risk Research - CHRR - Columbia University, Center for International Earth Science Information Network - CIESIN - Columbia University. 2005. Global Earthquake Hazard Distribution - Peak Ground Acceleration. Palisades, NY: NASA Socioeconomic Data and Applications Center (SEDAC). https://doi.org/10.7927/H4BZ63ZS.
Recent Nearby Earthquakes
Magnitude 3.0 and greater
| Date▼ | Time↕ | Magnitude↕ | Distance↕ | Depth↕ | Location↕ | Link |
|---|---|---|---|---|---|---|
| 4/11/05 | 2:54 PM | 6 | 55.3 km | 129,900 m | northern Peru | usgs.gov |
| 12/1/98 | 2:55 PM | 4.5 | 68.5 km | 33,000 m | northern Peru | usgs.gov |
| 6/20/94 | 10:02 AM | 4.6 | 2.6 km | 125,000 m | northern Peru | usgs.gov |
| 8/30/85 | 4:44 AM | 4.3 | 92.4 km | 33,000 m | northern Peru | usgs.gov |
| 7/30/79 | 1:43 PM | 4.6 | 22.3 km | 33,000 m | northern Peru | usgs.gov |
| 5/20/79 | 1:43 AM | 5.7 | 94.3 km | 33,000 m | northern Peru | usgs.gov |
| 3/5/74 | 12:55 AM | 4 | 66 km | 235,000 m | northern Peru | usgs.gov |
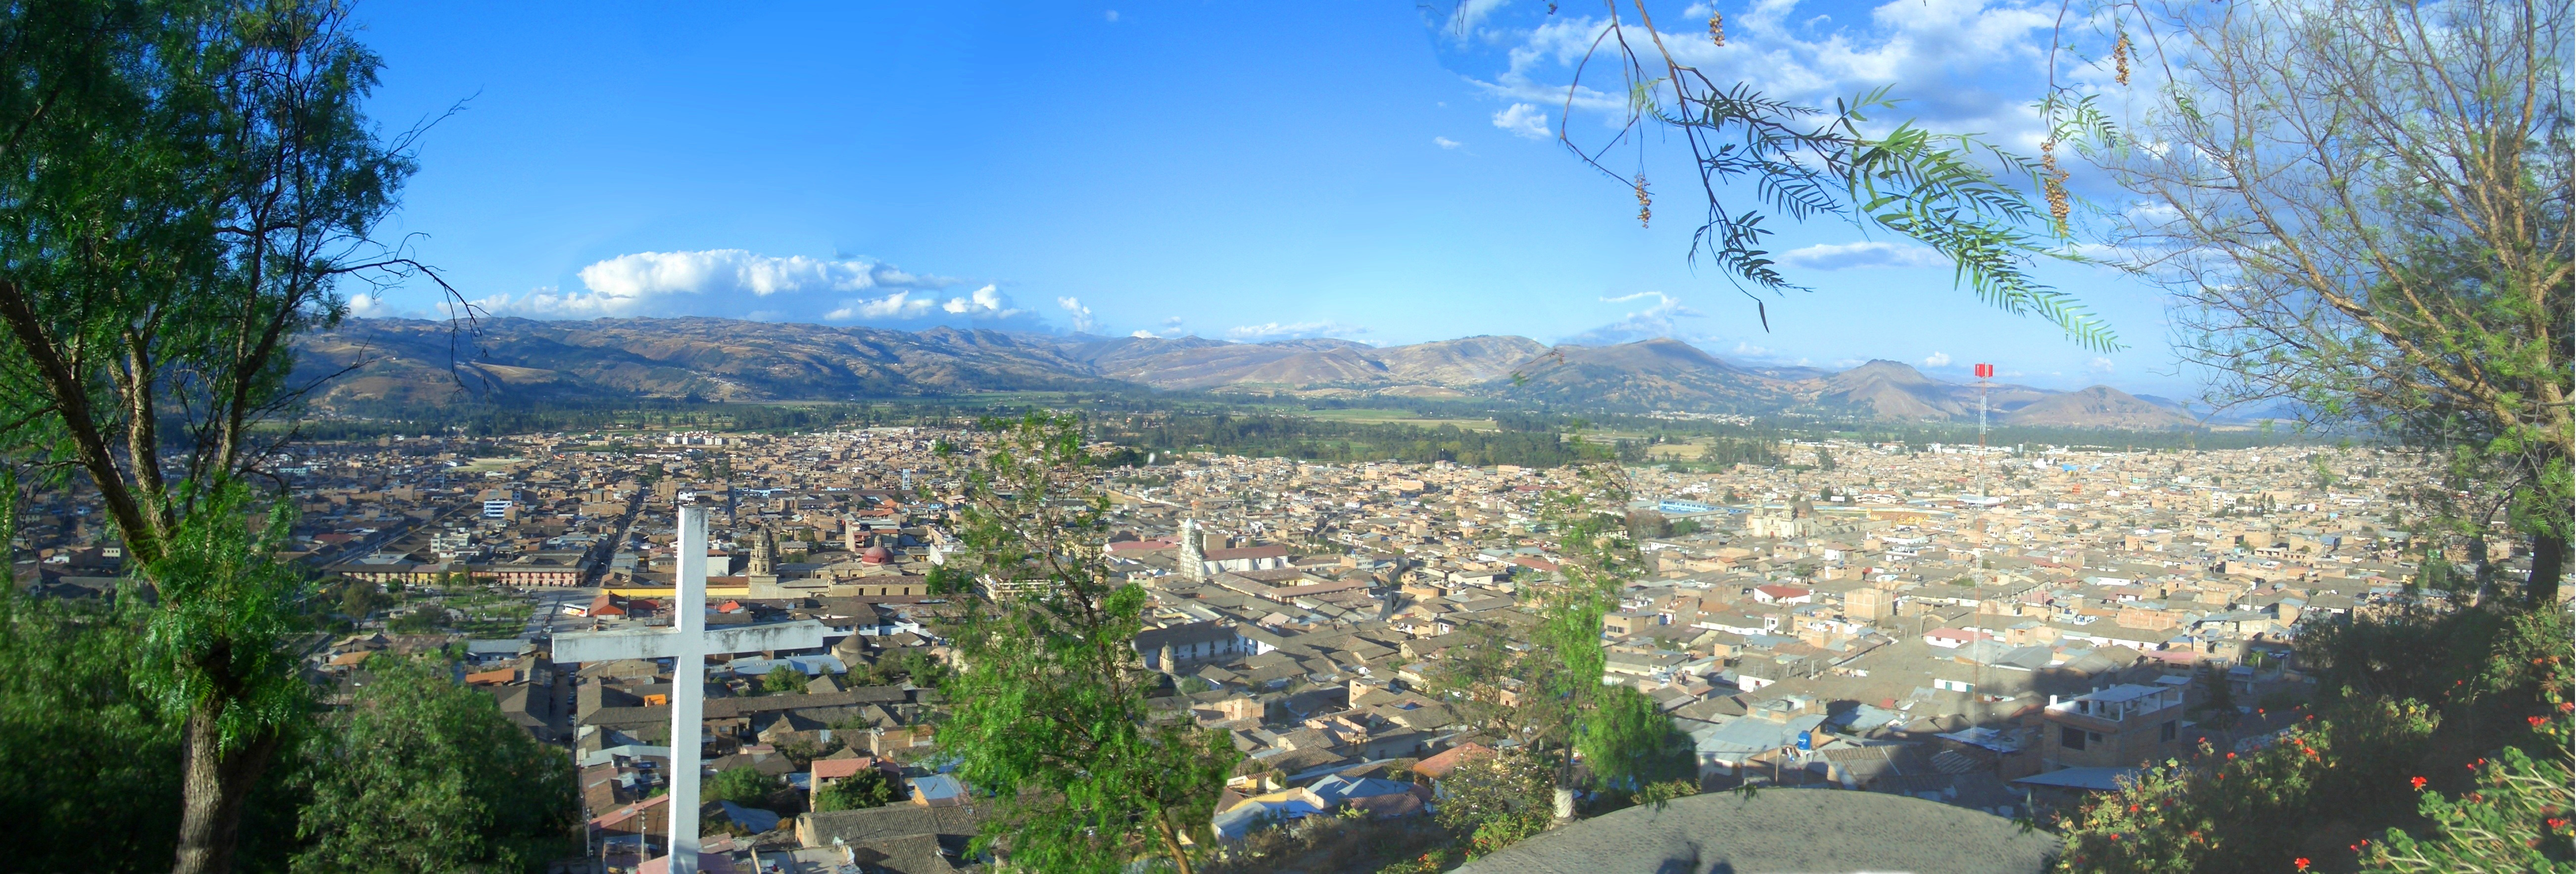
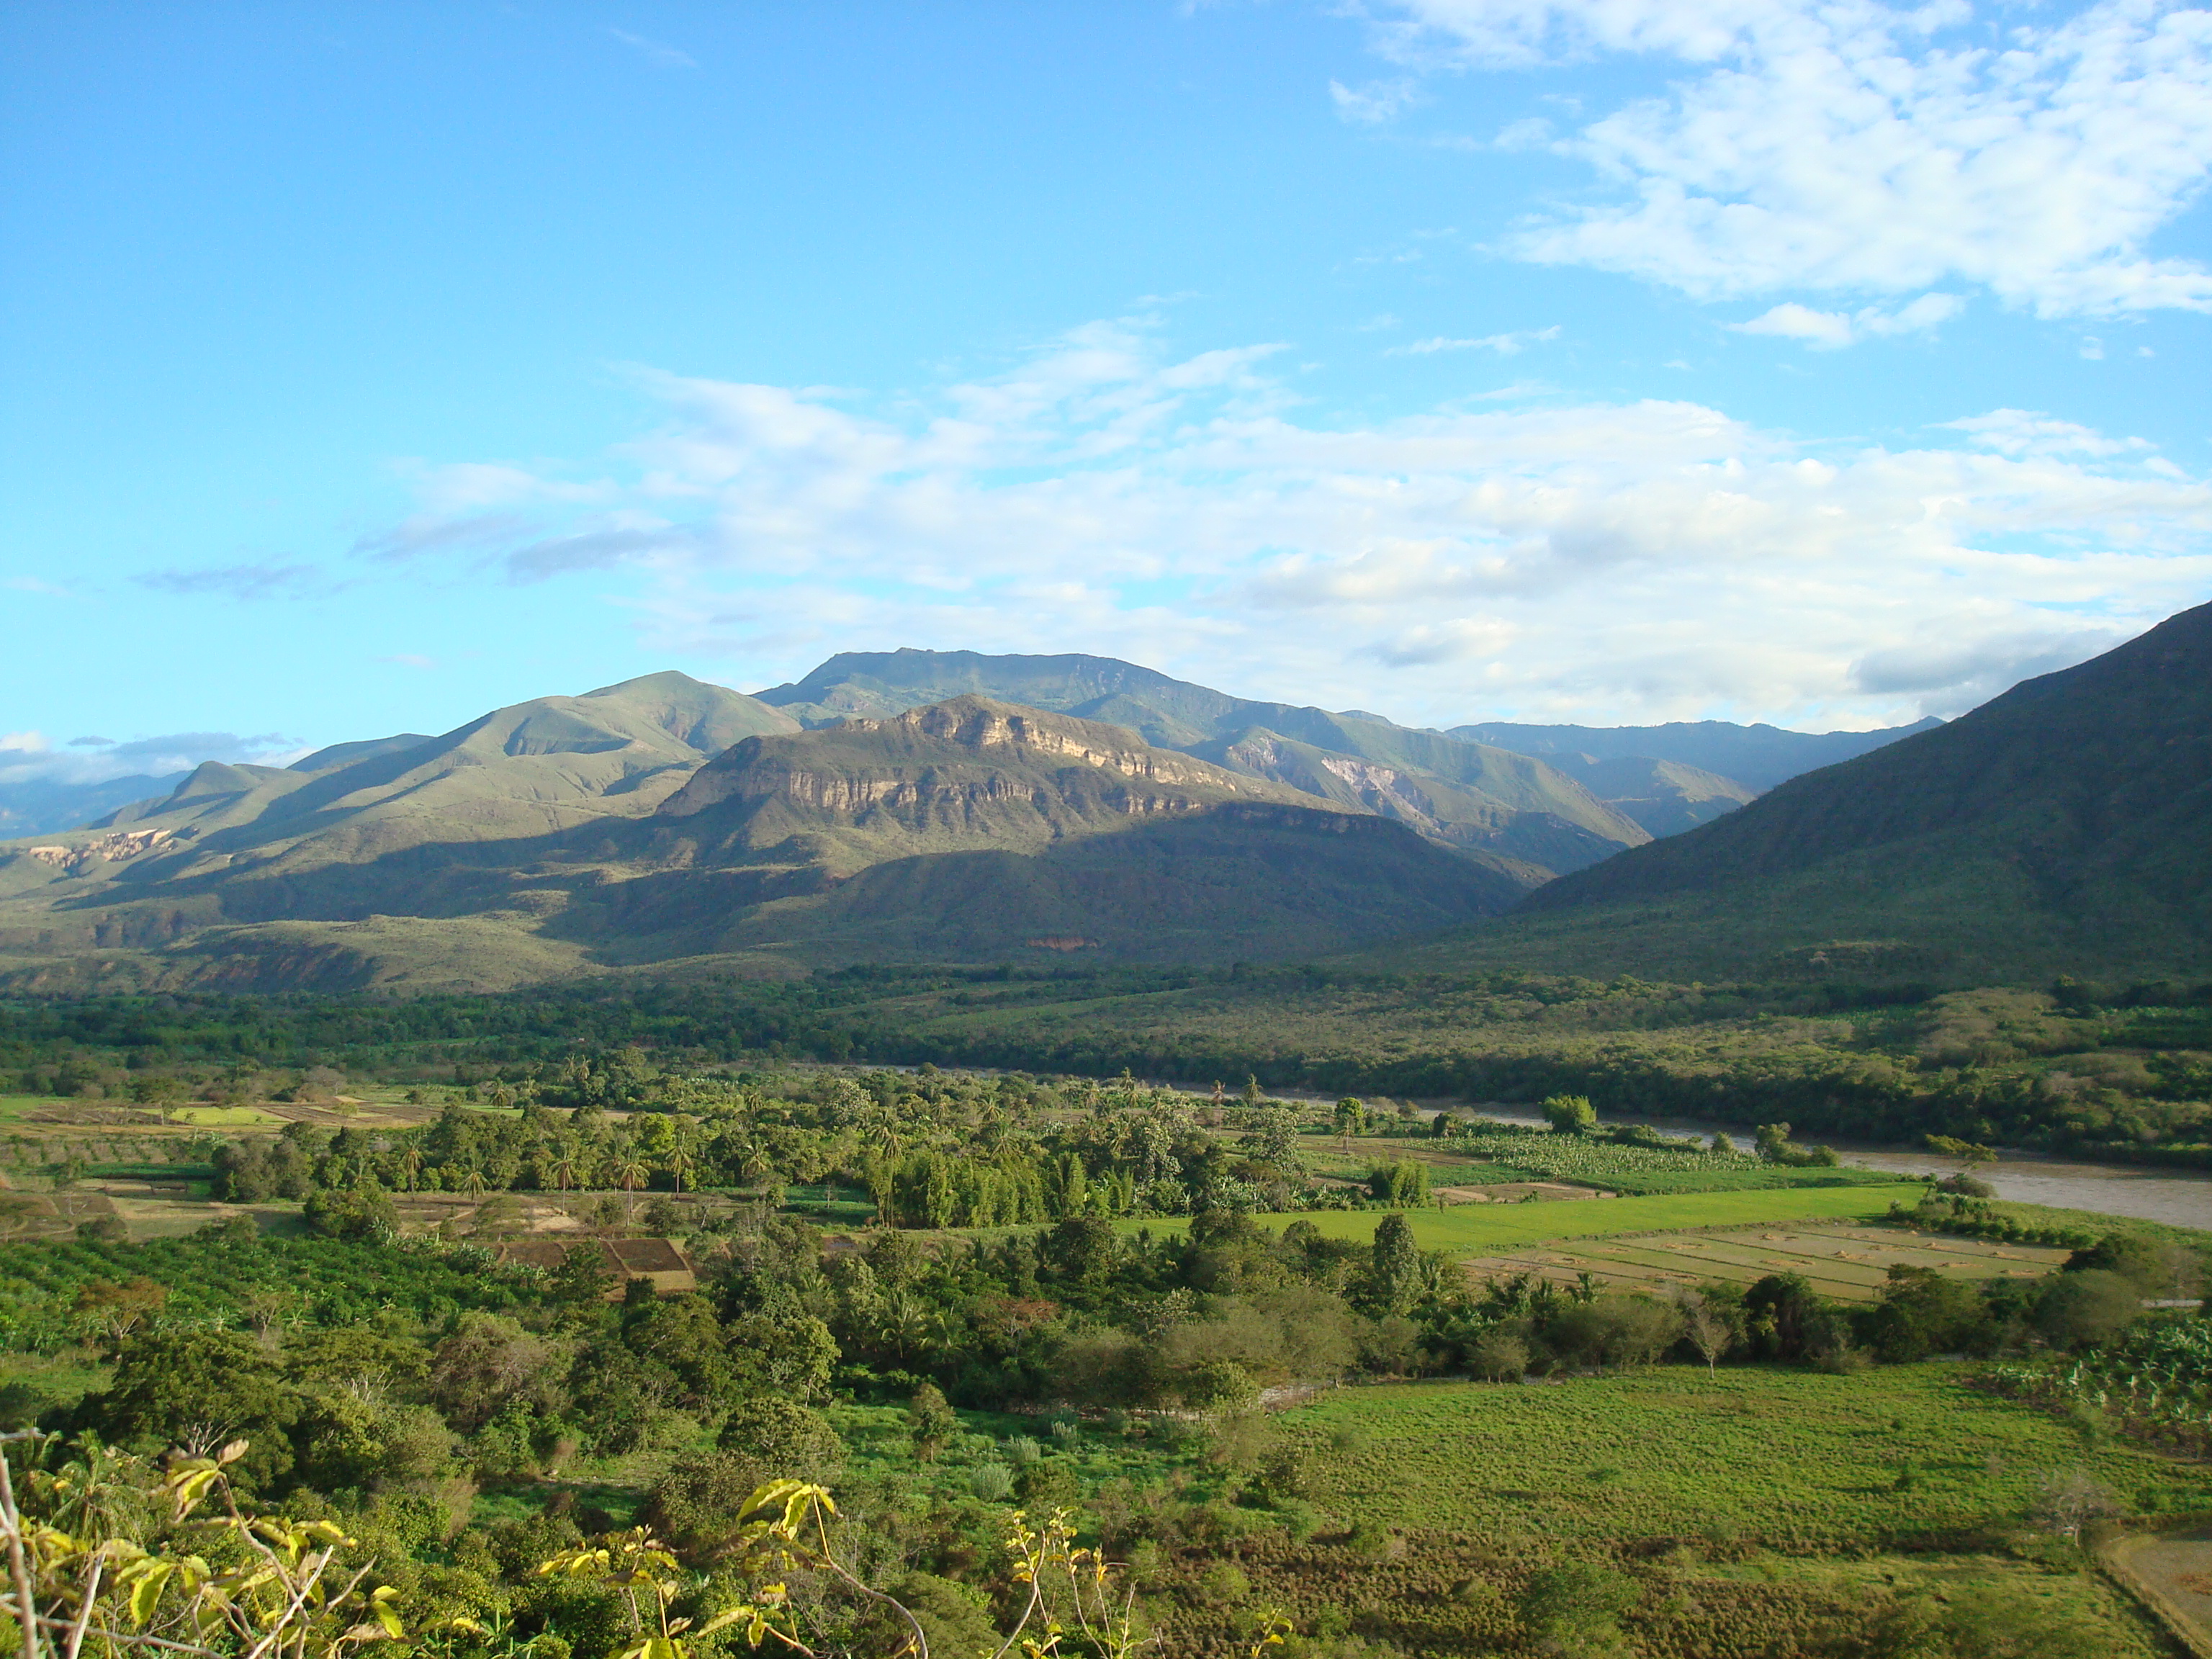
Celendín
Celendín is a town in northern Peru, capital of the province Celendín in the region Cajamarca. the first week of July 2012, four citizens protesting a mining project were killed by police forces under orders of the government led by Ollanta Humala.
Celendín Wikipedia Page

About Our Data
The data on this page is estimated using a number of publicly available tools and resources. It is provided without warranty, and could contain inaccuracies. Use at your own risk.