Categories in Paiján
Industries
Business Distribution by Industry in Paiján
| Industry Description | Number of Establishments | Average Google Rating |
|---|---|---|
| Shopping | 5 | 3.7 |
Paiján Facts
| Area | 66.8 km² |
| Population | 26,690 |
| Male Population | 13,184 (49.4%) |
| Female Population | 13,506 (50.6%) |
| Population change (1975 to 2020) | +116.6% |
| Population change (2000 to 2020) | +17.6% |
| Median Age | 25 years (Male: 24.4, Female: 25.7) |
| Local Time | |
| Timezone | Peru Standard Time |
| Lat & Lng | -7.73291, -79.30150 |
| Postal Codes | 13720, 13721 |
Map of Paiján
Interactive Map
Paiján Population
Years 1975 to 2020
| Data | 1975 | 1990 | 2000 | 2015 | 2020 |
|---|---|---|---|---|---|
| Population | 12,321 | 18,680 | 22,693 | 25,518 | 26,690 |
| Population Density | 184.4 / km² | 279.6 / km² | 339.7 / km² | 381.9 / km² | 399.5 / km² |
Paiján Population change from 2000 to 2015
Increase of 12.4% from year 2000 to 2015
| Location | Change since 1975 | Change since 1990 | Change since 2000 |
|---|---|---|---|
| Paiján | +107.1% | +36.6% | +12.4% |
| La Libertad Region | +124.9% | +48.9% | +22.9% |
| Peru | +104.4% | +42.6% | +20.2% |
Paiján Median Age
Median Age: 25 years
| Location | Median Age | Median Age (Female) | Median Age (Male) |
|---|---|---|---|
| Paiján | 25 yrs | 25.7 yrs | 24.4 yrs |
| La Libertad Region | 24.7 yrs | 25.3 yrs | 24.2 yrs |
| Peru | 25.1 yrs | 25.6 yrs | 24.6 yrs |
Paiján Population Density
Population Density: 400 / km²
| Location | Population | Area | Density |
|---|---|---|---|
| Paiján | 26,690 | 66.8 km² | 400 / km² |
| La Libertad Region | 1.9 million | 25,222.9 km² | 73.4 / km² |
| Peru | 31 million | 1,291,975 km² | 24 / km² |
Paiján Historical and Projected Population
Estimated Population from 400 to 2100
- JRC (European Commission's Joint Research Centre) work on the GHS built-up grid
- CIESIN (Center for International Earth Science Information Network)
- [Link] Klein Goldewijk, K., Beusen, A., Doelman, J., and Stehfest, E.: Anthropogenic land use estimates for the Holocene – HYDE 3.2, Earth Syst. Sci. Data, 9, 927–953, https://doi.org/10.5194/essd-9-927-2017, 2017.
Area Codes
Percentage Area Codes used by businesses in Paiján
Price Distribution
Business distribution by price for Paiján
Human Development Index (HDI)
Statistic composite index of life expectancy, education, and per capita income.
Paiján CO2 Emissions
Carbon Dioxide (CO2) Emissions Per Capita in Tonnes Per Year
| Location | CO2 Emissions | CO2 Emissions Per Capita | CO2 Emissions Intensity |
|---|---|---|---|
| Paiján | 68,349 tn | 2.56 tn | 1,023 tons/km² |
| La Libertad Region | 4,672,573 tn | 2.52 tn | 185.3 tons/km² |
| Peru | 71,626,946 tn | 2.31 tn | 55.4 tons/km² |
| 2013 CO2 emissions (tonnes/year) | 68,349 tn |
| 2013 CO2 emissions (tonnes/year) per capita | 2.56 tn |
| 2013 CO2 emissions intensity (tonnes/km²/year) | 1,023 tons/km² |
Natural Hazards Risk
Relative risk out of 10
| Hazard | Risk Level |
|---|---|
| Drought | Low (2) |
| Flood | Medium (4) |
| Earthquake | High (9) |
* Risk, particularly concerning flood or landslide, may not be for the entire area.
- Dilley, M., R.S. Chen, U. Deichmann, A.L. Lerner-Lam, M. Arnold, J. Agwe, P. Buys, O. Kjekstad, B. Lyon, and G. Yetman. 2005. Natural Disaster Hotspots: A Global Risk Analysis. Washington, D.C.: World Bank. https://doi.org/10.1596/0-8213-5930-4.
- Center for Hazards and Risk Research - CHRR - Columbia University, Center for International Earth Science Information Network - CIESIN - Columbia University, and International Research Institute for Climate and Society - IRI - Columbia University. 2005. Global Drought Hazard Frequency and Distribution. Palisades, NY: NASA Socioeconomic Data and Applications Center (SEDAC). https://doi.org/10.7927/H4VX0DFT.
- Center for Hazards and Risk Research - CHRR - Columbia University, Center for International Earth Science Information Network - CIESIN - Columbia University. 2005. Global Flood Hazard Frequency and Distribution. Palisades, NY: NASA Socioeconomic Data and Applications Center (SEDAC). https://doi.org/10.7927/H4668B3D.
- Center for Hazards and Risk Research - CHRR - Columbia University, Center for International Earth Science Information Network - CIESIN - Columbia University. 2005. Global Earthquake Hazard Distribution - Peak Ground Acceleration. Palisades, NY: NASA Socioeconomic Data and Applications Center (SEDAC). https://doi.org/10.7927/H4BZ63ZS.
Recent Nearby Earthquakes
Magnitude 3.0 and greater
| Date▼ | Time↕ | Magnitude↕ | Distance↕ | Depth↕ | Location↕ | Link |
|---|---|---|---|---|---|---|
| 5/25/19 | 12:56 PM | 4.7 | 86.9 km | 48,340 m | 66km SSW of Santiago de Cao, Peru | usgs.gov |
| 3/31/18 | 11:52 AM | 3.9 | 99.4 km | 35,000 m | 90km WSW of Santiago de Cao, Peru | usgs.gov |
| 2/1/18 | 5:35 AM | 4.3 | 77.4 km | 63,340 m | 23km SW of Salaverry, Peru | usgs.gov |
| 1/22/18 | 7:50 AM | 4 | 51.8 km | 125,120 m | 30km E of Ascope, Peru | usgs.gov |
| 11/28/16 | 3:39 AM | 4.4 | 91.4 km | 48,890 m | 81km WSW of Santiago de Cao, Peru | usgs.gov |
| 6/14/16 | 12:53 PM | 4.1 | 58.7 km | 35,000 m | 9km E of Chepen, Peru | usgs.gov |
| 4/28/16 | 7:00 AM | 4.3 | 95.4 km | 43,000 m | 75km SW of Moche, Peru | usgs.gov |
| 1/31/16 | 6:29 PM | 3.9 | 29.6 km | 64,000 m | 10km SE of San Pedro de Lloc, Peru | usgs.gov |
| 1/16/16 | 9:39 PM | 4.6 | 72.9 km | 43,480 m | 60km SW of Pacasmayo, Peru | usgs.gov |
| 10/9/15 | 5:08 PM | 4 | 39.1 km | 35,000 m | 13km SSE of Santiago de Cao, Peru | usgs.gov |
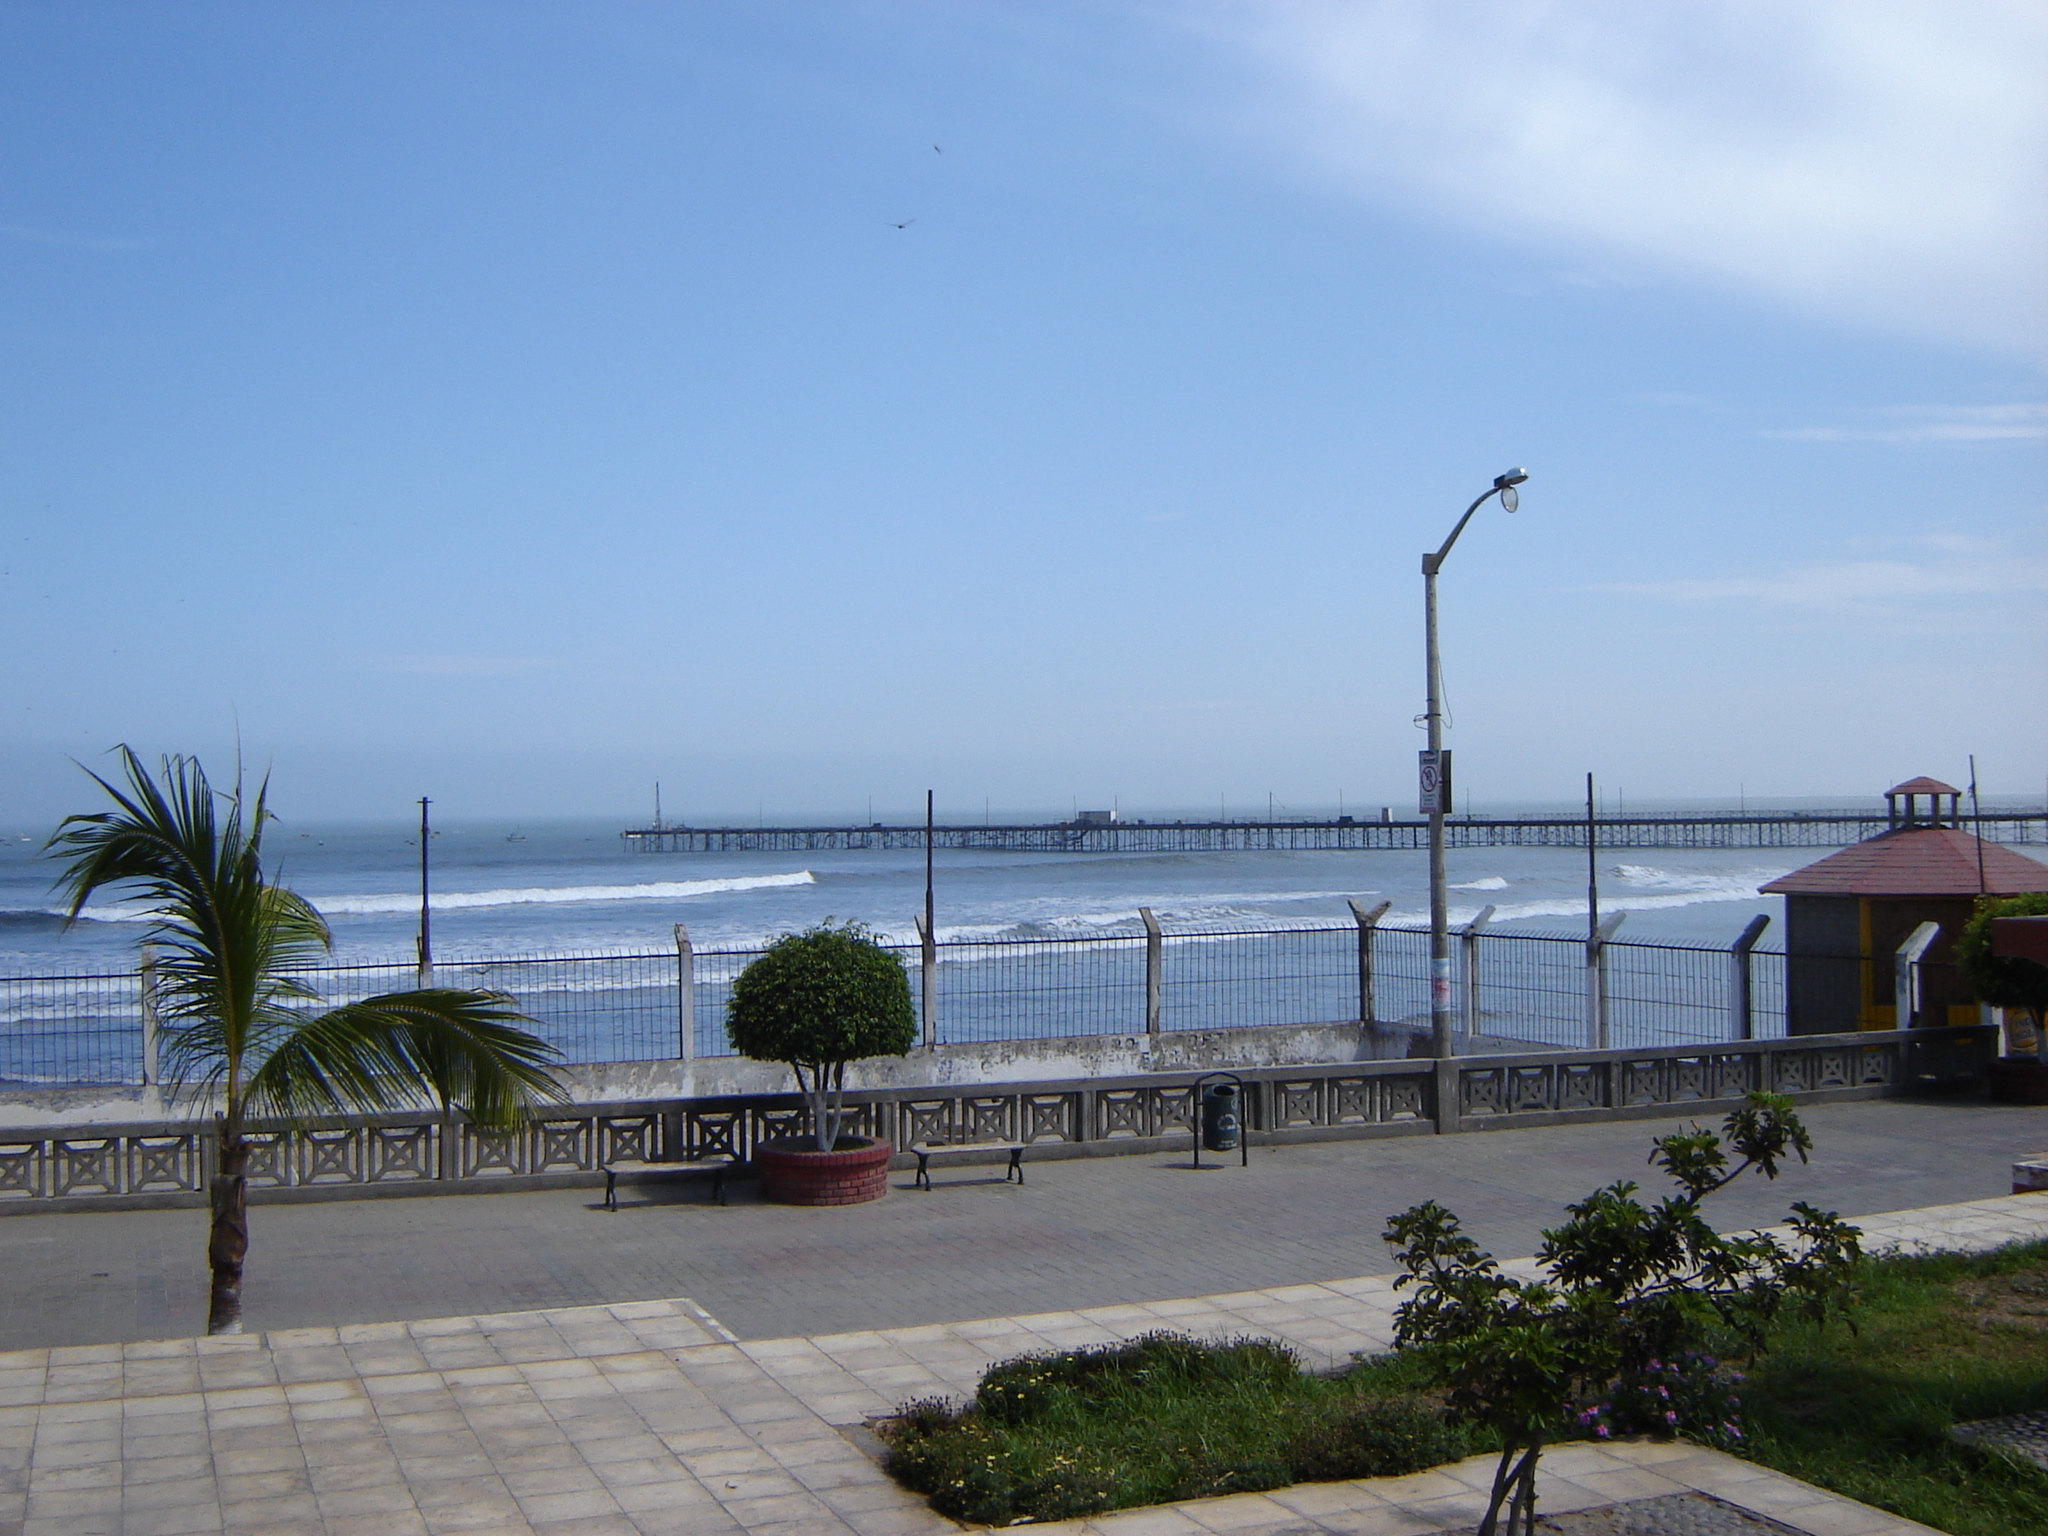
Paiján
Paiján is a town in Northern Peru, capital of the district of Paiján of Ascope Province in the region La Libertad. This town is located beside the Pan-American Highway some 54 km north of Trujillo city in the agricultural Chicama Valley.
Paiján Wikipedia Page

About Our Data
The data on this page is estimated using a number of publicly available tools and resources. It is provided without warranty, and could contain inaccuracies. Use at your own risk.