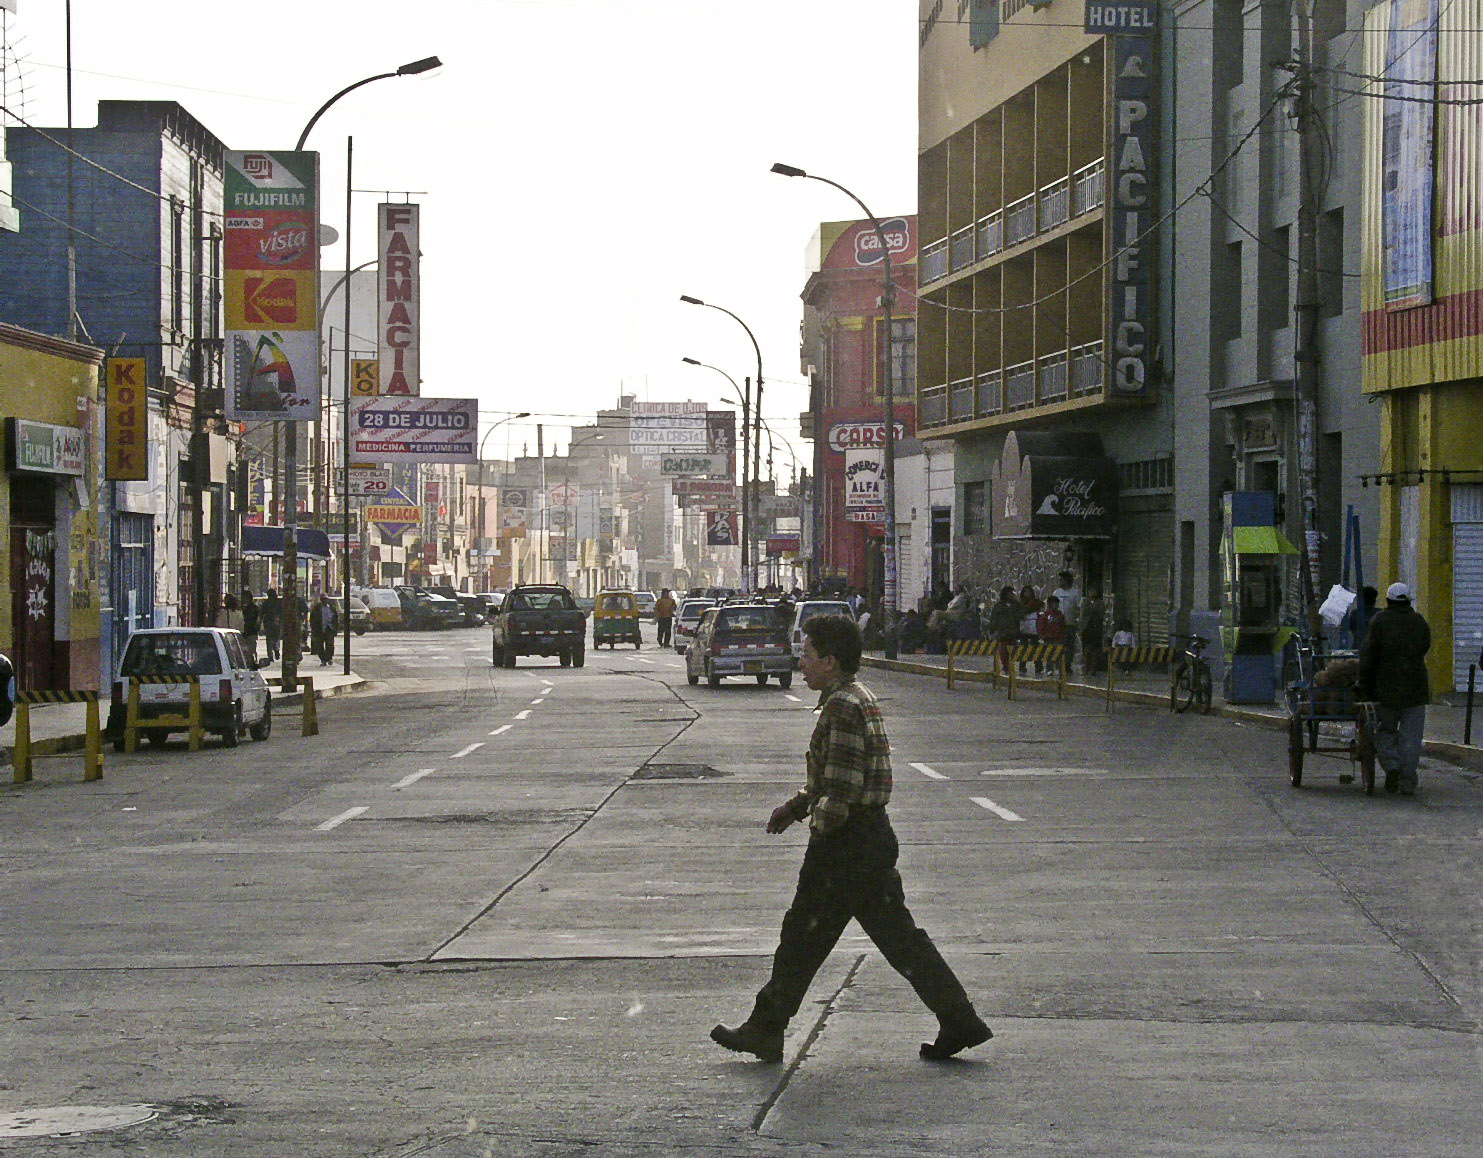
Categories in Supe
Gas StationClothing storesChurchesHardware storeHome Goods StoreEducationTourist AttractionBakeriesBars, pubs and tavernsGrocery stores and supermarketsRestaurantsBanksCondominium ComplexHousing ComplexGeneral StoreShoppingShopping MallShopping otherGymPlaygroundPublic parksSports ComplexHotels and motelsHousing SocietyLodgingUnreachable
Industries
Business Distribution by Industry in Supe
| Industry Description | Number of Establishments |
|---|---|
| Restaurants | 47 |
| Shopping | 17 |
| Grocery stores and supermarkets | 14 |
| Gas station | 13 |
| Education | 13 |
| Hotels and motels | 12 |
| Other accommodation | 9 |
| Bakeries | 9 |
| Churches | 8 |
| Hardware store | 7 |
| Bars, pubs and taverns | 6 |
Supe Facts
| Area | 12.7 km² |
| Population | 10,214 |
| Male Population | 5,124 (50.2%) |
| Female Population | 5,090 (49.8%) |
| Population change (1975 to 2020) | +23.1% |
| Population change (2000 to 2020) | -18.7% |
| Median Age | 26.8 years (Male: 26.5, Female: 27.2) |
| GDP per capita (PPP) | $29,601 (2022) |
| Neighborhoods | Centro de Supe, Micaela Bastidas 1 |
| Local Time | |
| Timezone | Peru Standard Time |
| Lat & Lng | -10.79750, -77.71306 |
Map of Supe
Interactive Map
Supe Population
Years 1975 to 2030
| Data | 1975 | 1990 | 2000 | 2015 | 2020 | 2025* | 2030* |
|---|---|---|---|---|---|---|---|
| Population | 8,297 | 11,334 | 12,569 | 11,601 | 10,214 | 10,535 | 10,835 |
| Population Density | 654 / km² | 893.3 / km² | 990.7 / km² | 914.4 / km² | 805 / km² | 830.3 / km² | 854 / km² |
* Projected
Sources: JRC (European Commission's Joint Research Centre) work on the GHS built-up gridSupe Population change from 2000 to 2020
Decrease of 18.7% from year 2000 to 2020
| Location | Change since 1975 | Change since 1990 | Change since 2000 |
|---|---|---|---|
| Supe | +23.1% | -9.9% | -18.7% |
| Lima Region | — | — | — |
| Peru | — | — | — |
Sources: JRC (European Commission's Joint Research Centre) work on the GHS built-up grid
Supe Median Age
Median Age: 26.8 years
| Location | Median Age | Median Age (Female) | Median Age (Male) |
|---|---|---|---|
| Supe | 26.8 yrs | 27.2 yrs | 26.5 yrs |
| Lima Region | 26.3 yrs | 26.4 yrs | 26.1 yrs |
| Peru | 25.1 yrs | 25.6 yrs | 24.6 yrs |
Sources: CIESIN (Center for International Earth Science Information Network)
Supe Population Density
Population Density: 805 / km²
| Location | Population | Area | Density |
|---|---|---|---|
| Supe | 10,214 | 12.7 km² | 805 / km² |
| Lima Region | 958,642 | 32,501.5 km² | 29.5 / km² |
| Peru | 31 million | 1,291,975 km² | 24 / km² |
Sources: JRC (European Commission's Joint Research Centre) work on the GHS built-up grid
Supe Historical and Projected Population
Estimated Population from 0 to 2100
Sources:
- JRC (European Commission's Joint Research Centre) work on the GHS built-up grid
- CIESIN (Center for International Earth Science Information Network)
- [Link] Klein Goldewijk, K., Beusen, A., Doelman, J., and Stehfest, E.: Anthropogenic land use estimates for the Holocene – HYDE 3.2, Earth Syst. Sci. Data, 9, 927–953, https://doi.org/10.5194/essd-9-927-2017, 2017.
Price Distribution
Business distribution by price for Supe
Human Development Index (HDI)
Statistic composite index of life expectancy, education, and per capita income.
Source: [Link] Kummu, M., Taka, M. &Guillaume, J. Gridded global datasets for Gross Domestic Product and Human Development Index over 1990–2015. Sci Data 5, 180004 (2018) doi:10.1038/sdata.2018.4
Supe Gross Domestic Product (GDP)
GDP per capita, PPP (constant 2017 international $)
| Data | 1990 | 1995 | 2000 | 2005 | 2010 | 2015 | 2020 | 2022 |
|---|---|---|---|---|---|---|---|---|
| GDP per capita | $11,695 | $15,152 | $16,913 | $19,700 | $22,360 | $26,167 | $25,802 | $29,601 |
| Total GDP | $284.7M | $409.7M | $501.1M | $595M | $660.3M | $779.3M | $843.5M | $979.8M |
Source: [Link] Kummu, M., Kosonen, M. & Masoumzadeh Sayyar, S. Downscaled gridded global dataset for gross domestic product (GDP) per capita PPP over 1990–2022. Sci Data 12, 178 (2025) doi:10.1038/s41597-025-04487-x
Supe CO2 Emissions
Carbon Dioxide (CO2) Emissions Per Capita in Tonnes Per Year
| Location | CO2 Emissions | CO2 Emissions Per Capita | CO2 Emissions Intensity |
|---|---|---|---|
| Supe | 30,475 tn | 2.98 tn | 2,401.9 tons/km² |
| Lima Region | 2,995,387 tn | 3.12 tn | 92.2 tons/km² |
| Peru | 71,626,946 tn | 2.31 tn | 55.4 tons/km² |
Sources: [Link] Moran, D., Kanemoto K; Jiborn, M., Wood, R., Többen, J., and Seto, K.C. (2018) Carbon footprints of 13,000 cities. Environmental Research Letters DOI: 10.1088/1748-9326/aac72a
Supe CO2 Emissions
| 2013 CO2 emissions (tonnes/year) | 30,475 tn |
| 2013 CO2 emissions (tonnes/year) per capita | 2.98 tn |
| 2013 CO2 emissions intensity (tonnes/km²/year) | 2,401.9 tons/km² |
Natural Hazards Risk
Relative risk out of 10
| Hazard | Risk Level |
|---|---|
| Drought | Medium (7) |
| Flood | Medium (7) |
| Earthquake | High (10) |
* Risk, particularly concerning flood or landslide, may not be for the entire area.
Sources:
- Dilley, M., R.S. Chen, U. Deichmann, A.L. Lerner-Lam, M. Arnold, J. Agwe, P. Buys, O. Kjekstad, B. Lyon, and G. Yetman. 2005. Natural Disaster Hotspots: A Global Risk Analysis. Washington, D.C.: World Bank. https://doi.org/10.1596/0-8213-5930-4.
- Center for Hazards and Risk Research - CHRR - Columbia University, Center for International Earth Science Information Network - CIESIN - Columbia University, and International Research Institute for Climate and Society - IRI - Columbia University. 2005. Global Drought Hazard Frequency and Distribution. Palisades, NY: NASA Socioeconomic Data and Applications Center (SEDAC). https://doi.org/10.7927/H4VX0DFT.
- Center for Hazards and Risk Research - CHRR - Columbia University, Center for International Earth Science Information Network - CIESIN - Columbia University. 2005. Global Flood Hazard Frequency and Distribution. Palisades, NY: NASA Socioeconomic Data and Applications Center (SEDAC). https://doi.org/10.7927/H4668B3D.
- Center for Hazards and Risk Research - CHRR - Columbia University, Center for International Earth Science Information Network - CIESIN - Columbia University. 2005. Global Earthquake Hazard Distribution - Peak Ground Acceleration. Palisades, NY: NASA Socioeconomic Data and Applications Center (SEDAC). https://doi.org/10.7927/H4BZ63ZS.
Recent Nearby Earthquakes
Magnitude 3.0 and greater
| Date▼ | Time↕ | Magnitude↕ | Distance↕ | Depth↕ | Location↕ | Link |
|---|---|---|---|---|---|---|
| 8/13/19 | 3:50 PM | 4.9 | 81.1 km | 14,880 m | 66km SW of La Union, Peru | usgs.gov |
| 2/7/19 | 9:56 PM | 4.9 | 88.7 km | 40,460 m | 74km W of Paramonga, Peru | usgs.gov |
| 1/7/19 | 5:52 AM | 4.6 | 52.4 km | 62,280 m | 35km W of Paramonga, Peru | usgs.gov |
| 9/27/18 | 10:00 PM | 4.7 | 66.3 km | 65,209 m | 41km SW of Huacho, Peru | usgs.gov |
| 9/8/18 | 8:28 AM | 4.3 | 81.3 km | 52,840 m | 66km W of Paramonga, Peru | usgs.gov |
| 5/22/18 | 1:08 PM | 4.9 | 31 km | 66,250 m | 13km WSW of Vegueta, Peru | usgs.gov |
| 4/7/18 | 8:15 PM | 4.8 | 75.1 km | 51,350 m | 67km WSW of Paramonga, Peru | usgs.gov |
| 12/25/17 | 2:17 AM | 4.2 | 56.9 km | 78,640 m | 23km SSW of Huacho, Peru | usgs.gov |
| 8/3/17 | 11:17 PM | 4.8 | 48.9 km | 58,200 m | 32km W of Paramonga, Peru | usgs.gov |
| 7/14/17 | 5:41 PM | 4.4 | 70.5 km | 119,140 m | 36km WSW of Oyon, Peru | usgs.gov |
Source: U.S. Geological Survey (USGS)

About Our Data
The data on this page is estimated using a number of publicly available tools and resources. It is provided without warranty, and could contain inaccuracies. Use at your own risk.