Categories in Camalig, Albay
Industries
Business Distribution by Industry in Camalig, Albay
| Industry Description | Number of Establishments |
|---|---|
| Public administration | 82 |
| Restaurants | 74 |
| Shopping | 46 |
| Education | 43 |
| Shopping other | 24 |
| Travel agencies | 20 |
| Gas station | 19 |
Camalig, Albay Facts
| Area | 116.3 km² |
| Population | 82,049 |
| Male Population | 41,782 (50.9%) |
| Female Population | 40,267 (49.1%) |
| Population change (1975 to 2020) | +441.1% |
| Population change (2000 to 2020) | +45.2% |
| Median Age | 22.8 years (Male: 22.1, Female: 23.4) |
| Area Codes | 52 |
| Neighborhoods | Poblacion, Del Rosario, Brgy: 4 Poblacion, Barangay 1 Poblacion, Barangay Cabangan |
| Local Time | |
| Timezone | Philippine Standard Time |
| Lat & Lng | 13.18210, 123.65430 |
| Zip Codes | 4502 |
Map of Camalig, Albay
Interactive Map
Camalig, Albay Population
Years 1975 to 2020
| Data | 1975 | 1990 | 2000 | 2015 | 2020 |
|---|---|---|---|---|---|
| Population | 15,162 | 39,089 | 56,509 | 75,793 | 82,049 |
| Population Density | 130.4 / km² | 336.1 / km² | 485.8 / km² | 651.6 / km² | 705.4 / km² |
Camalig, Albay Population change from 2000 to 2015
Increase of 34.1% from year 2000 to 2015
| Location | Change since 1975 | Change since 1990 | Change since 2000 |
|---|---|---|---|
| Camalig, Albay | +399.9% | +93.9% | +34.1% |
| Philippines | +146.5% | +63.3% | +29.5% |
Camalig, Albay Median Age
Median Age: 22.8 years
| Location | Median Age | Median Age (Female) | Median Age (Male) |
|---|---|---|---|
| Camalig, Albay | 22.8 yrs | 23.4 yrs | 22.1 yrs |
| Philippines | 23.2 yrs | 23.6 yrs | 22.8 yrs |
Camalig, Albay Population Density
Population Density: 705 / km²
| Location | Population | Area | Density |
|---|---|---|---|
| Camalig, Albay | 82,049 | 116.3 km² | 705 / km² |
| Philippines | 96.6 million | 296,939.4 km² | 325 / km² |
Camalig, Albay Historical and Projected Population
Estimated Population from 1860 to 2100
- JRC (European Commission's Joint Research Centre) work on the GHS built-up grid
- CIESIN (Center for International Earth Science Information Network)
- [Link] Klein Goldewijk, K., Beusen, A., Doelman, J., and Stehfest, E.: Anthropogenic land use estimates for the Holocene – HYDE 3.2, Earth Syst. Sci. Data, 9, 927–953, https://doi.org/10.5194/essd-9-927-2017, 2017.
Neighborhoods in Camalig, Albay
Percentage of businesses by neighborhood in Camalig, Albay
Area Codes
Percentage Area Codes used by businesses in Camalig, Albay
Price Distribution
Business distribution by price for Camalig, Albay
Human Development Index (HDI)
Statistic composite index of life expectancy, education, and per capita income.
Camalig, Albay CO2 Emissions
Carbon Dioxide (CO2) Emissions Per Capita in Tonnes Per Year
| Location | CO2 Emissions | CO2 Emissions Per Capita | CO2 Emissions Intensity |
|---|---|---|---|
| Camalig, Albay | 94,492 tn | 1.15 tn | 812.4 tons/km² |
| Philippines | 104,920,564 tn | 1.09 tn | 353.3 tons/km² |
| 2013 CO2 emissions (tonnes/year) | 94,492 tn |
| 2013 CO2 emissions (tonnes/year) per capita | 1.15 tn |
| 2013 CO2 emissions intensity (tonnes/km²/year) | 812.4 tons/km² |
Natural Hazards Risk
Relative risk out of 10
| Hazard | Risk Level |
|---|---|
| Drought | Medium (5) |
| Flood | Medium (7) |
| Earthquake | High (8) |
| Cyclone | High (10) |
| Landslide | High (10) |
| Volcano | High (10) |
* Risk, particularly concerning flood or landslide, may not be for the entire area.
- Dilley, M., R.S. Chen, U. Deichmann, A.L. Lerner-Lam, M. Arnold, J. Agwe, P. Buys, O. Kjekstad, B. Lyon, and G. Yetman. 2005. Natural Disaster Hotspots: A Global Risk Analysis. Washington, D.C.: World Bank. https://doi.org/10.1596/0-8213-5930-4.
- Center for Hazards and Risk Research - CHRR - Columbia University, Center for International Earth Science Information Network - CIESIN - Columbia University, and Norwegian Geotechnical Institute - NGI. 2005. Global Landslide Hazard Distribution. Palisades, NY: NASA Socioeconomic Data and Applications Center (SEDAC). https://doi.org/10.7927/H4P848VZ.
- Center for Hazards and Risk Research - CHRR - Columbia University, Center for International Earth Science Information Network - CIESIN - Columbia University, International Bank for Reconstruction and Development - The World Bank, and United Nations Environment Programme Global Resource Information Database Geneva - UNEP/GRID-Geneva. 2005. Global Cyclone Hazard Frequency and Distribution. Palisades, NY: NASA Socioeconomic Data and Applications Center (SEDAC). https://doi.org/10.7927/H4CZ353K.
- Center for Hazards and Risk Research - CHRR - Columbia University, Center for International Earth Science Information Network - CIESIN - Columbia University, and International Research Institute for Climate and Society - IRI - Columbia University. 2005. Global Drought Hazard Frequency and Distribution. Palisades, NY: NASA Socioeconomic Data and Applications Center (SEDAC). https://doi.org/10.7927/H4VX0DFT.
- Center for Hazards and Risk Research - CHRR - Columbia University, Center for International Earth Science Information Network - CIESIN - Columbia University. 2005. Global Flood Hazard Frequency and Distribution. Palisades, NY: NASA Socioeconomic Data and Applications Center (SEDAC). https://doi.org/10.7927/H4668B3D.
- Center for Hazards and Risk Research - CHRR - Columbia University, Center for International Earth Science Information Network - CIESIN - Columbia University. 2005. Global Volcano Hazard Frequency and Distribution. Palisades, NY: NASA Socioeconomic Data and Applications Center (SEDAC). https://doi.org/10.7927/H4BR8Q45.
- Center for Hazards and Risk Research - CHRR - Columbia University, Center for International Earth Science Information Network - CIESIN - Columbia University. 2005. Global Earthquake Hazard Distribution - Peak Ground Acceleration. Palisades, NY: NASA Socioeconomic Data and Applications Center (SEDAC). https://doi.org/10.7927/H4BZ63ZS.
Recent Nearby Earthquakes
Magnitude 3.0 and greater
| Date▼ | Time↕ | Magnitude↕ | Distance↕ | Depth↕ | Location↕ | Link |
|---|---|---|---|---|---|---|
| 5/14/19 | 1:36 AM | 4.3 | 49.3 km | 35,000 m | 13km NW of Monreal, Philippines | usgs.gov |
| 3/19/19 | 2:59 AM | 4.2 | 49.8 km | 113,590 m | 2km N of Casiguran, Philippines | usgs.gov |
| 12/6/18 | 9:26 AM | 4.2 | 43.7 km | 64,430 m | 1km NE of Sorsogon, Philippines | usgs.gov |
| 10/3/18 | 3:46 PM | 4.5 | 70.5 km | 110,670 m | 2km NE of Bulusan, Philippines | usgs.gov |
| 11/5/17 | 3:36 PM | 4.6 | 19.3 km | 54,840 m | 4km E of Maslog, Philippines | usgs.gov |
| 9/21/17 | 3:39 AM | 4.5 | 55.4 km | 36,420 m | 6km ESE of Mabiton, Philippines | usgs.gov |
| 7/30/17 | 3:31 PM | 4.4 | 39.1 km | 76,320 m | 1km SSE of Capuy, Philippines | usgs.gov |
| 1/11/17 | 6:24 AM | 4.8 | 57.4 km | 75,030 m | 17km S of Calolbon, Philippines | usgs.gov |
| 1/2/17 | 5:36 PM | 4.2 | 69.1 km | 10,370 m | 10km NNE of Aroroy, Philippines | usgs.gov |
| 2/11/16 | 10:19 AM | 4.2 | 60.3 km | 78,690 m | 4km N of Prieto Diaz, Philippines | usgs.gov |
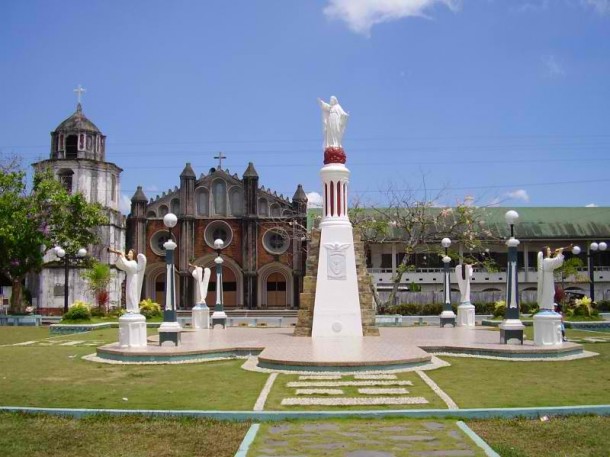
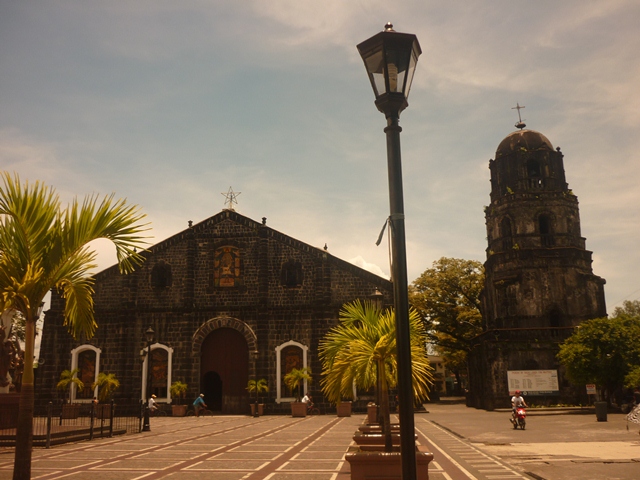
Camalig, Albay
Camalig is a 3rd class municipality in the province of Albay, Philippines. As of the 2010 census, it had a population of 63,585 people. 1952, there was a mass conversion of certain sitios into barrios, namely: Anoling, Binandirahan, Cabraran, Ilawod..
Camalig, Albay Wikipedia Page

About Our Data
The data on this page is estimated using a number of publicly available tools and resources. It is provided without warranty, and could contain inaccuracies. Use at your own risk.