Categories in Lucena, Philippines
Industries
Business Distribution by Industry in Lucena, Philippines
| Industry Description | Number of Establishments | Average Age of Business |
|---|---|---|
| Restaurants | 829 | — |
| Shopping | 482 | — |
| Health and medical | 227 | — |
| Corporate management | 201 | — |
| Public administration | 199 | — |
| Clothing stores | 198 | — |
| Grocery stores and supermarkets | 192 | — |
| Education | 159 | 41 years |
| Bakeries | 144 | — |
Lucena, Philippines Facts
| Area | 67.9 km² |
| Population | 276,963 |
| Male Population | 138,138 (49.9%) |
| Female Population | 138,825 (50.1%) |
| Population change (1975 to 2020) | +397.1% |
| Population change (2000 to 2020) | +40.6% |
| Median Age | 23.1 years (Male: 22.5, Female: 23.6) |
| Area Codes | 42 |
| Neighborhoods | Ibabang Dupay, Barangay 5, Barangay 3, Barangay 4, Barangay 1 |
| Local Time | |
| Timezone | Philippine Standard Time |
| Lat & Lng | 13.93139, 121.61722 |
Map of Lucena, Philippines
Interactive Map
Lucena, Philippines Population
Years 1975 to 2020
| Data | 1975 | 1990 | 2000 | 2015 | 2020 |
|---|---|---|---|---|---|
| Population | 55,712 | 138,597 | 196,993 | 255,597 | 276,963 |
| Population Density | 820.8 / km² | 2,041.9 / km² | 2,902.3 / km² | 3,765.7 / km² | 4,080.5 / km² |
Lucena, Philippines Population change from 2000 to 2015
Increase of 29.7% from year 2000 to 2015
| Location | Change since 1975 | Change since 1990 | Change since 2000 |
|---|---|---|---|
| Lucena, Philippines | +358.8% | +84.4% | +29.7% |
| Philippines | +146.5% | +63.3% | +29.5% |
Lucena, Philippines Median Age
Median Age: 23.1 years
| Location | Median Age | Median Age (Female) | Median Age (Male) |
|---|---|---|---|
| Lucena, Philippines | 23.1 yrs | 23.6 yrs | 22.5 yrs |
| Philippines | 23.2 yrs | 23.6 yrs | 22.8 yrs |
Lucena, Philippines Population Density
Population Density: 4,081 / km²
| Location | Population | Area | Density |
|---|---|---|---|
| Lucena, Philippines | 276,963 | 67.9 km² | 4,081 / km² |
| Philippines | 96.6 million | 296,939.4 km² | 325 / km² |
Lucena, Philippines Historical and Projected Population
Estimated Population from 1900 to 2100
- JRC (European Commission's Joint Research Centre) work on the GHS built-up grid
- CIESIN (Center for International Earth Science Information Network)
- [Link] Klein Goldewijk, K., Beusen, A., Doelman, J., and Stehfest, E.: Anthropogenic land use estimates for the Holocene – HYDE 3.2, Earth Syst. Sci. Data, 9, 927–953, https://doi.org/10.5194/essd-9-927-2017, 2017.
Neighborhoods in Lucena, Philippines
Percentage of businesses by neighborhood in Lucena, Philippines
Price Distribution
Business distribution by price for Lucena, Philippines
Human Development Index (HDI)
Statistic composite index of life expectancy, education, and per capita income.
Lucena, Philippines CO2 Emissions
Carbon Dioxide (CO2) Emissions Per Capita in Tonnes Per Year
| Location | CO2 Emissions | CO2 Emissions Per Capita | CO2 Emissions Intensity |
|---|---|---|---|
| Lucena, Philippines | 251,701 tn | 0.91 tn | 3,708.3 tons/km² |
| Philippines | 104,920,564 tn | 1.09 tn | 353.3 tons/km² |
| 2013 CO2 emissions (tonnes/year) | 251,701 tn |
| 2013 CO2 emissions (tonnes/year) per capita | 0.91 tn |
| 2013 CO2 emissions intensity (tonnes/km²/year) | 3,708.3 tons/km² |
Natural Hazards Risk
Relative risk out of 10
| Hazard | Risk Level |
|---|---|
| Drought | Medium (4) |
| Flood | High (10) |
| Earthquake | High (7.3) |
| Cyclone | High (10) |
| Landslide | Medium (6) |
* Risk, particularly concerning flood or landslide, may not be for the entire area.
- Dilley, M., R.S. Chen, U. Deichmann, A.L. Lerner-Lam, M. Arnold, J. Agwe, P. Buys, O. Kjekstad, B. Lyon, and G. Yetman. 2005. Natural Disaster Hotspots: A Global Risk Analysis. Washington, D.C.: World Bank. https://doi.org/10.1596/0-8213-5930-4.
- Center for Hazards and Risk Research - CHRR - Columbia University, Center for International Earth Science Information Network - CIESIN - Columbia University, and Norwegian Geotechnical Institute - NGI. 2005. Global Landslide Hazard Distribution. Palisades, NY: NASA Socioeconomic Data and Applications Center (SEDAC). https://doi.org/10.7927/H4P848VZ.
- Center for Hazards and Risk Research - CHRR - Columbia University, Center for International Earth Science Information Network - CIESIN - Columbia University, International Bank for Reconstruction and Development - The World Bank, and United Nations Environment Programme Global Resource Information Database Geneva - UNEP/GRID-Geneva. 2005. Global Cyclone Hazard Frequency and Distribution. Palisades, NY: NASA Socioeconomic Data and Applications Center (SEDAC). https://doi.org/10.7927/H4CZ353K.
- Center for Hazards and Risk Research - CHRR - Columbia University, Center for International Earth Science Information Network - CIESIN - Columbia University, and International Research Institute for Climate and Society - IRI - Columbia University. 2005. Global Drought Hazard Frequency and Distribution. Palisades, NY: NASA Socioeconomic Data and Applications Center (SEDAC). https://doi.org/10.7927/H4VX0DFT.
- Center for Hazards and Risk Research - CHRR - Columbia University, Center for International Earth Science Information Network - CIESIN - Columbia University. 2005. Global Flood Hazard Frequency and Distribution. Palisades, NY: NASA Socioeconomic Data and Applications Center (SEDAC). https://doi.org/10.7927/H4668B3D.
- Center for Hazards and Risk Research - CHRR - Columbia University, Center for International Earth Science Information Network - CIESIN - Columbia University. 2005. Global Earthquake Hazard Distribution - Peak Ground Acceleration. Palisades, NY: NASA Socioeconomic Data and Applications Center (SEDAC). https://doi.org/10.7927/H4BZ63ZS.
Recent Nearby Earthquakes
Magnitude 3.0 and greater
| Date▼ | Time↕ | Magnitude↕ | Distance↕ | Depth↕ | Location↕ | Link |
|---|---|---|---|---|---|---|
| 7/4/19 | 3:00 AM | 4.5 | 15.8 km | 10,000 m | 0km SSE of Montecillo, Philippines | usgs.gov |
| 2/6/19 | 6:01 AM | 4.6 | 25.6 km | 10,000 m | 5km S of Marao, Philippines | usgs.gov |
| 10/23/17 | 3:28 PM | 4.5 | 60.1 km | 105,370 m | 5km S of Banalo, Philippines | usgs.gov |
| 9/8/17 | 3:49 PM | 4.3 | 56.2 km | 115,660 m | 4km NNE of Talahib Payap, Philippines | usgs.gov |
| 6/21/17 | 1:18 AM | 4.3 | 44.5 km | 10,000 m | 0km E of San Andres, Philippines | usgs.gov |
| 5/9/17 | 7:06 PM | 4.6 | 53.5 km | 147,340 m | 1km SE of Lobo, Philippines | usgs.gov |
| 4/9/17 | 3:14 AM | 4.8 | 59.7 km | 10,000 m | 4km ESE of Santa Clara, Philippines | usgs.gov |
| 4/8/17 | 8:36 AM | 4.7 | 61.1 km | 10,000 m | 1km SSW of Talahib Payap, Philippines | usgs.gov |
| 4/8/17 | 7:29 AM | 5 | 56.9 km | 10,000 m | 4km SSW of Ibaan, Philippines | usgs.gov |
| 4/5/17 | 2:32 PM | 4.6 | 56.3 km | 9,760 m | 1km NNW of Banalo, Philippines | usgs.gov |
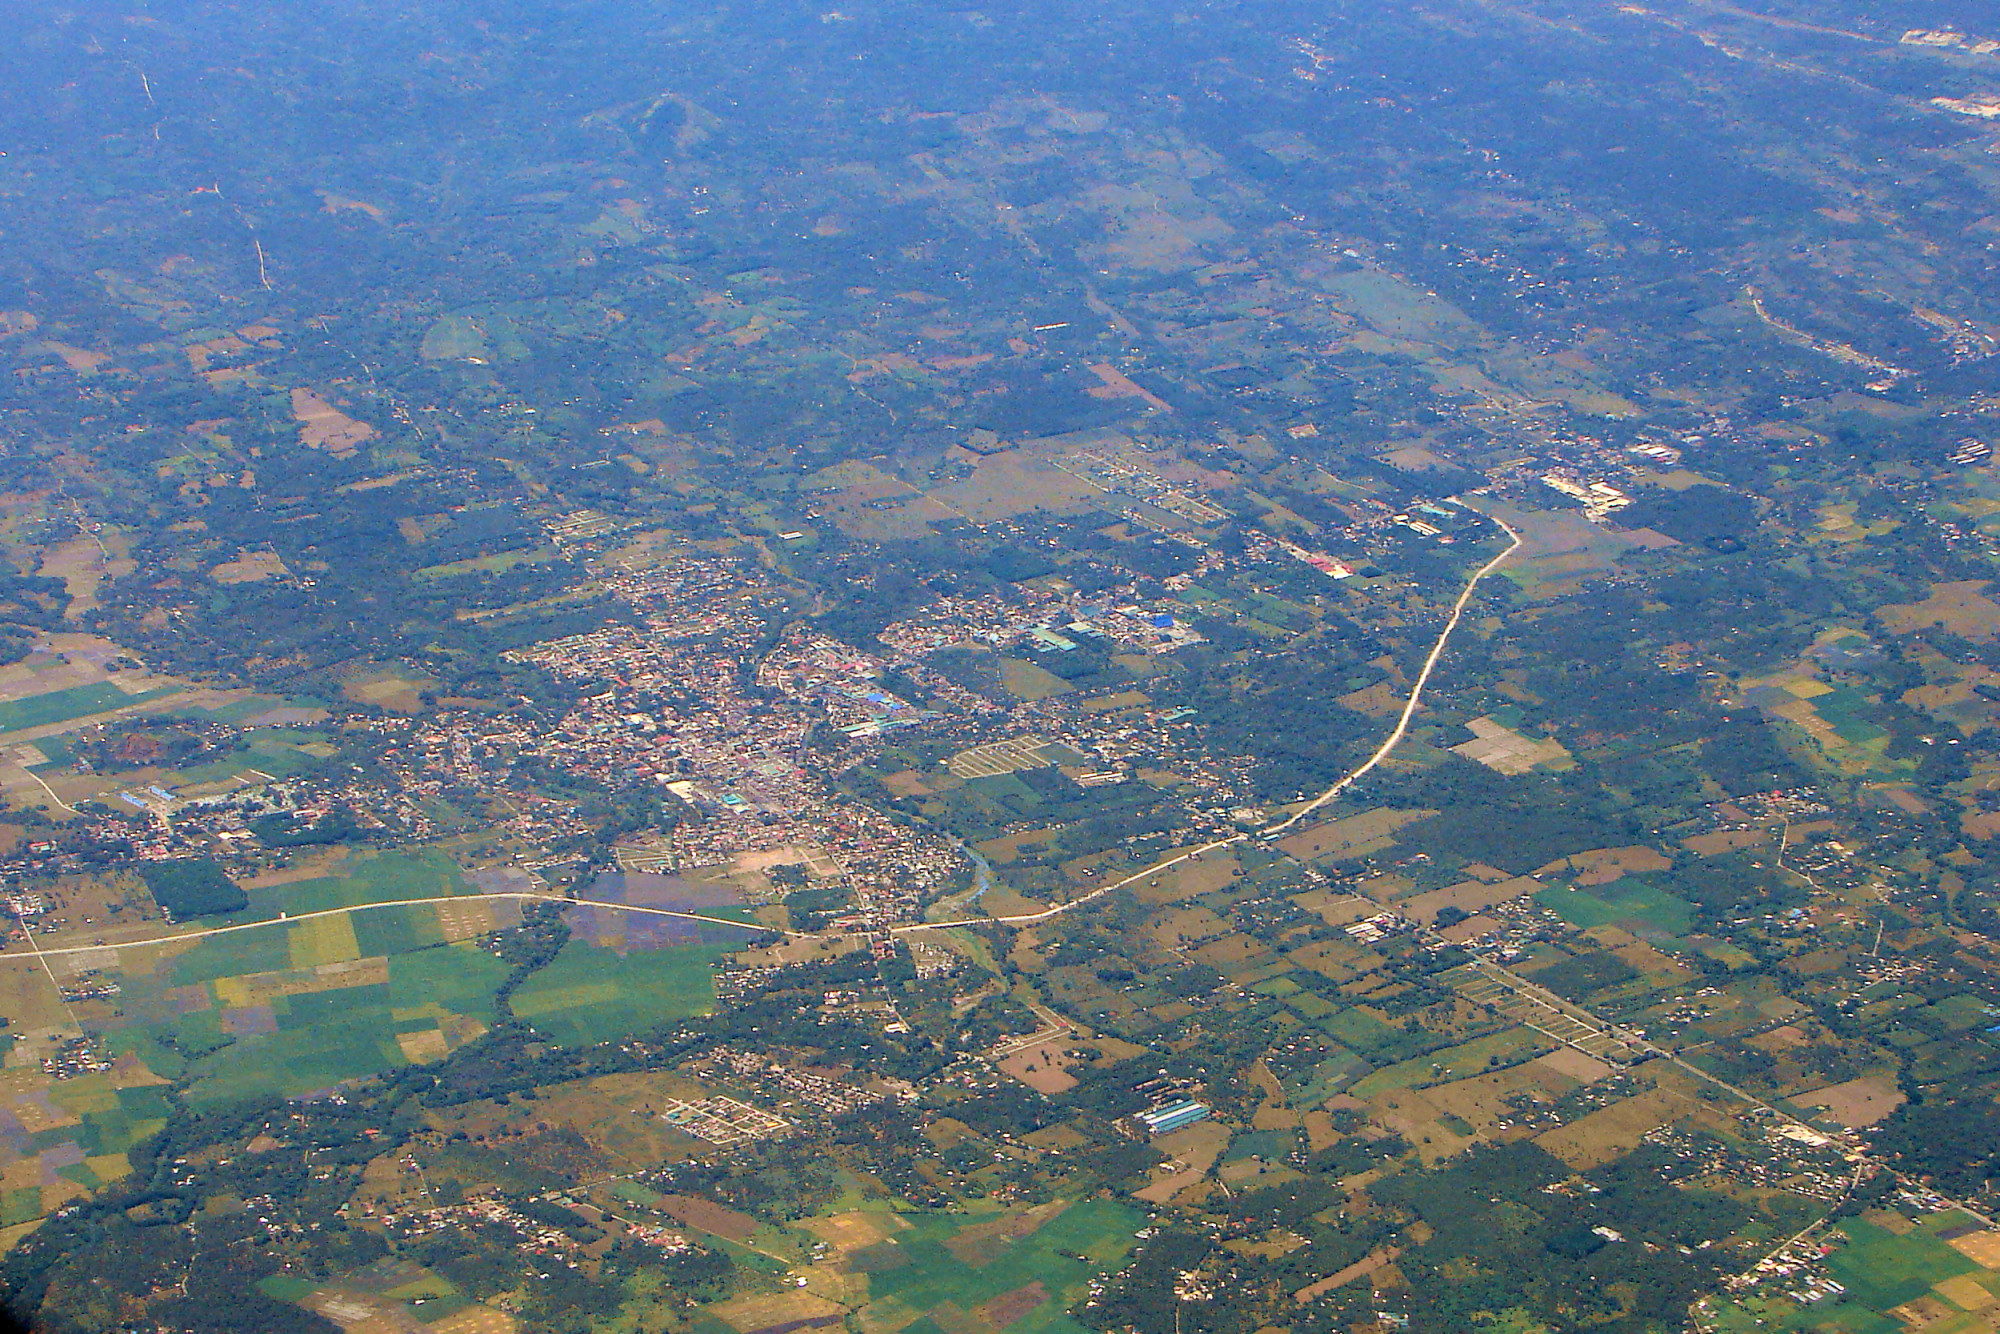
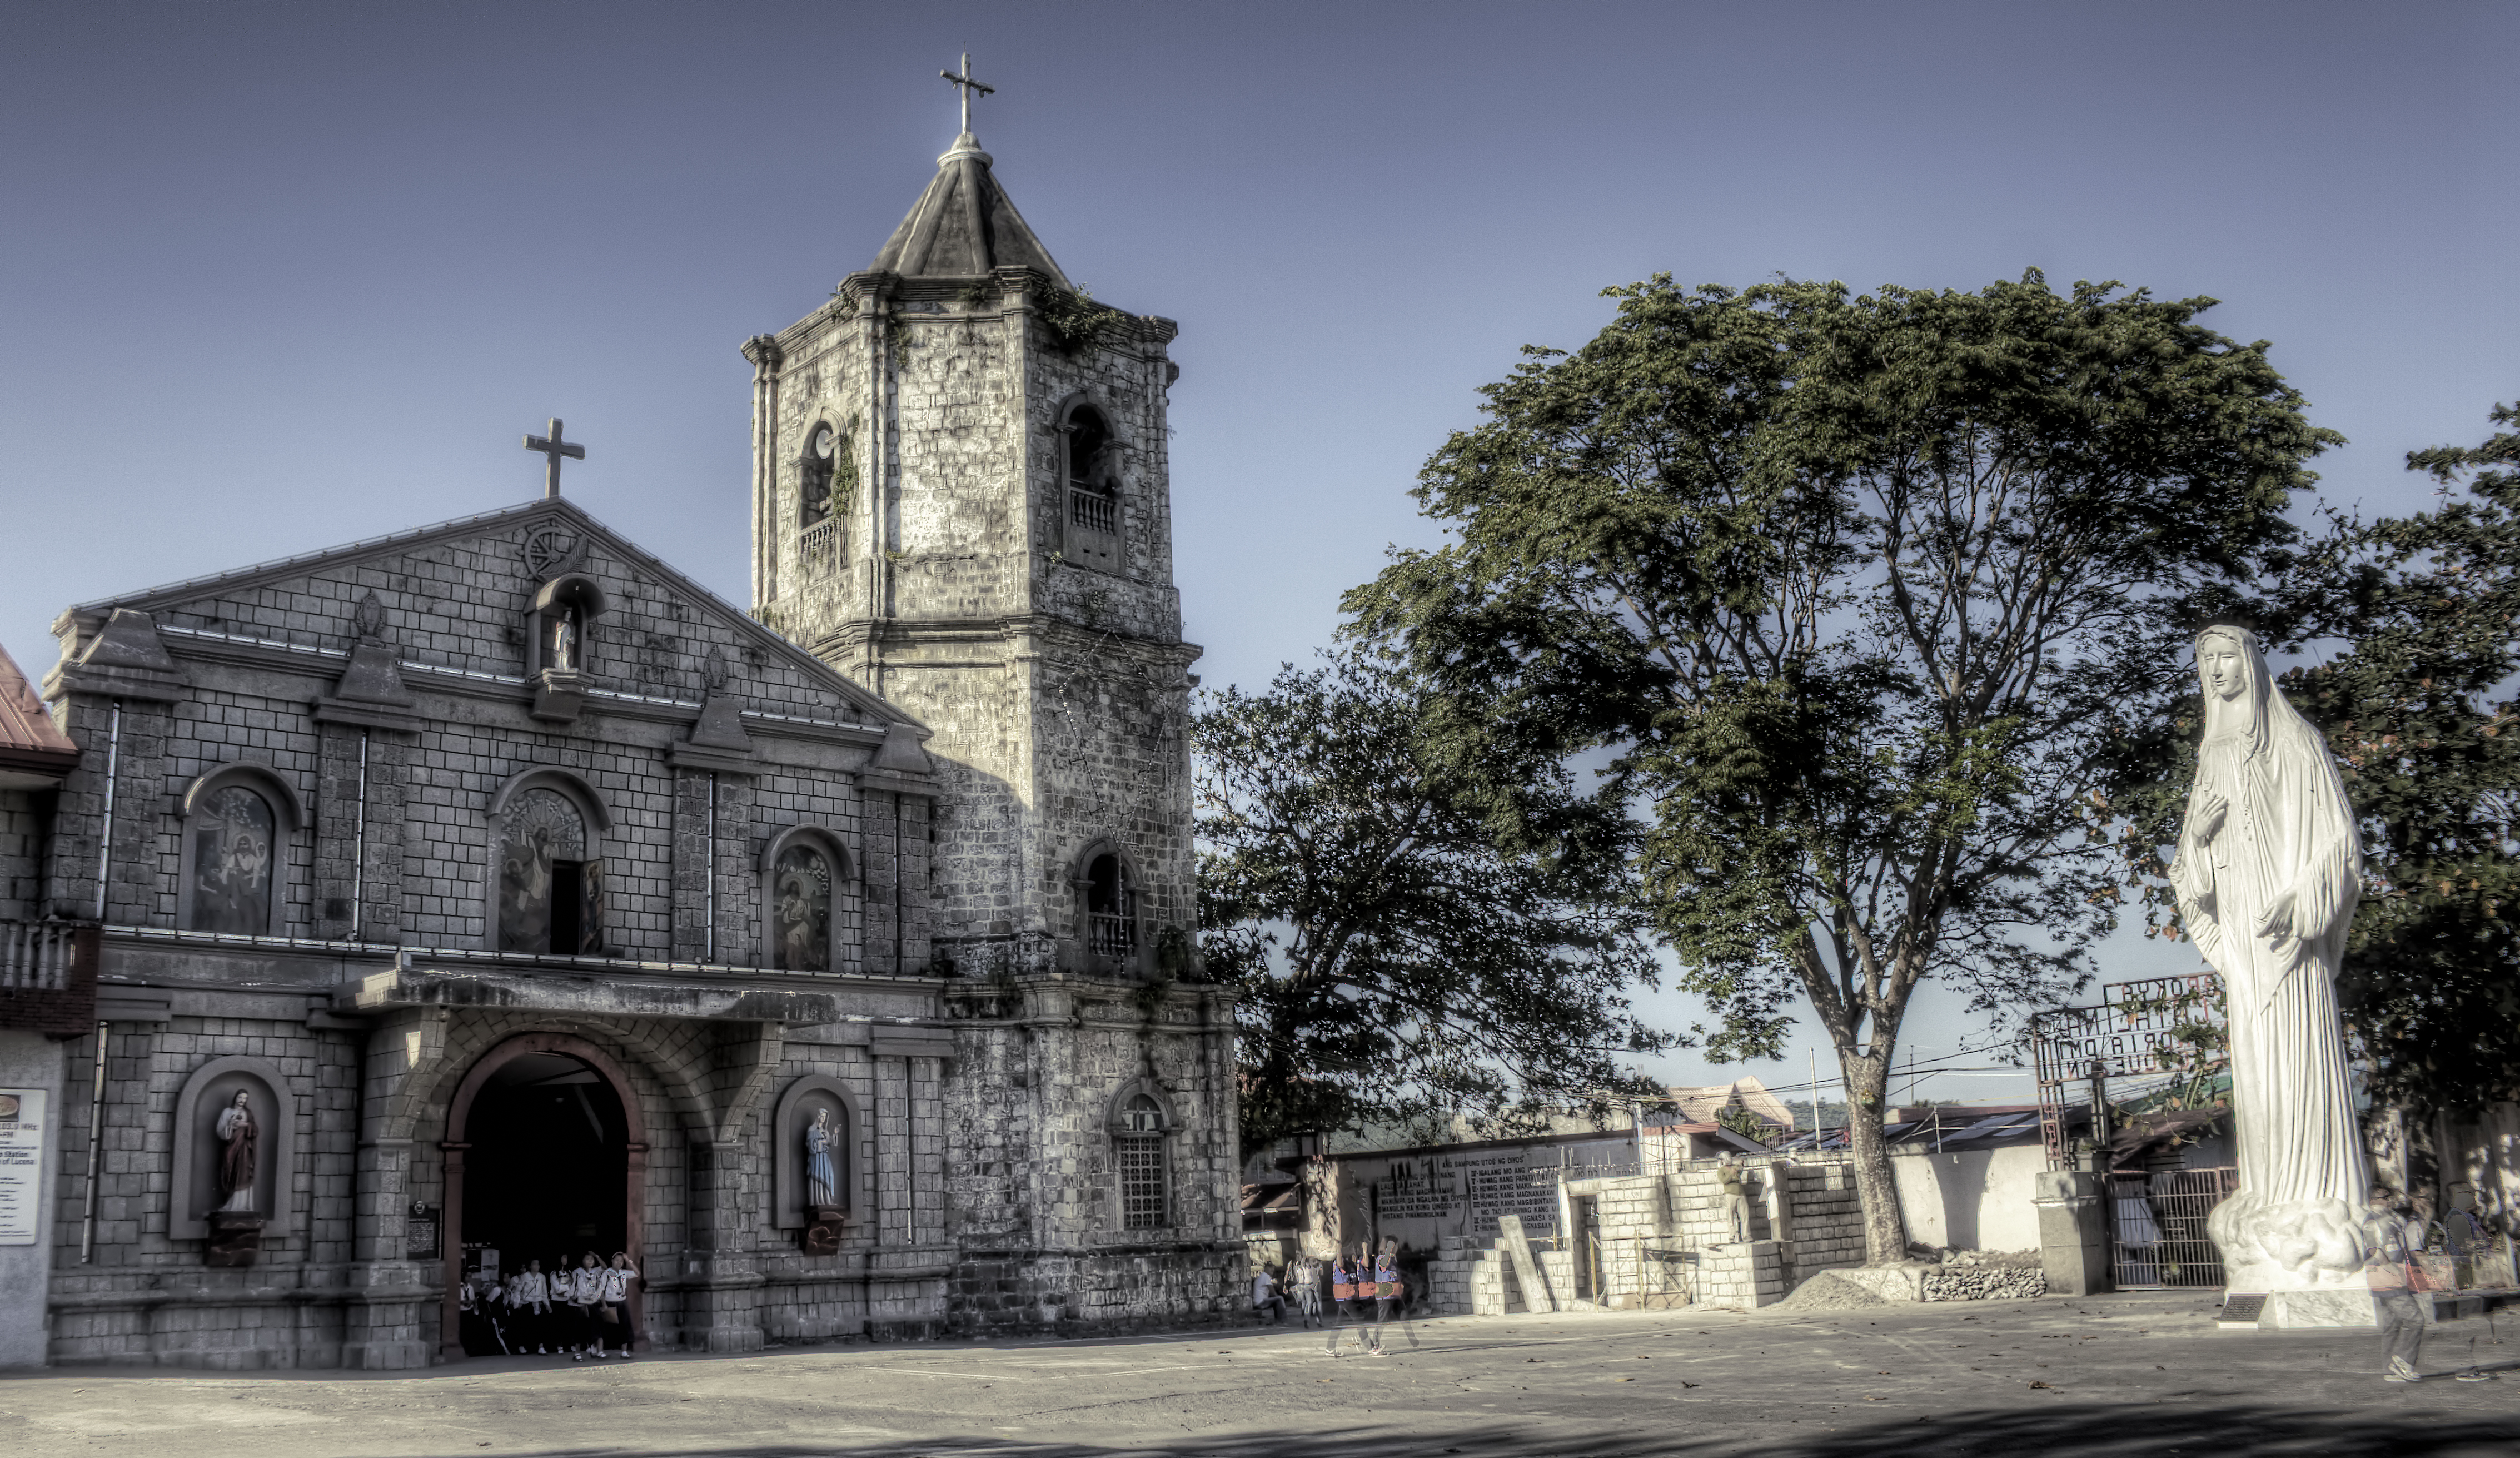
Lucena, Philippines
Lucena, officially the City of Lucena (Filipino: Lungsod ng Lucena), is the capital city of the province of Quezon, Philippines. According to the 2010 census, it has a population of 246,392 people.
Lucena, Philippines Wikipedia Page

About Our Data
The data on this page is estimated using a number of publicly available tools and resources. It is provided without warranty, and could contain inaccuracies. Use at your own risk.