Kmiecin Facts
| Area | 0.4 km² |
| Population | 577 |
| Male Population | 292 (50.6%) |
| Female Population | 285 (49.4%) |
| Population change (1975 to 2020) | +8.1% |
| Population change (2000 to 2020) | -9.0% |
| Median Age | 33.5 years (Male: 33.1, Female: 33.9) |
| Local Time | |
| Timezone | Central European Summer Time |
| Lat & Lng | 54.18896, 19.14840 |
Map of Kmiecin
Interactive Map
Kmiecin Population
Years 1975 to 2020
| Data | 1975 | 1990 | 2000 | 2015 | 2020 |
|---|---|---|---|---|---|
| Population | 534 | 669 | 634 | 595 | 577 |
| Population Density | 1,424 / km² | 1,784 / km² | 1,690.7 / km² | 1,586.7 / km² | 1,538.7 / km² |
Kmiecin Population change from 2000 to 2015
Decrease of 6.2% from year 2000 to 2015
| Location | Change since 1975 | Change since 1990 | Change since 2000 |
|---|---|---|---|
| Kmiecin | +11.4% | -11.1% | -6.2% |
| Pomeranian Voivodeship | +29.5% | +10.1% | +5.5% |
| Poland | +13% | +1.1% | +0.3% |
Kmiecin Median Age
Median Age: 33.5 years
| Location | Median Age | Median Age (Female) | Median Age (Male) |
|---|---|---|---|
| Kmiecin | 33.5 yrs | 33.9 yrs | 33.1 yrs |
| Pomeranian Voivodeship | 34.2 yrs | 34.7 yrs | 33.6 yrs |
| Poland | 34.9 yrs | 35.6 yrs | 34.3 yrs |
Kmiecin Population Density
Population Density: 1,539 / km²
| Location | Population | Area | Density |
|---|---|---|---|
| Kmiecin | 577 | 0.375 km² | 1,539 / km² |
| Pomeranian Voivodeship | 2.3 million | 18,306.3 km² | 125 / km² |
| Poland | 38.5 million | 312,592.3 km² | 123 / km² |
Kmiecin Historical and Projected Population
Estimated Population from 100 to 2100
- JRC (European Commission's Joint Research Centre) work on the GHS built-up grid
- CIESIN (Center for International Earth Science Information Network)
- [Link] Klein Goldewijk, K., Beusen, A., Doelman, J., and Stehfest, E.: Anthropogenic land use estimates for the Holocene – HYDE 3.2, Earth Syst. Sci. Data, 9, 927–953, https://doi.org/10.5194/essd-9-927-2017, 2017.
Human Development Index (HDI)
Statistic composite index of life expectancy, education, and per capita income.
Kmiecin CO2 Emissions
Carbon Dioxide (CO2) Emissions Per Capita in Tonnes Per Year
| Location | CO2 Emissions | CO2 Emissions Per Capita | CO2 Emissions Intensity |
|---|---|---|---|
| Kmiecin | 3,539 tn | 6.13 tn | 9,437.6 tons/km² |
| Pomeranian Voivodeship | 13,986,855 tn | 6.1 tn | 764 tons/km² |
| Poland | 230,825,573 tn | 5.99 tn | 738.4 tons/km² |
| 2013 CO2 emissions (tonnes/year) | 3,539 tn |
| 2013 CO2 emissions (tonnes/year) per capita | 6.13 tn |
| 2013 CO2 emissions intensity (tonnes/km²/year) | 9,437.6 tons/km² |
Natural Hazards Risk
Relative risk out of 10
| Hazard | Risk Level |
|---|---|
| Drought | Low (2) |
* Risk, particularly concerning flood or landslide, may not be for the entire area.
- Dilley, M., R.S. Chen, U. Deichmann, A.L. Lerner-Lam, M. Arnold, J. Agwe, P. Buys, O. Kjekstad, B. Lyon, and G. Yetman. 2005. Natural Disaster Hotspots: A Global Risk Analysis. Washington, D.C.: World Bank. https://doi.org/10.1596/0-8213-5930-4.
- Center for Hazards and Risk Research - CHRR - Columbia University, Center for International Earth Science Information Network - CIESIN - Columbia University, and International Research Institute for Climate and Society - IRI - Columbia University. 2005. Global Drought Hazard Frequency and Distribution. Palisades, NY: NASA Socioeconomic Data and Applications Center (SEDAC). https://doi.org/10.7927/H4VX0DFT.
Recent Nearby Earthquakes
Magnitude 3.0 and greater
| Date▼ | Time↕ | Magnitude↕ | Distance↕ | Depth↕ | Location↕ | Link |
|---|---|---|---|---|---|---|
| 9/21/04 | 1:32 PM | 4.8 | 87.8 km | 10,000 m | Poland | usgs.gov |
| 9/21/04 | 11:05 AM | 4.8 | 91.9 km | 4,100 m | Poland | usgs.gov |
| 2/23/95 | 8:42 AM | 4 | 58.8 km | 10,000 m | Poland | usgs.gov |
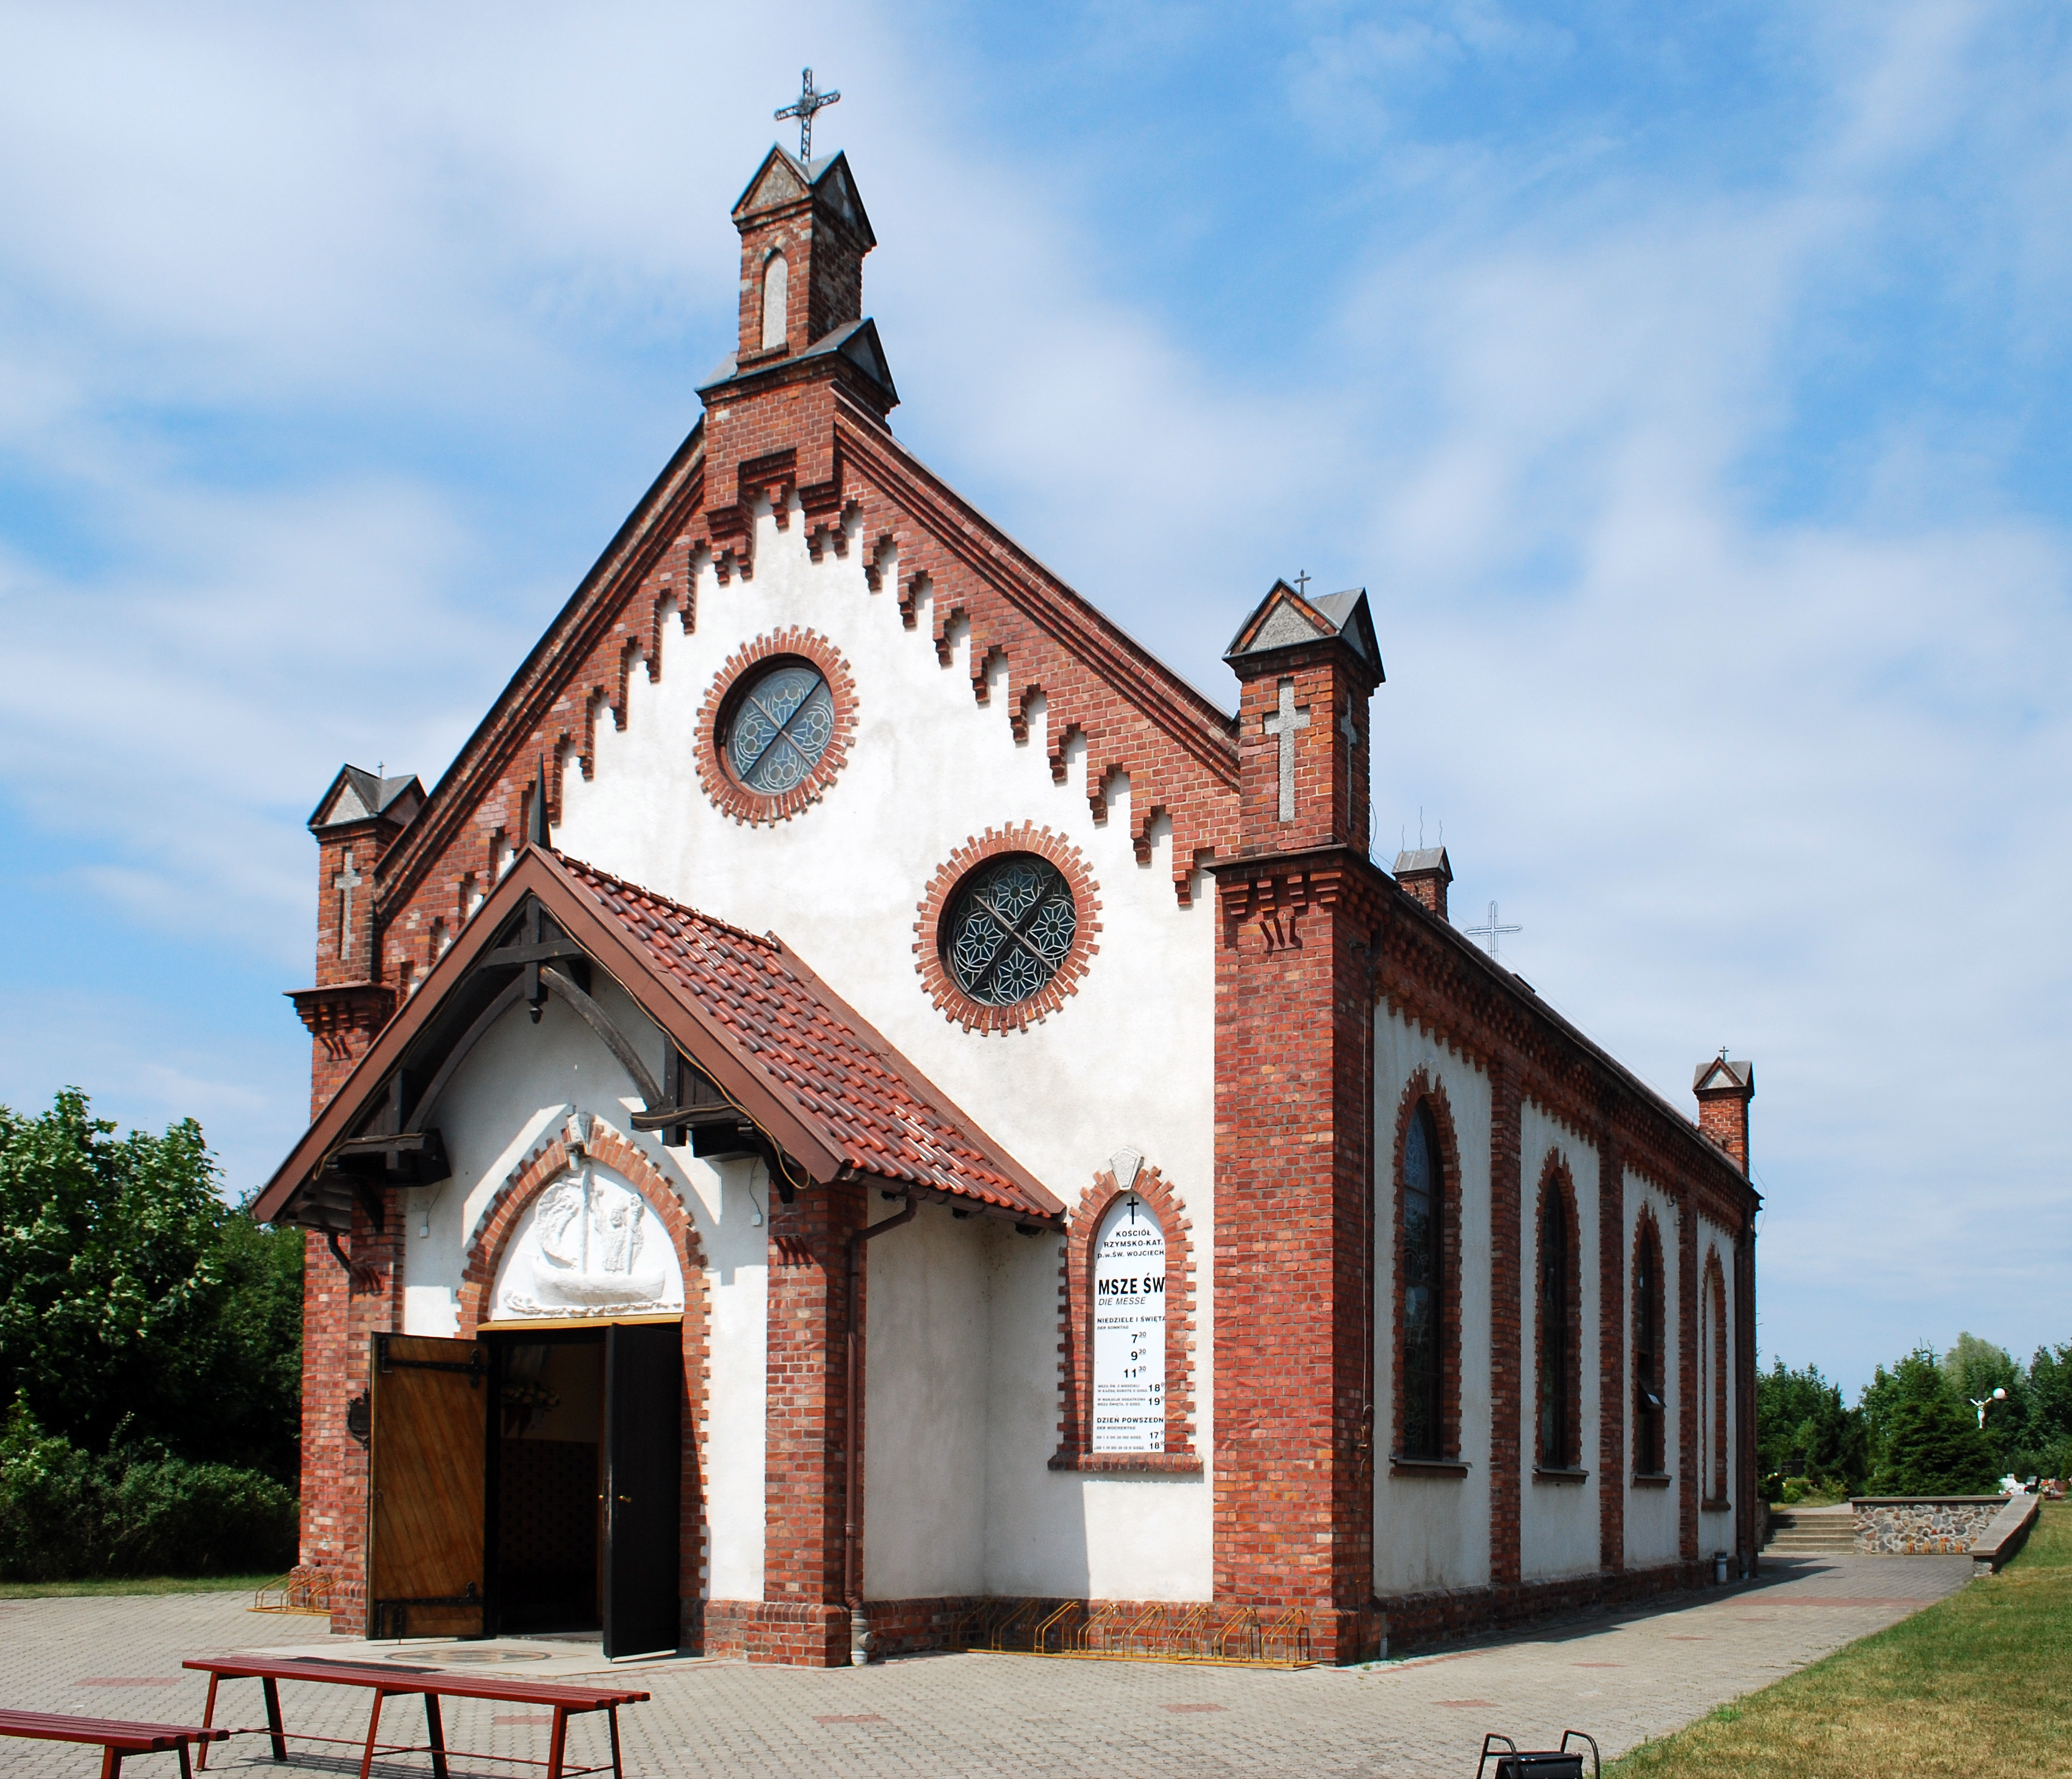
Kmiecin
Kmiecin [ˈkmjɛt͡ɕin] (German: Fürstenau ) is a village in the administrative district of Gmina Nowy Dwór Gdański, within Nowy Dwór Gdański County, Pomeranian Voivodeship, in northern Poland. It lies approximately 4 kilometres (2 mi) south-east of Now..
Kmiecin Wikipedia Page

About Our Data
The data on this page is estimated using a number of publicly available tools and resources. It is provided without warranty, and could contain inaccuracies. Use at your own risk.