Industries
Business Distribution by Industry in Moryń
| Industry Description | Number of Establishments | Average Google Rating |
|---|---|---|
| Other accommodation | 10 | 4.4 |
| Shopping | 5 | 3.7 |
Moryń Facts
| Area | 0.7 km² |
| Population | 807 |
| Male Population | 405 (50.1%) |
| Female Population | 402 (49.9%) |
| Population change (1975 to 2020) | -29.4% |
| Population change (2000 to 2020) | -21.7% |
| Median Age | 34.8 years (Male: 34.5, Female: 35) |
| Area Codes | 91 |
| Local Time | |
| Timezone | Central European Summer Time |
| Lat & Lng | 52.85769, 14.39297 |
| Postal Codes | 74-503 |
Map of Moryń
Interactive Map
Moryń Population
Years 1975 to 2020
| Data | 1975 | 1990 | 2000 | 2015 | 2020 |
|---|---|---|---|---|---|
| Population | 1,143 | 1,134 | 1,031 | 834 | 807 |
| Population Density | 1,662.5 / km² | 1,649.5 / km² | 1,499.6 / km² | 1,213.1 / km² | 1,173.8 / km² |
Sources: JRC (European Commission's Joint Research Centre) work on the GHS built-up grid
Moryń Population change from 2000 to 2015
Decrease of 19.1% from year 2000 to 2015
| Location | Change since 1975 | Change since 1990 | Change since 2000 |
|---|---|---|---|
| Moryń | -27% | -26.5% | -19.1% |
| West Pomeranian Voivodeship | +16.4% | +2.5% | +0.9% |
| Poland | +13% | +1.1% | +0.3% |
Sources: JRC (European Commission's Joint Research Centre) work on the GHS built-up grid
Moryń Median Age
Median Age: 34.8 years
| Location | Median Age | Median Age (Female) | Median Age (Male) |
|---|---|---|---|
| Moryń | 34.8 yrs | 35 yrs | 34.5 yrs |
| West Pomeranian Voivodeship | 35.6 yrs | 36.2 yrs | 35 yrs |
| Poland | 34.9 yrs | 35.6 yrs | 34.3 yrs |
Sources: CIESIN (Center for International Earth Science Information Network)
Moryń Population Density
Population Density: 1,174 / km²
| Location | Population | Area | Density |
|---|---|---|---|
| Moryń | 807 | 0.688 km² | 1,174 / km² |
| West Pomeranian Voivodeship | 1.7 million | 22,897.6 km² | 75 / km² |
| Poland | 38.5 million | 312,592.3 km² | 123 / km² |
Sources: JRC (European Commission's Joint Research Centre) work on the GHS built-up grid
Moryń Historical and Projected Population
Estimated Population from 0 to 2100
Sources:
- JRC (European Commission's Joint Research Centre) work on the GHS built-up grid
- CIESIN (Center for International Earth Science Information Network)
- [Link] Klein Goldewijk, K., Beusen, A., Doelman, J., and Stehfest, E.: Anthropogenic land use estimates for the Holocene – HYDE 3.2, Earth Syst. Sci. Data, 9, 927–953, https://doi.org/10.5194/essd-9-927-2017, 2017.
Area Codes
Percentage Area Codes used by businesses in Moryń
Human Development Index (HDI)
Statistic composite index of life expectancy, education, and per capita income.
Source: [Link] Kummu, M., Taka, M. &Guillaume, J. Gridded global datasets for Gross Domestic Product and Human Development Index over 1990–2015. Sci Data 5, 180004 (2018) doi:10.1038/sdata.2018.4
Moryń CO2 Emissions
Carbon Dioxide (CO2) Emissions Per Capita in Tonnes Per Year
| Location | CO2 Emissions | CO2 Emissions Per Capita | CO2 Emissions Intensity |
|---|---|---|---|
| Moryń | 4,962 tn | 6.15 tn | 7,218 tons/km² |
| West Pomeranian Voivodeship | 9,992,533 tn | 5.82 tn | 436.4 tons/km² |
| Poland | 230,825,573 tn | 5.99 tn | 738.4 tons/km² |
Sources: [Link] Moran, D., Kanemoto K; Jiborn, M., Wood, R., Többen, J., and Seto, K.C. (2018) Carbon footprints of 13,000 cities. Environmental Research Letters DOI: 10.1088/1748-9326/aac72a
Moryń CO2 Emissions
| 2013 CO2 emissions (tonnes/year) | 4,962 tn |
| 2013 CO2 emissions (tonnes/year) per capita | 6.15 tn |
| 2013 CO2 emissions intensity (tonnes/km²/year) | 7,218 tons/km² |
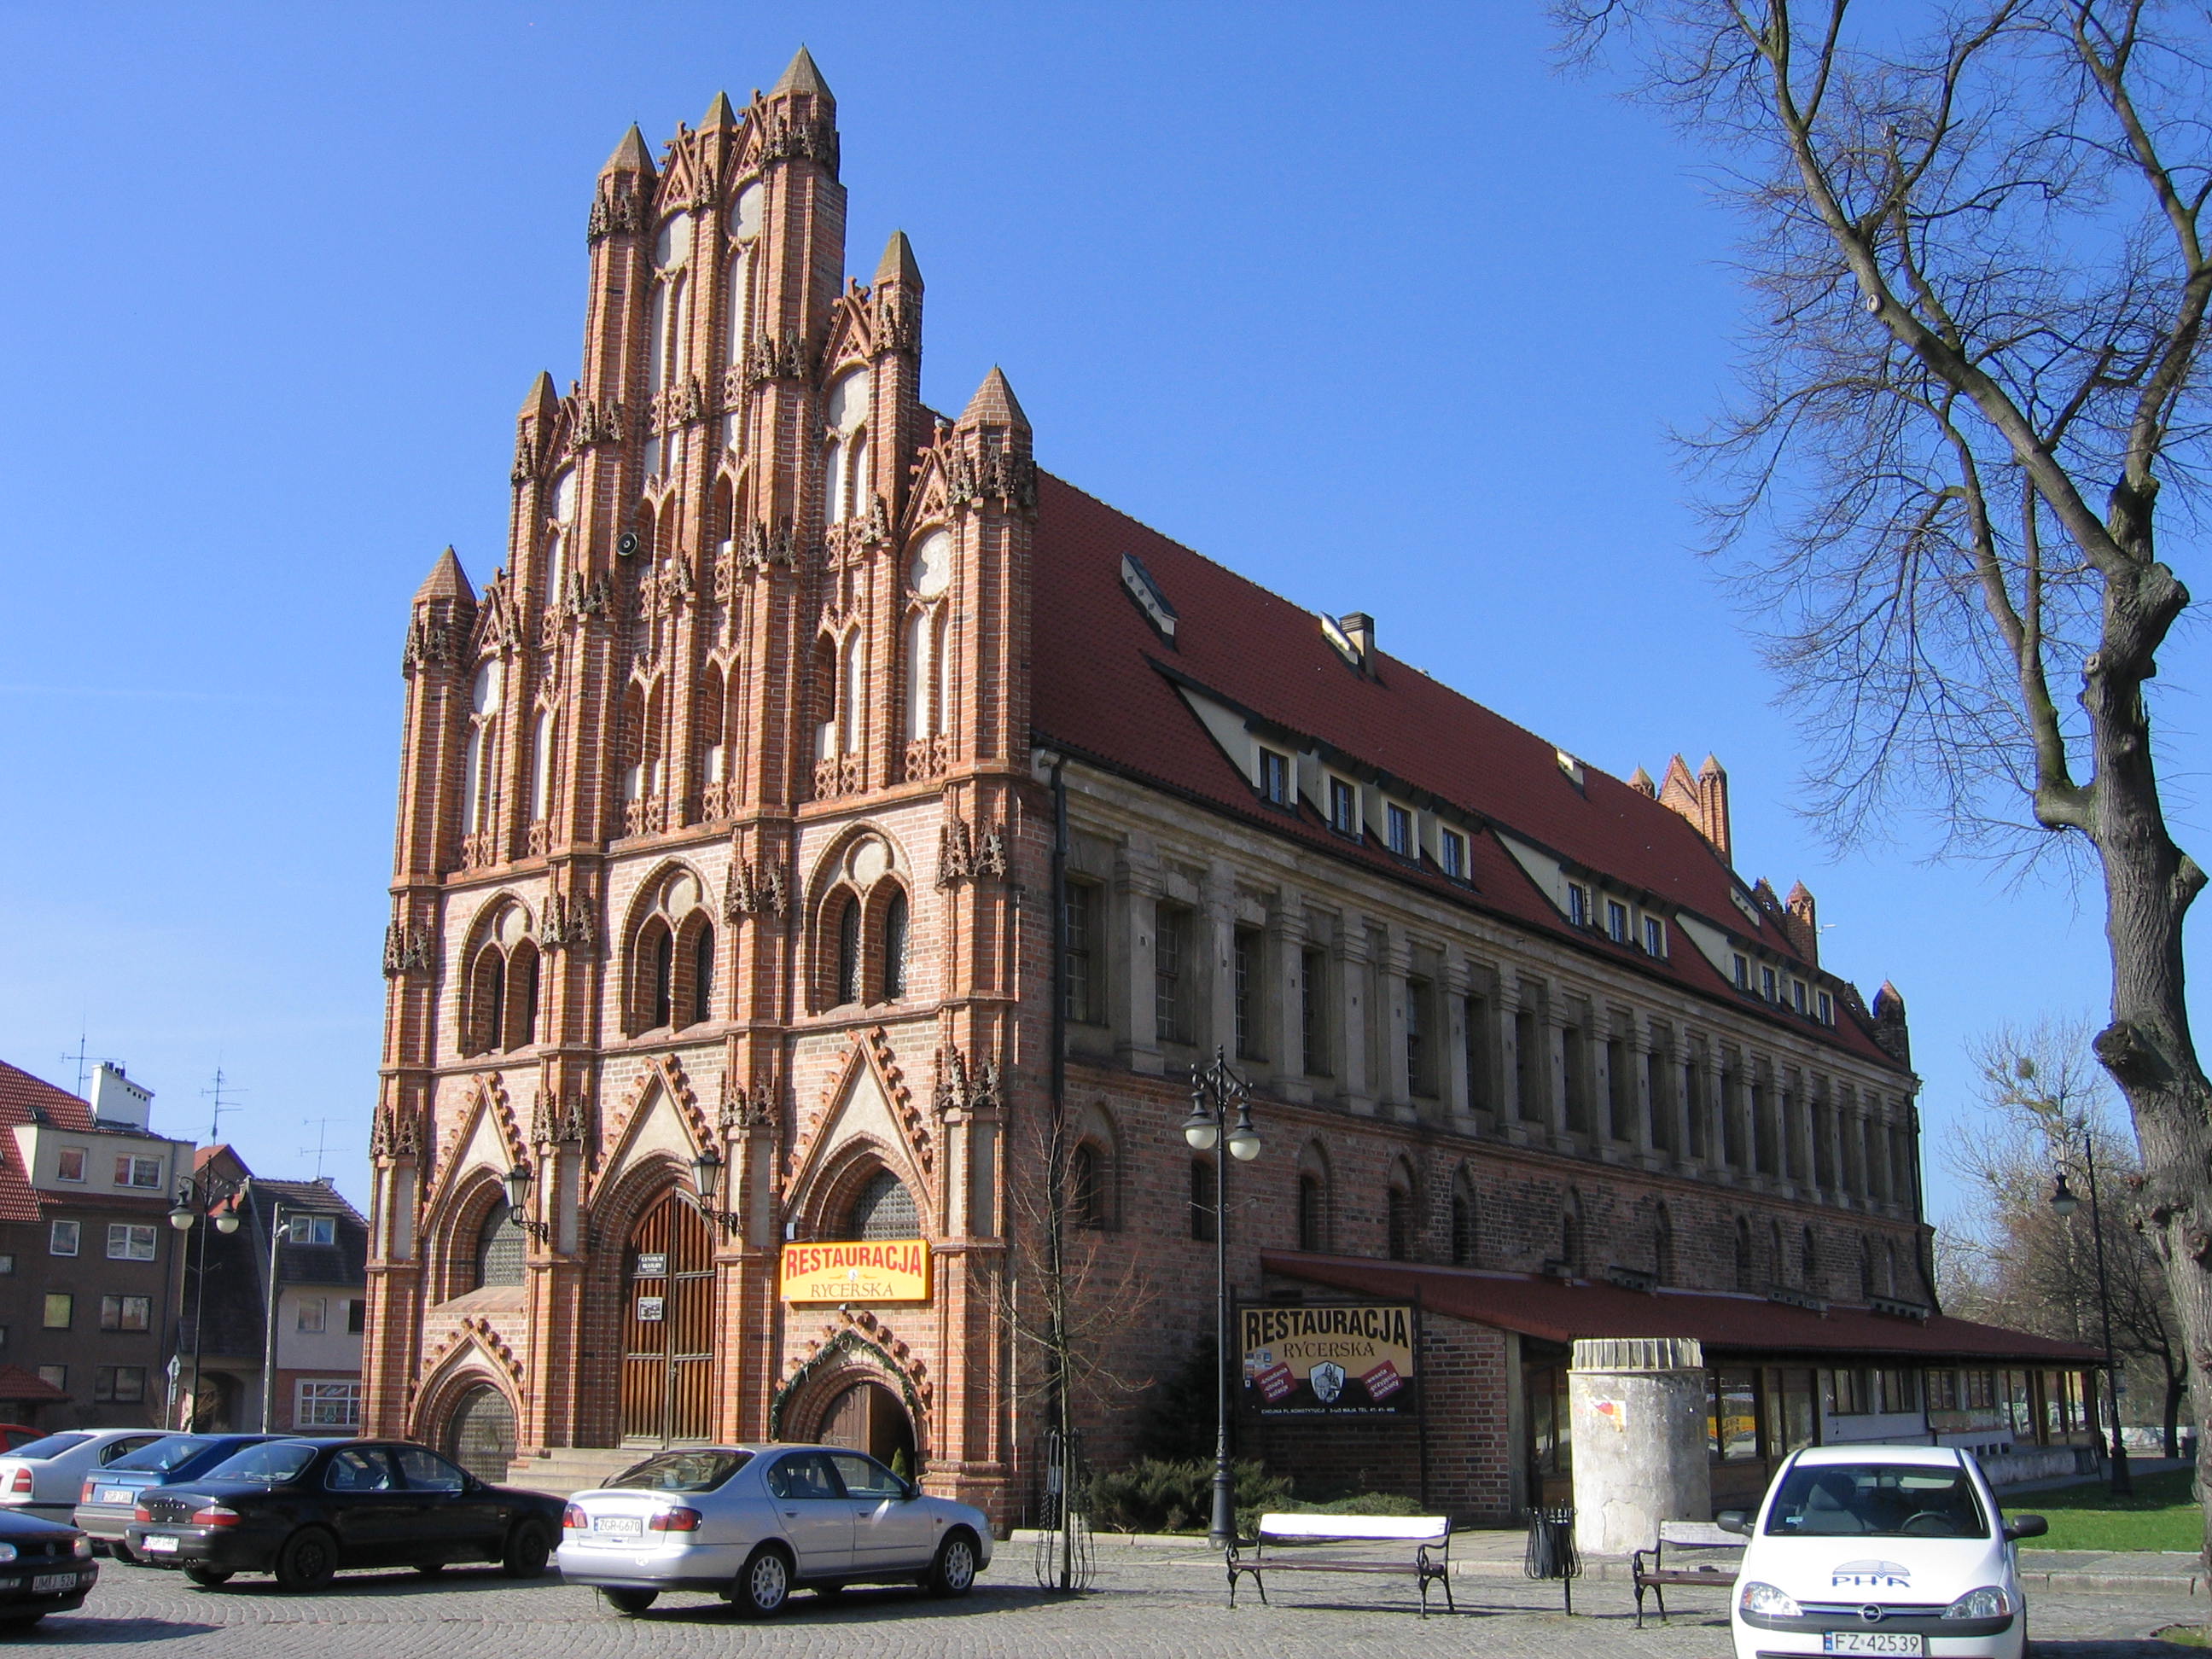
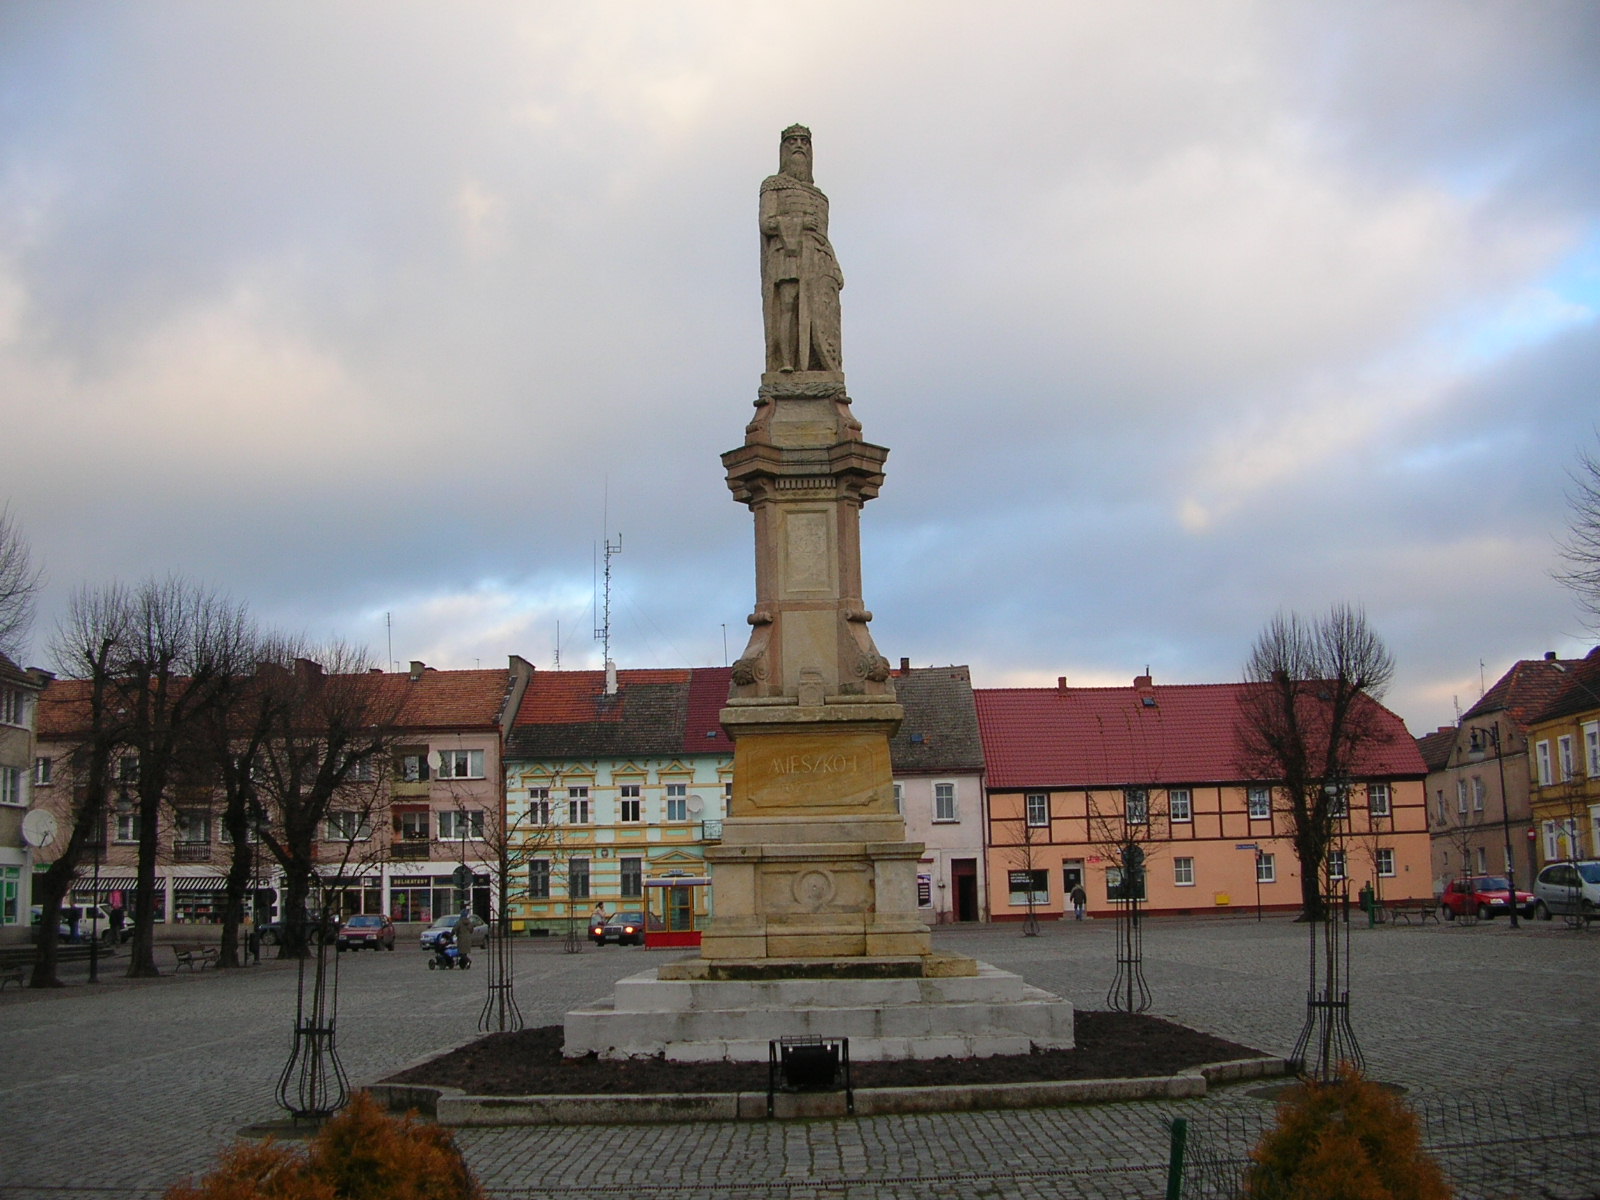
Moryń
Moryń [ˈmɔrɨɲ] (German: Mohrin) is a town in Gryfino County, West Pomeranian Voivodeship, in northwestern Poland.
Moryń Wikipedia Page

About Our Data
The data on this page is estimated using a number of publicly available tools and resources. It is provided without warranty, and could contain inaccuracies. Use at your own risk.