Categories in Murcki
Industries
Business Distribution by Industry in Murcki
| Industry Description | Number of Establishments |
|---|---|
| Real estate | 22 |
| Electronics stores | 22 |
| Shopping | 19 |
| Construction of buildings | 15 |
| Health and medical | 14 |
| Lawyers legal | 13 |
| Accountants | 13 |
| Corporate management | 12 |
| Beauty salons | 12 |
| Advertising and marketing | 10 |
| Technical construction services | 8 |
| Education other | 7 |
| Banks | 7 |
Murcki Facts
| Area | 55.2 km² |
| Population | 89,899 |
| Male Population | 44,166 (49.1%) |
| Female Population | 45,733 (50.9%) |
| Population change (1975 to 2020) | -10.9% |
| Population change (2000 to 2020) | -9.2% |
| Median Age | 37.2 years (Male: 36.1, Female: 38.3) |
| GDP per capita (PPP) | $35,752 (2022) |
| Local Time | |
| Timezone | Central European Summer Time |
| Lat & Lng | 50.20036, 19.04351 |
Map of Murcki
Interactive Map
Murcki Population
Years 1975 to 2030
| Data | 1975 | 1990 | 2000 | 2015 | 2020 | 2025* | 2030* |
|---|---|---|---|---|---|---|---|
| Population | 100,871 | 105,717 | 99,001 | 90,047 | 89,899 | 91,933 | 89,661 |
| Population Density | 1,827.8 / km² | 1,915.6 / km² | 1,793.9 / km² | 1,631.7 / km² | 1,629 / km² | 1,665.8 / km² | 1,624.7 / km² |
Murcki Population change from 2000 to 2020
Decrease of 9.2% from year 2000 to 2020
| Location | Change since 1975 | Change since 1990 | Change since 2000 |
|---|---|---|---|
| Murcki | -10.9% | -15% | -9.2% |
| Silesian Voivodeship | — | — | — |
| Poland | — | — | — |
Murcki Median Age
Median Age: 37.2 years
| Location | Median Age | Median Age (Female) | Median Age (Male) |
|---|---|---|---|
| Murcki | 37.2 yrs | 38.3 yrs | 36.1 yrs |
| Silesian Voivodeship | 36.3 yrs | 37.1 yrs | 35.5 yrs |
| Poland | 34.9 yrs | 35.6 yrs | 34.3 yrs |
Murcki Population Density
Population Density: 1,629 / km²
| Location | Population | Area | Density |
|---|---|---|---|
| Murcki | 89,899 | 55.2 km² | 1,629 / km² |
| Silesian Voivodeship | 4.6 million | 12,330.5 km² | 370 / km² |
| Poland | 38.5 million | 312,592.3 km² | 123 / km² |
Murcki Historical and Projected Population
Estimated Population from 300 to 2100
- JRC (European Commission's Joint Research Centre) work on the GHS built-up grid
- CIESIN (Center for International Earth Science Information Network)
- [Link] Klein Goldewijk, K., Beusen, A., Doelman, J., and Stehfest, E.: Anthropogenic land use estimates for the Holocene – HYDE 3.2, Earth Syst. Sci. Data, 9, 927–953, https://doi.org/10.5194/essd-9-927-2017, 2017.
Human Development Index (HDI)
Statistic composite index of life expectancy, education, and per capita income.
Murcki Gross Domestic Product (GDP)
GDP per capita, PPP (constant 2017 international $)
| Data | 1990 | 1995 | 2000 | 2005 | 2010 | 2015 | 2020 | 2022 |
|---|---|---|---|---|---|---|---|---|
| GDP per capita | $10,326 | $12,076 | $14,723 | $19,135 | $22,741 | $26,151 | $30,269 | $35,752 |
| Total GDP | $1.2B | $1.4B | $1.6B | $1.9B | $2.2B | $2.4B | $2.6B | $3.1B |
Murcki CO2 Emissions
Carbon Dioxide (CO2) Emissions Per Capita in Tonnes Per Year
| Location | CO2 Emissions | CO2 Emissions Per Capita | CO2 Emissions Intensity |
|---|---|---|---|
| Murcki | 612,383 tn | 6.81 tn | 11,096.4 tons/km² |
| Silesian Voivodeship | 28,972,879 tn | 6.36 tn | 2,349.7 tons/km² |
| Poland | 230,825,573 tn | 5.99 tn | 738.4 tons/km² |
| 2013 CO2 emissions (tonnes/year) | 612,383 tn |
| 2013 CO2 emissions (tonnes/year) per capita | 6.81 tn |
| 2013 CO2 emissions intensity (tonnes/km²/year) | 11,096.4 tons/km² |
Natural Hazards Risk
Relative risk out of 10
| Hazard | Risk Level |
|---|---|
| Flood | High (9) |
| Earthquake | Low (2) |
* Risk, particularly concerning flood or landslide, may not be for the entire area.
- Dilley, M., R.S. Chen, U. Deichmann, A.L. Lerner-Lam, M. Arnold, J. Agwe, P. Buys, O. Kjekstad, B. Lyon, and G. Yetman. 2005. Natural Disaster Hotspots: A Global Risk Analysis. Washington, D.C.: World Bank. https://doi.org/10.1596/0-8213-5930-4.
- Center for Hazards and Risk Research - CHRR - Columbia University, Center for International Earth Science Information Network - CIESIN - Columbia University. 2005. Global Flood Hazard Frequency and Distribution. Palisades, NY: NASA Socioeconomic Data and Applications Center (SEDAC). https://doi.org/10.7927/H4668B3D.
- Center for Hazards and Risk Research - CHRR - Columbia University, Center for International Earth Science Information Network - CIESIN - Columbia University. 2005. Global Earthquake Hazard Distribution - Peak Ground Acceleration. Palisades, NY: NASA Socioeconomic Data and Applications Center (SEDAC). https://doi.org/10.7927/H4BZ63ZS.
Recent Nearby Earthquakes
Magnitude 3.0 and greater
| Date▼ | Time↕ | Magnitude↕ | Distance↕ | Depth↕ | Location↕ | Link |
|---|---|---|---|---|---|---|
| 4/17/15 | 10:16 PM | 4.3 | 11.9 km | 5,000 m | 2km ESE of Ruda Slaska, Poland | usgs.gov |
| 12/15/08 | 1:46 PM | 3.5 | 16.2 km | 1,000 m | Poland | usgs.gov |
| 11/19/08 | 12:45 AM | 3.2 | 2.9 km | 1,000 m | Poland | usgs.gov |
| 2/23/08 | 6:32 PM | 3.1 | 14.4 km | 5,000 m | Poland | usgs.gov |
| 2/14/08 | 3:49 PM | 3.1 | 12.9 km | 5,000 m | Poland | usgs.gov |
| 1/16/08 | 10:21 AM | 3 | 13 km | 5,000 m | Poland | usgs.gov |
| 5/4/07 | 3:42 PM | 3 | 5.3 km | 5,000 m | Poland | usgs.gov |
| 4/25/07 | 8:58 AM | 3 | 12.7 km | 5,000 m | Poland | usgs.gov |
| 12/16/06 | 2:30 AM | 3.2 | 3.4 km | 5,000 m | Poland | usgs.gov |
| 12/19/05 | 2:32 AM | 3.2 | 4 km | 1,000 m | Poland | usgs.gov |
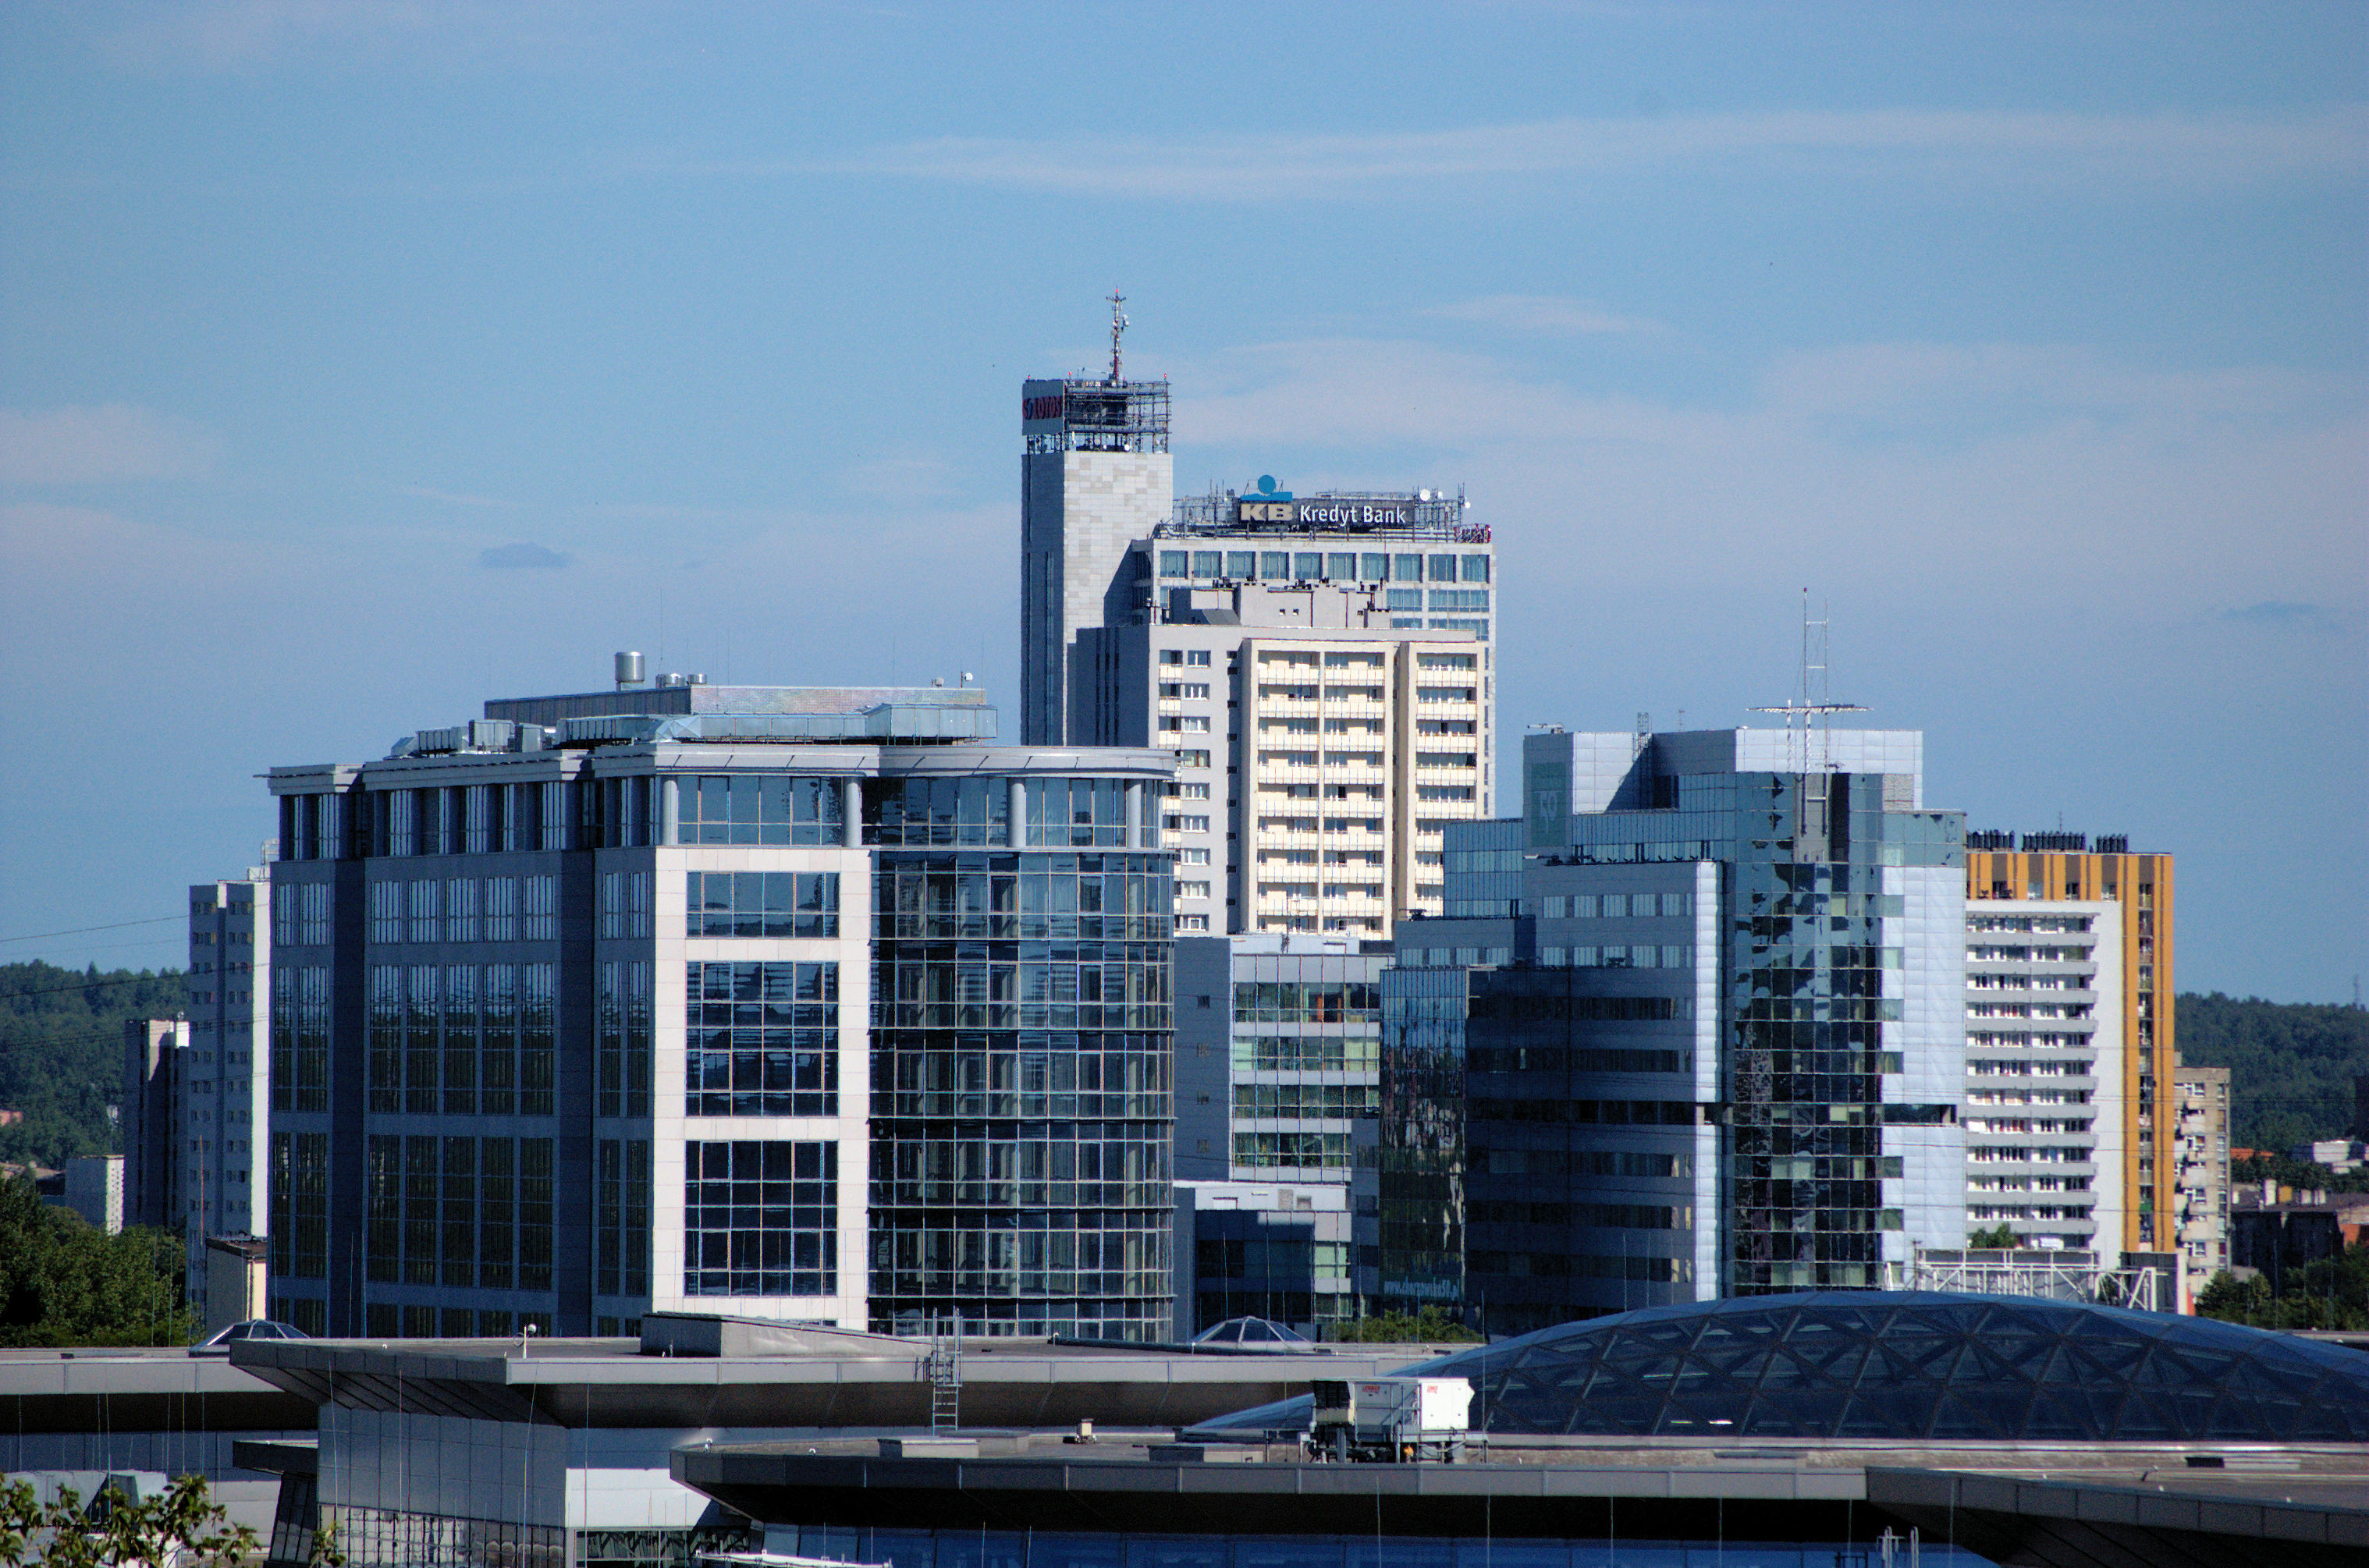
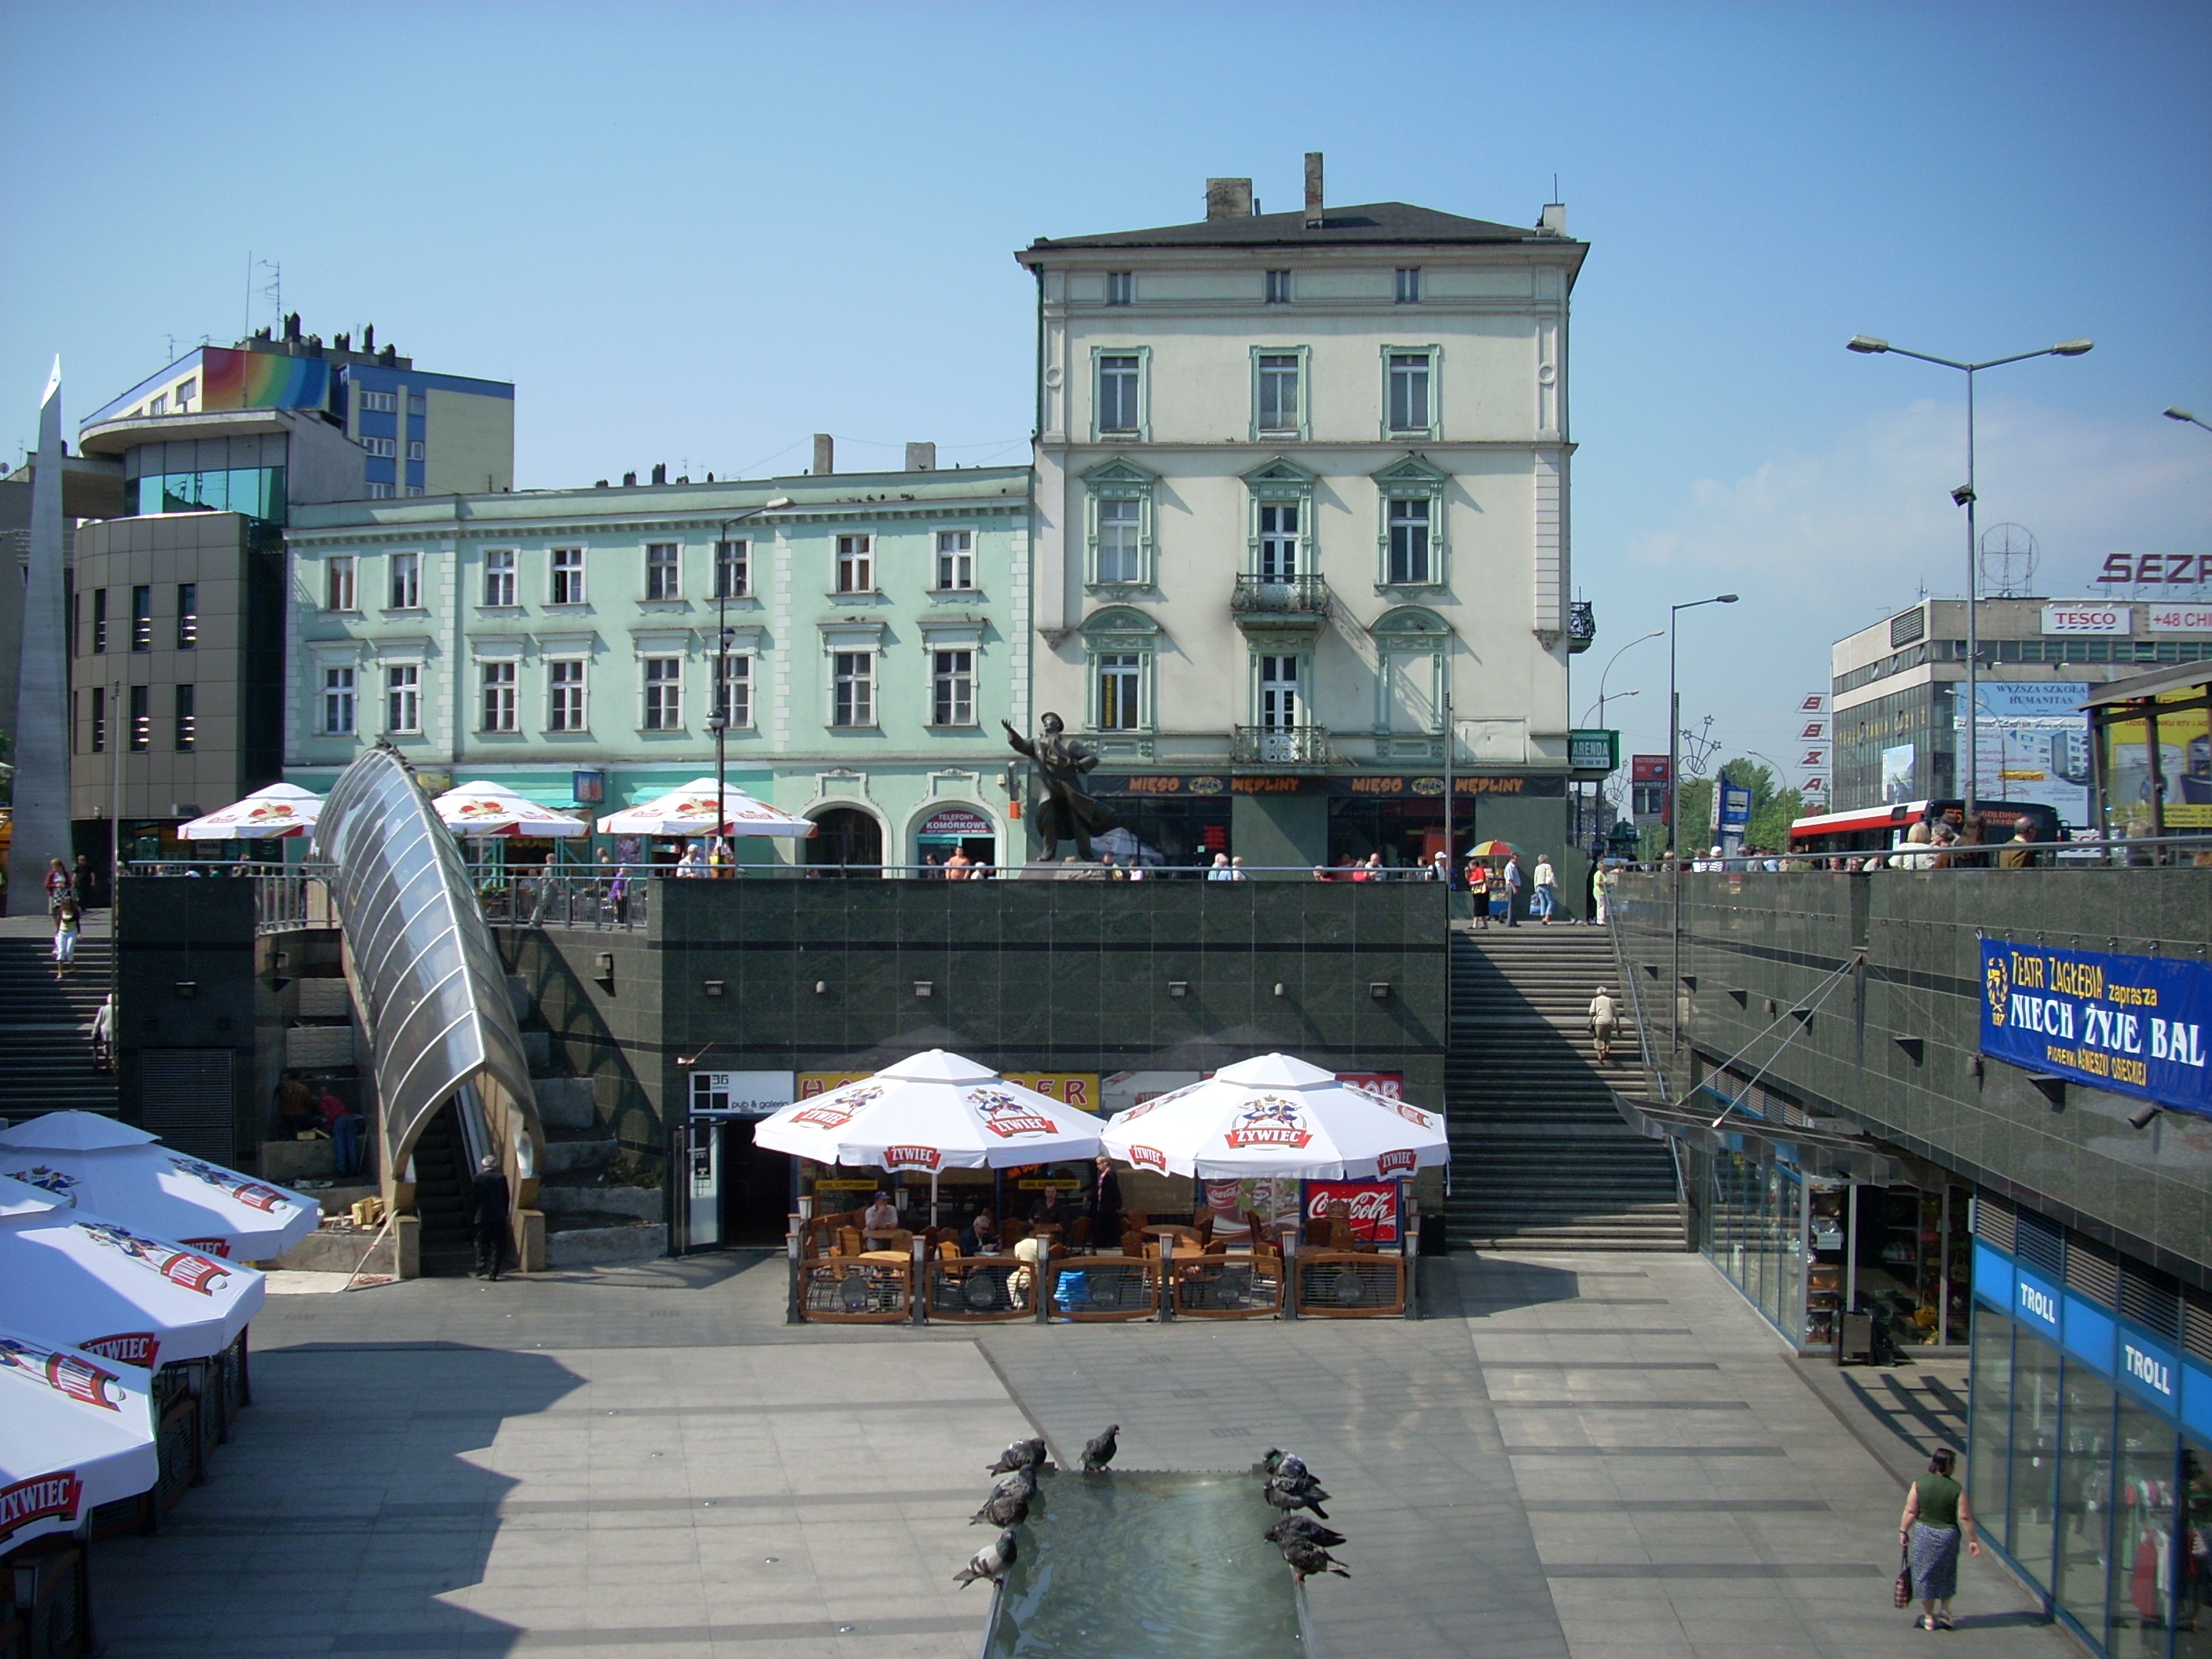
Murcki
Murcki (German: Emanuelssegen) is a district of Katowice. It has an area of 41,53 km2 and in 2007 had 5,796 inhabitants.
Murcki Wikipedia Page

About Our Data
The data on this page is estimated using a number of publicly available tools and resources. It is provided without warranty, and could contain inaccuracies. Use at your own risk.