Industries
Business Distribution by Industry in Targanice
Targanice Facts
| Area | 0.9 km² |
| Population | 1,581 |
| Male Population | 795 (50.3%) |
| Female Population | 786 (49.7%) |
| Population change (1975 to 2020) | -10.3% |
| Population change (2000 to 2020) | -5.6% |
| Median Age | 34 years (Male: 33.5, Female: 34.6) |
| Local Time | |
| Timezone | Central European Summer Time |
| Lat & Lng | 49.80575, 19.32444 |
Map of Targanice
Interactive Map
Targanice Population
Years 1975 to 2020
| Data | 1975 | 1990 | 2000 | 2015 | 2020 |
|---|---|---|---|---|---|
| Population | 1,762 | 1,694 | 1,674 | 1,616 | 1,581 |
| Population Density | 2,013.7 / km² | 1,936 / km² | 1,913.1 / km² | 1,846.9 / km² | 1,806.9 / km² |
Targanice Population change from 2000 to 2015
Decrease of 3.5% from year 2000 to 2015
| Location | Change since 1975 | Change since 1990 | Change since 2000 |
|---|---|---|---|
| Targanice | -8.3% | -4.6% | -3.5% |
| Lesser Poland Voivodeship | +24.2% | +6.6% | +3.2% |
| Poland | +13% | +1.1% | +0.3% |
Targanice Median Age
Median Age: 34 years
| Location | Median Age | Median Age (Female) | Median Age (Male) |
|---|---|---|---|
| Targanice | 34 yrs | 34.6 yrs | 33.5 yrs |
| Lesser Poland Voivodeship | 33.8 yrs | 34.3 yrs | 33.2 yrs |
| Poland | 34.9 yrs | 35.6 yrs | 34.3 yrs |
Targanice Population Density
Population Density: 1,807 / km²
| Location | Population | Area | Density |
|---|---|---|---|
| Targanice | 1,581 | 0.875 km² | 1,807 / km² |
| Lesser Poland Voivodeship | 3.4 million | 15,196.3 km² | 222 / km² |
| Poland | 38.5 million | 312,592.3 km² | 123 / km² |
Targanice Historical and Projected Population
Estimated Population from 300 to 2100
- JRC (European Commission's Joint Research Centre) work on the GHS built-up grid
- CIESIN (Center for International Earth Science Information Network)
- [Link] Klein Goldewijk, K., Beusen, A., Doelman, J., and Stehfest, E.: Anthropogenic land use estimates for the Holocene – HYDE 3.2, Earth Syst. Sci. Data, 9, 927–953, https://doi.org/10.5194/essd-9-927-2017, 2017.
Area Codes
Percentage Area Codes used by businesses in Targanice
Human Development Index (HDI)
Statistic composite index of life expectancy, education, and per capita income.
Targanice CO2 Emissions
Carbon Dioxide (CO2) Emissions Per Capita in Tonnes Per Year
| Location | CO2 Emissions | CO2 Emissions Per Capita | CO2 Emissions Intensity |
|---|---|---|---|
| Targanice | 9,638 tn | 6.1 tn | 11,015.3 tons/km² |
| Lesser Poland Voivodeship | 19,975,110 tn | 5.93 tn | 1,314.5 tons/km² |
| Poland | 230,825,573 tn | 5.99 tn | 738.4 tons/km² |
| 2013 CO2 emissions (tonnes/year) | 9,638 tn |
| 2013 CO2 emissions (tonnes/year) per capita | 6.1 tn |
| 2013 CO2 emissions intensity (tonnes/km²/year) | 11,015.3 tons/km² |
Natural Hazards Risk
Relative risk out of 10
| Hazard | Risk Level |
|---|---|
| Flood | Medium (7) |
| Earthquake | Low (2) |
* Risk, particularly concerning flood or landslide, may not be for the entire area.
- Dilley, M., R.S. Chen, U. Deichmann, A.L. Lerner-Lam, M. Arnold, J. Agwe, P. Buys, O. Kjekstad, B. Lyon, and G. Yetman. 2005. Natural Disaster Hotspots: A Global Risk Analysis. Washington, D.C.: World Bank. https://doi.org/10.1596/0-8213-5930-4.
- Center for Hazards and Risk Research - CHRR - Columbia University, Center for International Earth Science Information Network - CIESIN - Columbia University. 2005. Global Flood Hazard Frequency and Distribution. Palisades, NY: NASA Socioeconomic Data and Applications Center (SEDAC). https://doi.org/10.7927/H4668B3D.
- Center for Hazards and Risk Research - CHRR - Columbia University, Center for International Earth Science Information Network - CIESIN - Columbia University. 2005. Global Earthquake Hazard Distribution - Peak Ground Acceleration. Palisades, NY: NASA Socioeconomic Data and Applications Center (SEDAC). https://doi.org/10.7927/H4BZ63ZS.
Recent Nearby Earthquakes
Magnitude 3.0 and greater
| Date▼ | Time↕ | Magnitude↕ | Distance↕ | Depth↕ | Location↕ | Link |
|---|---|---|---|---|---|---|
| 11/17/15 | 11:28 PM | 4.1 | 37.2 km | 6,060 m | 3km N of Chelmek, Poland | usgs.gov |
| 4/17/15 | 10:16 PM | 4.3 | 57.9 km | 5,000 m | 2km ESE of Ruda Slaska, Poland | usgs.gov |
| 11/19/08 | 12:45 AM | 3.2 | 46.3 km | 1,000 m | Poland | usgs.gov |
| 2/23/08 | 6:32 PM | 3.1 | 61.8 km | 5,000 m | Poland | usgs.gov |
| 2/14/08 | 3:49 PM | 3.1 | 54.9 km | 5,000 m | Poland | usgs.gov |
| 1/16/08 | 10:21 AM | 3 | 37.7 km | 5,000 m | Poland | usgs.gov |
| 5/4/07 | 3:42 PM | 3 | 44 km | 5,000 m | Poland | usgs.gov |
| 4/25/07 | 8:58 AM | 3 | 58.2 km | 5,000 m | Poland | usgs.gov |
| 12/16/06 | 2:30 AM | 3.2 | 44.9 km | 5,000 m | Poland | usgs.gov |
| 12/19/05 | 2:32 AM | 3.2 | 49.3 km | 1,000 m | Poland | usgs.gov |
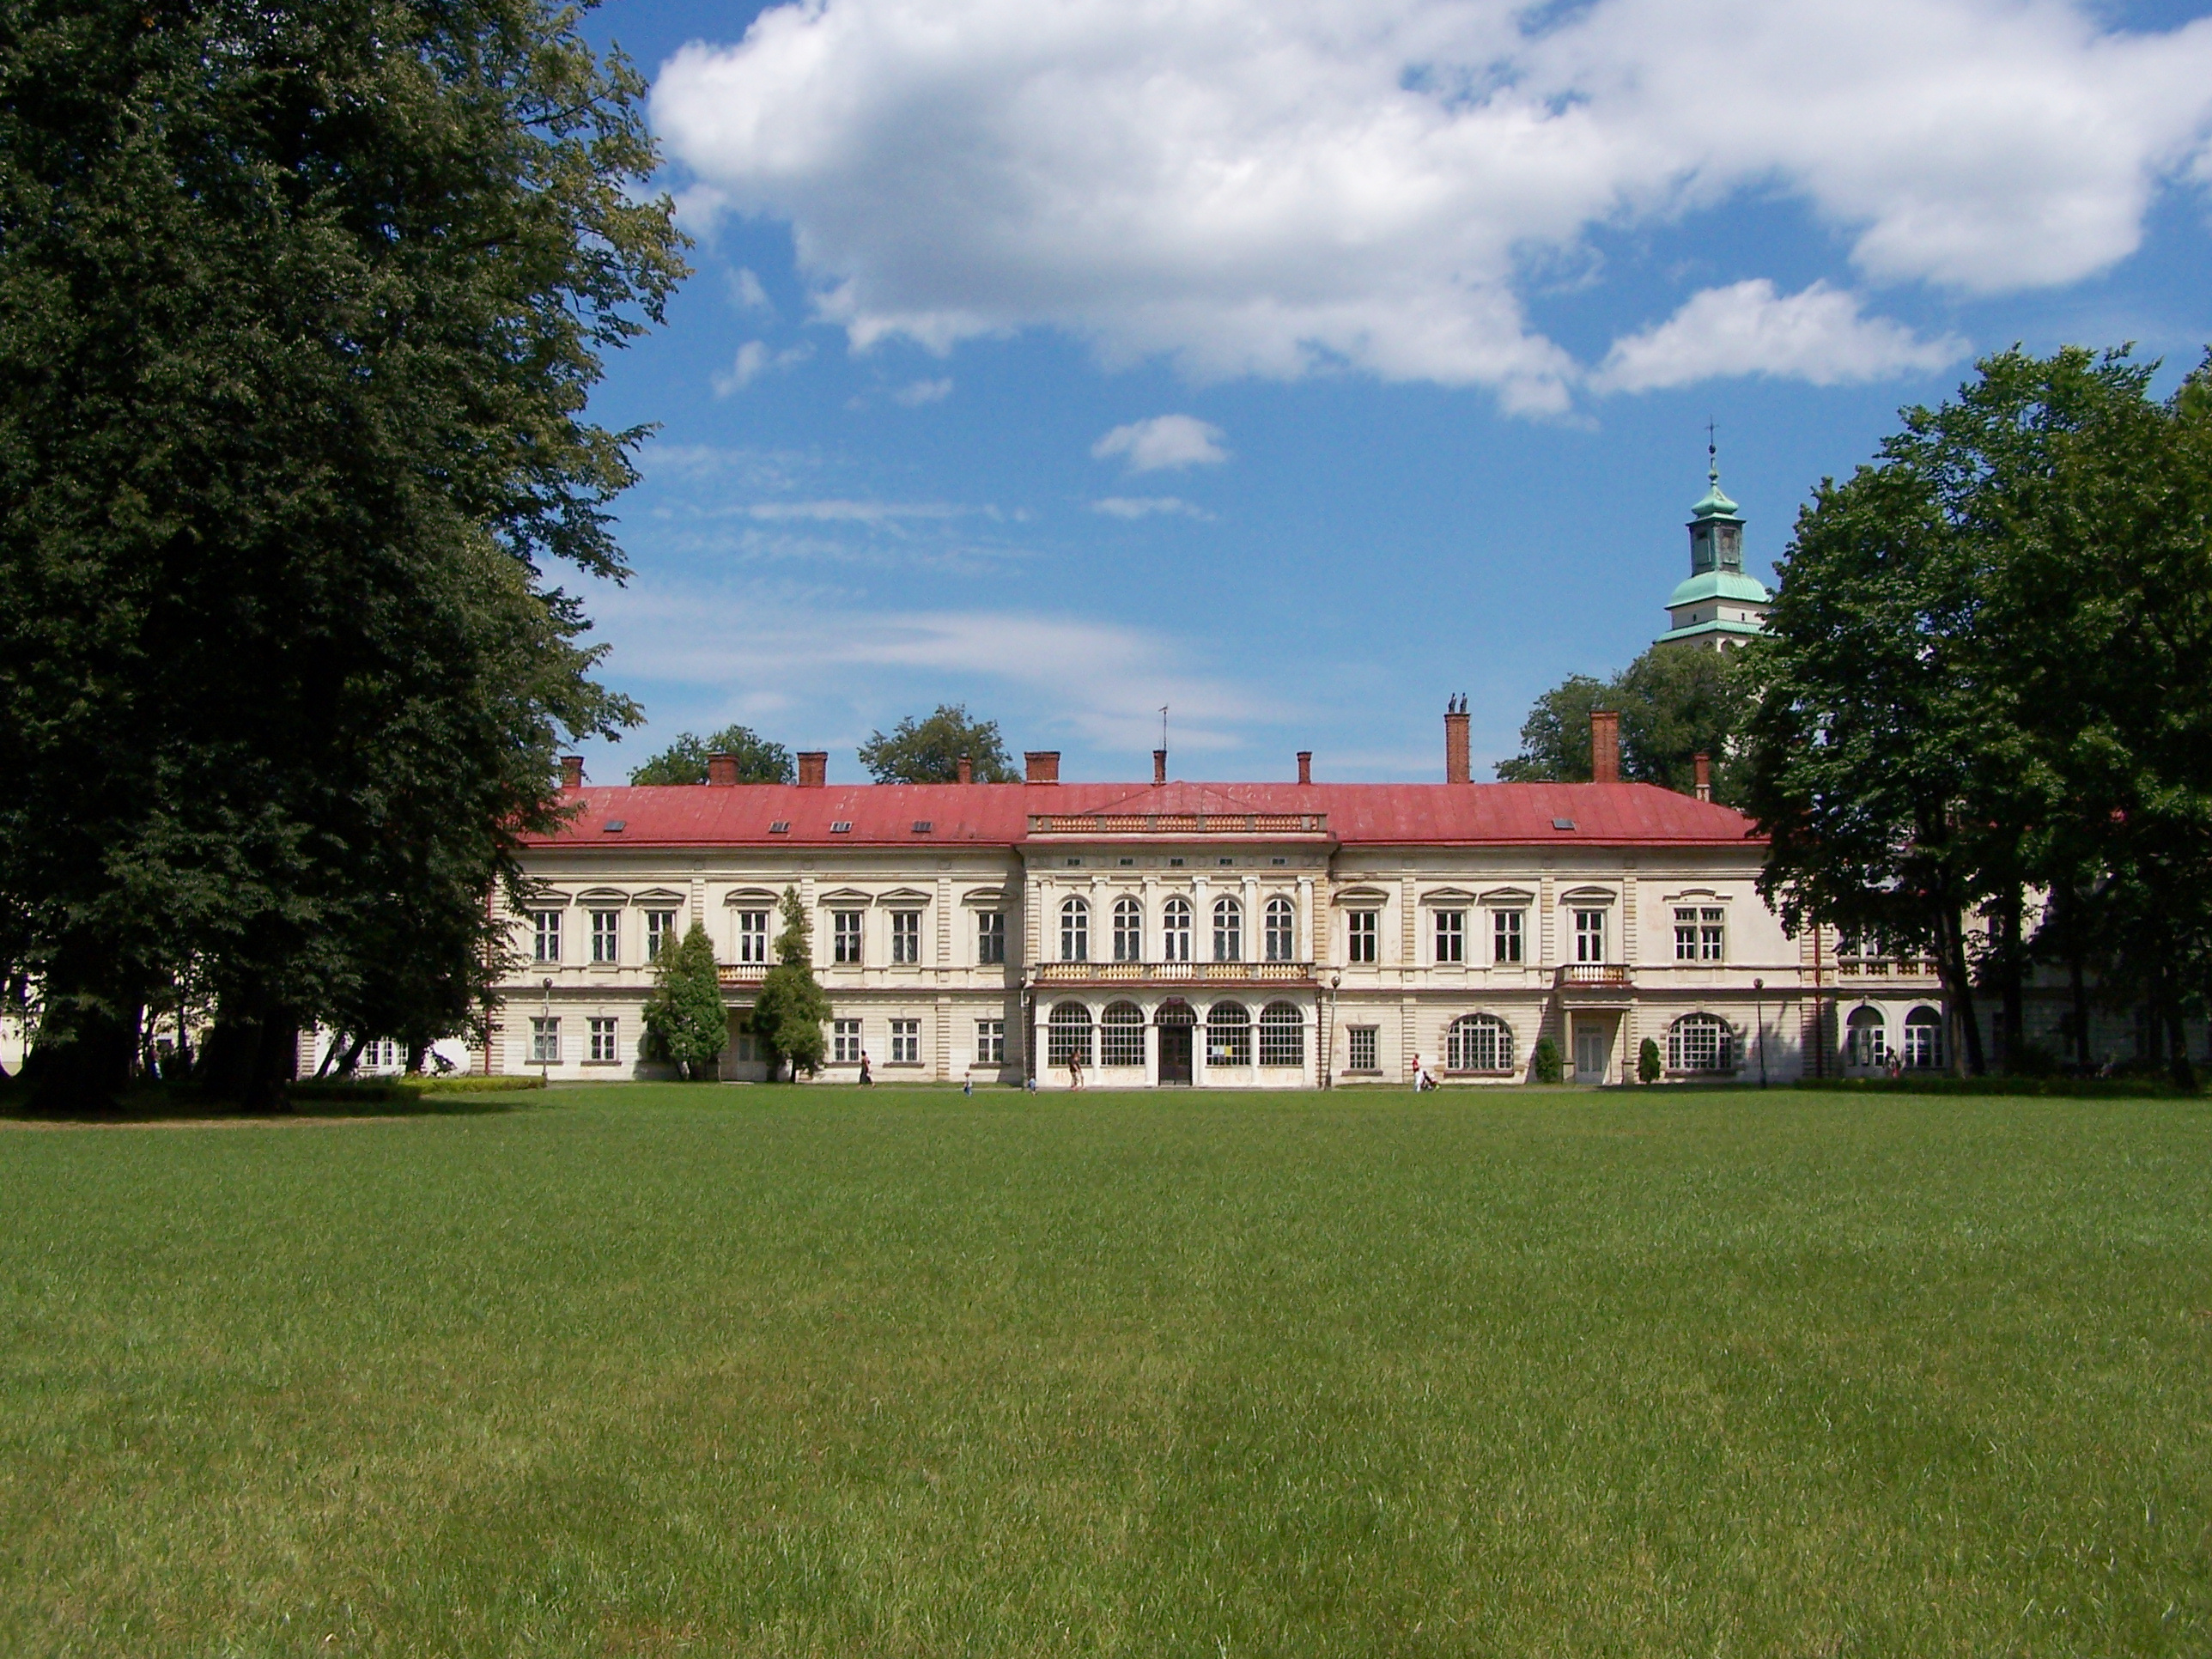
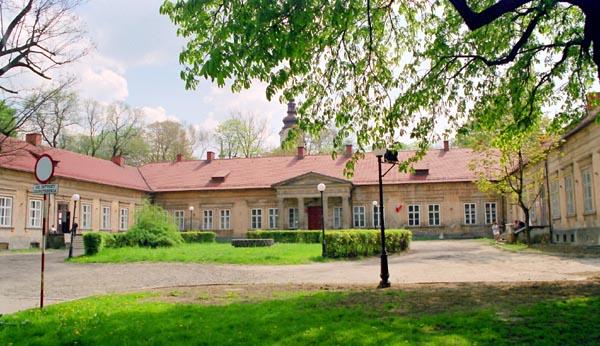
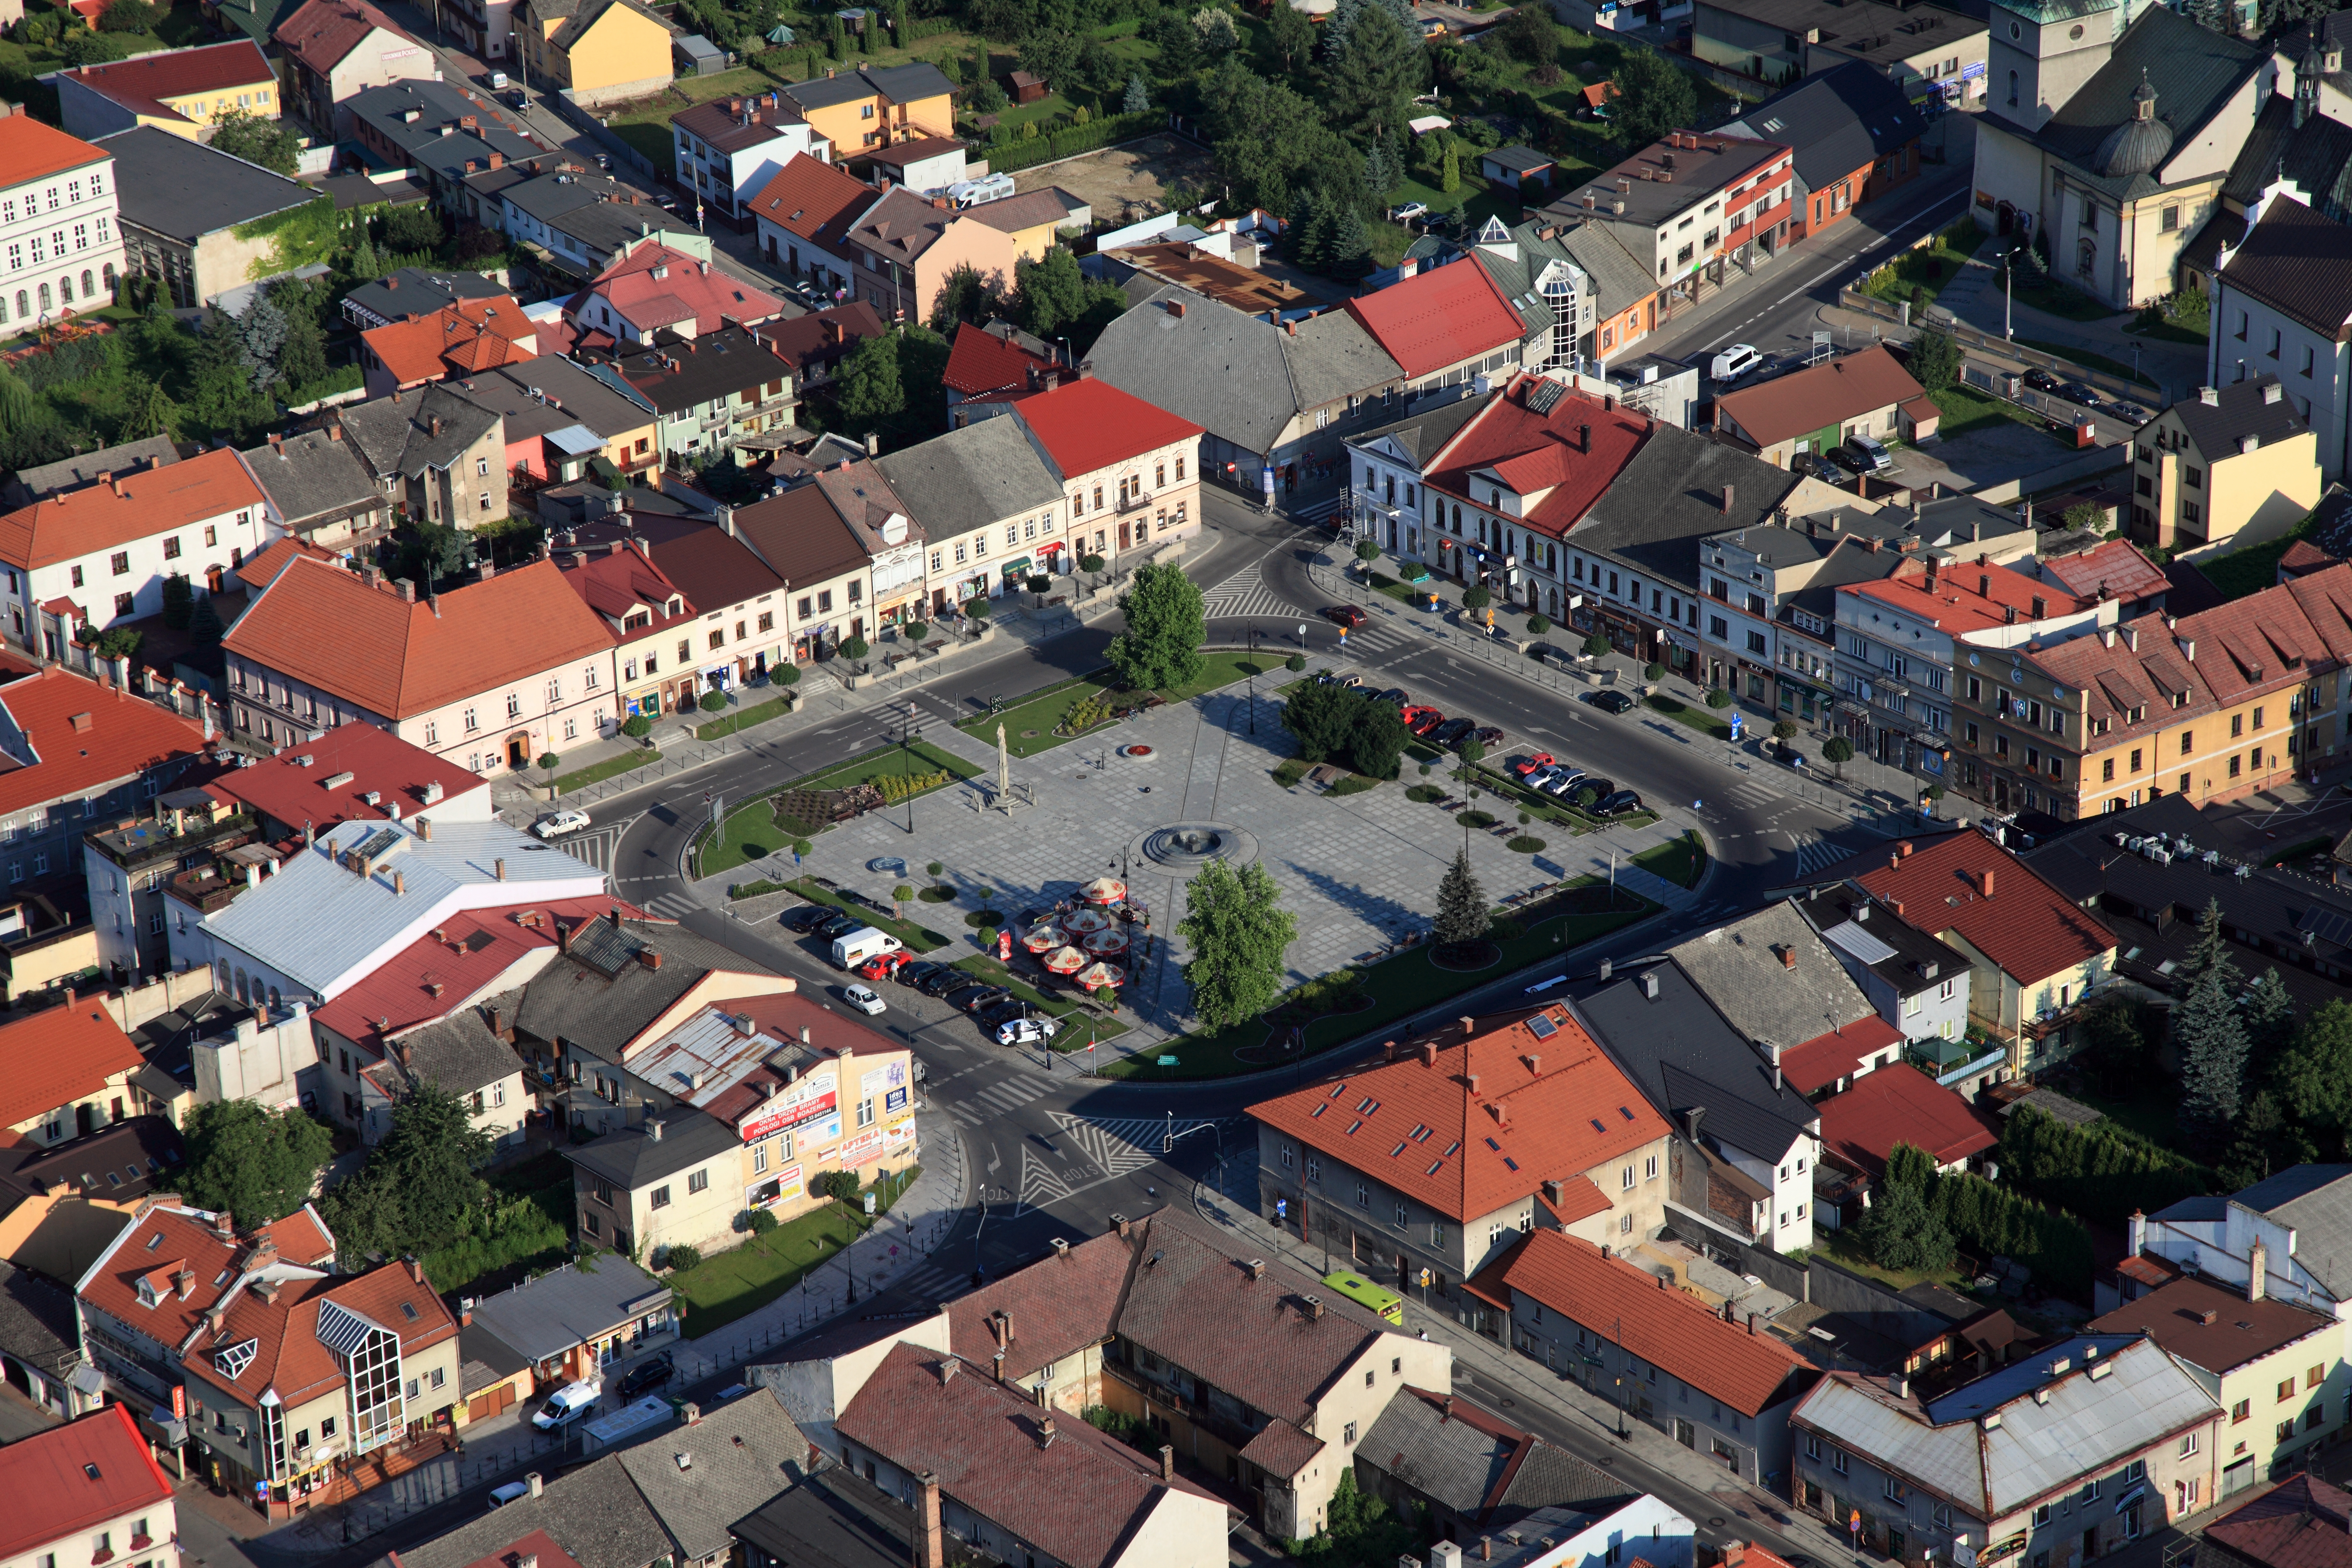
Targanice
Targanice [tarɡaˈɲit͡sɛ] is a village in the administrative district of Gmina Andrychów, within Wadowice County, Lesser Poland Voivodeship, in southern Poland. It lies approximately 6 kilometres (4 mi) south of Andrychów, 16 km (10 mi) south-west of ..
Targanice Wikipedia Page
About Our Data
The data on this page is estimated using a number of publicly available tools and resources. It is provided without warranty, and could contain inaccuracies. Use at your own risk.