Categories in Witnica
Industries
Business Distribution by Industry in Witnica
Witnica Facts
| Area | 3.4 km² |
| Population | 5,009 |
| Male Population | 2,526 (50.4%) |
| Female Population | 2,483 (49.6%) |
| Population change (1975 to 2020) | -16.9% |
| Population change (2000 to 2020) | -20.1% |
| Median Age | 33.5 years (Male: 33.7, Female: 33.4) |
| GDP per capita (PPP) | $31,980 (2022) |
| Local Time | |
| Timezone | Central European Summer Time |
| Lat & Lng | 52.67318, 14.89765 |
| Postal Codes | 66-460 |
Map of Witnica
Interactive Map
Witnica Population
Years 1975 to 2030
| Data | 1975 | 1990 | 2000 | 2015 | 2020 | 2025* | 2030* |
|---|---|---|---|---|---|---|---|
| Population | 6,030 | 6,396 | 6,266 | 5,366 | 5,009 | 5,223 | 5,120 |
| Population Density | 1,786.7 / km² | 1,895.1 / km² | 1,856.6 / km² | 1,589.9 / km² | 1,484.1 / km² | 1,547.6 / km² | 1,517 / km² |
Witnica Population change from 2000 to 2020
Decrease of 20.1% from year 2000 to 2020
| Location | Change since 1975 | Change since 1990 | Change since 2000 |
|---|---|---|---|
| Witnica | -16.9% | -21.7% | -20.1% |
| Lubusz Voivodeship | — | — | — |
| Poland | — | — | — |
Witnica Median Age
Median Age: 33.5 years
| Location | Median Age | Median Age (Female) | Median Age (Male) |
|---|---|---|---|
| Witnica | 33.5 yrs | 33.4 yrs | 33.7 yrs |
| Lubusz Voivodeship | 34.8 yrs | 35.4 yrs | 34.3 yrs |
| Poland | 34.9 yrs | 35.6 yrs | 34.3 yrs |
Witnica Population Density
Population Density: 1,484 / km²
| Location | Population | Area | Density |
|---|---|---|---|
| Witnica | 5,009 | 3.375 km² | 1,484 / km² |
| Lubusz Voivodeship | 1 million | 13,990.6 km² | 72.4 / km² |
| Poland | 38.5 million | 312,592.3 km² | 123 / km² |
Witnica Historical and Projected Population
Estimated Population from 200 to 2100
- JRC (European Commission's Joint Research Centre) work on the GHS built-up grid
- CIESIN (Center for International Earth Science Information Network)
- [Link] Klein Goldewijk, K., Beusen, A., Doelman, J., and Stehfest, E.: Anthropogenic land use estimates for the Holocene – HYDE 3.2, Earth Syst. Sci. Data, 9, 927–953, https://doi.org/10.5194/essd-9-927-2017, 2017.
Area Codes
Percentage Area Codes used by businesses in Witnica
Price Distribution
Business distribution by price for Witnica
Human Development Index (HDI)
Statistic composite index of life expectancy, education, and per capita income.
Witnica Gross Domestic Product (GDP)
GDP per capita, PPP (constant 2017 international $)
| Data | 1990 | 1995 | 2000 | 2005 | 2010 | 2015 | 2020 | 2022 |
|---|---|---|---|---|---|---|---|---|
| GDP per capita | $12,707 | $14,522 | $17,301 | $21,838 | $24,252 | $26,291 | $29,003 | $31,980 |
| Total GDP | $22M | $25.5M | $30.6M | $39.8M | $45.2M | $50.3M | $56.1M | $63.2M |
Witnica CO2 Emissions
Carbon Dioxide (CO2) Emissions Per Capita in Tonnes Per Year
| Location | CO2 Emissions | CO2 Emissions Per Capita | CO2 Emissions Intensity |
|---|---|---|---|
| Witnica | 30,841 tn | 6.16 tn | 9,137.9 tons/km² |
| Lubusz Voivodeship | 5,981,824 tn | 5.91 tn | 427.6 tons/km² |
| Poland | 230,825,573 tn | 5.99 tn | 738.4 tons/km² |
| 2013 CO2 emissions (tonnes/year) | 30,841 tn |
| 2013 CO2 emissions (tonnes/year) per capita | 6.16 tn |
| 2013 CO2 emissions intensity (tonnes/km²/year) | 9,137.9 tons/km² |
Recent Nearby Earthquakes
Magnitude 3.0 and greater
| Date▼ | Time↕ | Magnitude↕ | Distance↕ | Depth↕ | Location↕ | Link |
|---|---|---|---|---|---|---|
| 3/23/01 | 11:29 PM | 3.3 | 94.3 km | 5,000 m | Poland | usgs.gov |
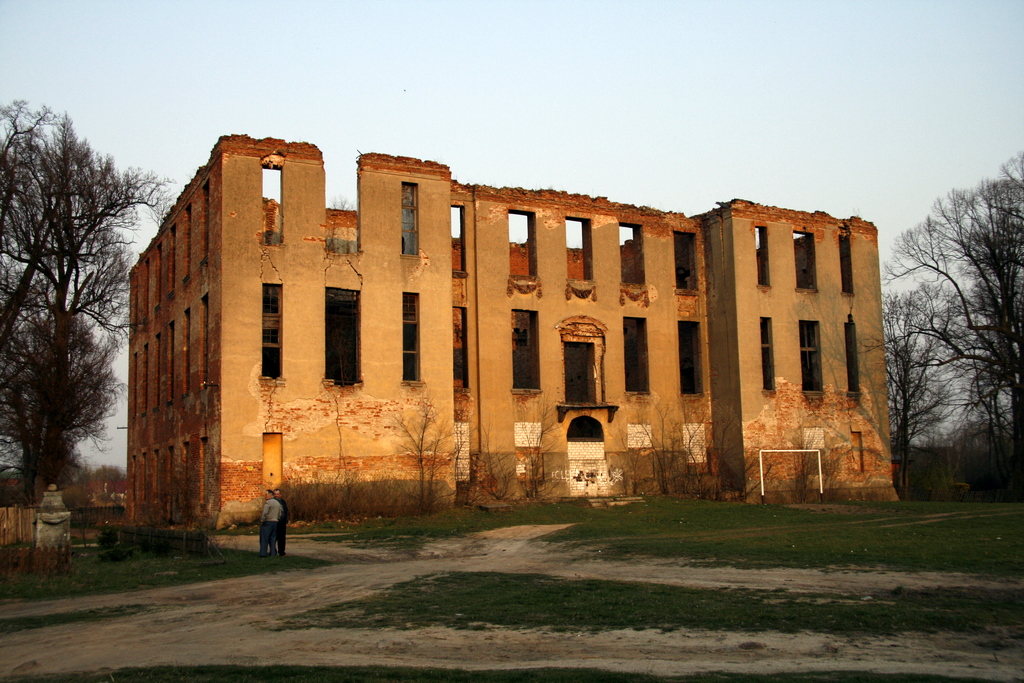
Witnica
Witnica [vitˈnit͡sa] (German: Vietz) is a town in western Poland, situated in the Lubusz Voivodeship, with 6,858 inhabitants (2004). to 1945 it was in Germany. After World War II the region was placed under Polish administration and ethnically clean..
Witnica Wikipedia Page


About Our Data
The data on this page is estimated using a number of publicly available tools and resources. It is provided without warranty, and could contain inaccuracies. Use at your own risk.