Categories in Bethlehem
Industries
Business Distribution by Industry in Bethlehem
| Industry Description | Number of Establishments |
|---|---|
| Restaurants | 92 |
| Hotels and motels | 49 |
| Shopping | 46 |
| Grocery stores and supermarkets | 30 |
| Other accommodation | 23 |
| Cafes | 21 |
| Churches | 20 |
| Clothing stores | 19 |
| Gifts, cards and party supplies | 19 |
| Mosques | 18 |
| Pharmacies and drug stores | 17 |
| Electronics stores | 16 |
| Other membership organizations | 15 |
| Bed and breakfasts | 13 |
Bethlehem Facts
| Area | 4.3 km² |
| Population | 38,323 |
| Male Population | 19,457 (50.8%) |
| Female Population | 18,866 (49.2%) |
| Population change (1975 to 2020) | +161.4% |
| Population change (2000 to 2020) | +87.2% |
| Median Age | 18.8 years (Male: 18.7, Female: 19) |
| Neighborhoods | 00970, Beit Sahour, Ge'ullim - Baka |
| Local Time | |
| Timezone | Eastern European Summer Time |
| Lat & Lng | 31.70487, 35.20376 |
Map of Bethlehem
Interactive Map
Bethlehem Population
Years 1975 to 2030
| Data | 1975 | 1990 | 2000 | 2015 | 2020 | 2025* | 2030* |
|---|---|---|---|---|---|---|---|
| Population | 14,659 | 17,874 | 20,467 | 24,092 | 38,323 | 42,303 | 46,519 |
| Population Density | 3,449.2 / km² | 4,205.6 / km² | 4,815.8 / km² | 5,668.7 / km² | 9,017.2 / km² | 9,953.6 / km² | 10,945.6 / km² |
Bethlehem Population change from 2000 to 2020
Increase of 87.2% from year 2000 to 2020
| Location | Change since 1975 | Change since 1990 | Change since 2000 |
|---|---|---|---|
| Bethlehem | +161.4% | +114.4% | +87.2% |
| West Bank | — | — | — |
| State of Palestine | — | — | — |
Bethlehem Median Age
Median Age: 18.8 years
| Location | Median Age | Median Age (Female) | Median Age (Male) |
|---|---|---|---|
| Bethlehem | 18.8 yrs | 19 yrs | 18.7 yrs |
| West Bank | 19 yrs | 19.2 yrs | 18.8 yrs |
| State of Palestine | 17.8 yrs | 18 yrs | 17.7 yrs |
Bethlehem Population Density
Population Density: 9,017 / km²
| Location | Population | Area | Density |
|---|---|---|---|
| Bethlehem | 38,323 | 4.25 km² | 9,017 / km² |
| West Bank | 2.7 million | 5,739.7 km² | 466 / km² |
| State of Palestine | 4.4 million | 6,106.7 km² | 722 / km² |
Bethlehem Historical and Projected Population
Estimated Population from 1780 to 2100
- JRC (European Commission's Joint Research Centre) work on the GHS built-up grid
- CIESIN (Center for International Earth Science Information Network)
- [Link] Klein Goldewijk, K., Beusen, A., Doelman, J., and Stehfest, E.: Anthropogenic land use estimates for the Holocene – HYDE 3.2, Earth Syst. Sci. Data, 9, 927–953, https://doi.org/10.5194/essd-9-927-2017, 2017.
Area Codes
Percentage Area Codes used by businesses in Bethlehem
Price Distribution
Business distribution by price for Bethlehem
Bethlehem CO2 Emissions
Carbon Dioxide (CO2) Emissions Per Capita in Tonnes Per Year
| Location | CO2 Emissions | CO2 Emissions Per Capita | CO2 Emissions Intensity |
|---|---|---|---|
| Bethlehem | 41,812 tn | 1.09 tn | 9,838.2 tons/km² |
| West Bank | 3,371,935 tn | 1.26 tn | 587.5 tons/km² |
| State of Palestine | 5,551,278 tn | 1.26 tn | 909.1 tons/km² |
| 2013 CO2 emissions (tonnes/year) | 41,812 tn |
| 2013 CO2 emissions (tonnes/year) per capita | 1.09 tn |
| 2013 CO2 emissions intensity (tonnes/km²/year) | 9,838.2 tons/km² |
Natural Hazards Risk
Relative risk out of 10
| Hazard | Risk Level |
|---|---|
| Drought | High (9) |
| Earthquake | Medium (6.3) |
* Risk, particularly concerning flood or landslide, may not be for the entire area.
- Dilley, M., R.S. Chen, U. Deichmann, A.L. Lerner-Lam, M. Arnold, J. Agwe, P. Buys, O. Kjekstad, B. Lyon, and G. Yetman. 2005. Natural Disaster Hotspots: A Global Risk Analysis. Washington, D.C.: World Bank. https://doi.org/10.1596/0-8213-5930-4.
- Center for Hazards and Risk Research - CHRR - Columbia University, Center for International Earth Science Information Network - CIESIN - Columbia University, and International Research Institute for Climate and Society - IRI - Columbia University. 2005. Global Drought Hazard Frequency and Distribution. Palisades, NY: NASA Socioeconomic Data and Applications Center (SEDAC). https://doi.org/10.7927/H4VX0DFT.
- Center for Hazards and Risk Research - CHRR - Columbia University, Center for International Earth Science Information Network - CIESIN - Columbia University. 2005. Global Earthquake Hazard Distribution - Peak Ground Acceleration. Palisades, NY: NASA Socioeconomic Data and Applications Center (SEDAC). https://doi.org/10.7927/H4BZ63ZS.
Recent Nearby Earthquakes
Magnitude 3.0 and greater
| Date▼ | Time↕ | Magnitude↕ | Distance↕ | Depth↕ | Location↕ | Link |
|---|---|---|---|---|---|---|
| 7/30/15 | 2:39 AM | 4.2 | 42.9 km | 13,000 m | 24km NNE of `En Boqeq, Israel | usgs.gov |
| 12/2/07 | 7:38 AM | 4 | 32.5 km | 10,000 m | Dead Sea region | usgs.gov |
| 11/23/07 | 10:19 PM | 4.4 | 30.3 km | 11,000 m | Dead Sea region | usgs.gov |
| 11/20/07 | 11:21 PM | 3.2 | 36.7 km | 5,000 m | Dead Sea region | usgs.gov |
| 11/20/07 | 9:18 AM | 4.6 | 33.6 km | 10,000 m | Dead Sea region | usgs.gov |
| 2/9/07 | 10:14 PM | 4.5 | 70.3 km | 15,000 m | Dead Sea region | usgs.gov |
| 2/9/07 | 10:12 PM | 4 | 79.2 km | 2,000 m | Dead Sea region | usgs.gov |
| 11/18/06 | 2:57 AM | 3.1 | 52 km | 10,000 m | Dead Sea region | usgs.gov |
| 9/17/06 | 8:22 AM | 4 | 43.1 km | 1,000 m | Dead Sea region | usgs.gov |
| 9/9/06 | 4:58 AM | 4.5 | 44.2 km | 1,000 m | Dead Sea region | usgs.gov |
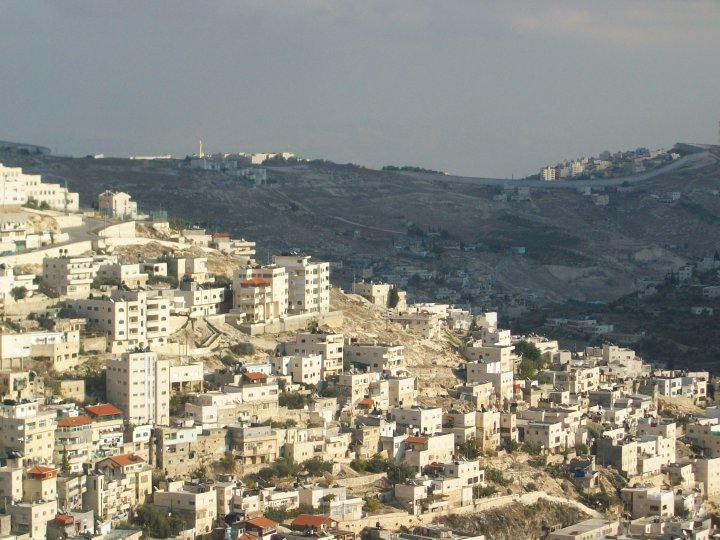
Bethlehem
Bethlehem (Arabic: بيت لحم Bayt Laḥm ; "House of Meat", Bēt Laḥm; Hebrew: בֵּית לֶחֶם Bēṯ Leḥem, Modern: Bet Leḥem [bet ˈleχem], lit. "House of Bread"; Ancient Greek: Βηθλεέμ [bɛːtʰle.ém]; Latin: Bethleem) is a Palestinian city located in the centr..
Bethlehem Wikipedia Page


About Our Data
The data on this page is estimated using a number of publicly available tools and resources. It is provided without warranty, and could contain inaccuracies. Use at your own risk.