Categories in Ramallah
Industries
Business Distribution by Industry in Ramallah
| Industry Description | Number of Establishments | Average Age of Business |
|---|---|---|
| Restaurants | 185 | — |
| Shopping | 99 | 29 years |
| Clothing stores | 81 | — |
| Electronics stores | 76 | 19 years |
| Cafes | 65 | — |
| Grocery stores and supermarkets | 64 | — |
| Beauty salons | 51 | — |
| Corporate management | 49 | — |
| Public administration | 44 | — |
| Education | 38 | — |
| Other membership organizations | 36 | 22 years |
| Apartments | 35 | — |
| Banks | 32 | — |
| Dentists | 29 | — |
Ramallah Facts
| Area | 0.1 km² |
| Population | 1,274 |
| Male Population | 647 (50.8%) |
| Female Population | 627 (49.2%) |
| Population change (1975 to 2020) | +1922.2% |
| Population change (2000 to 2020) | +810.0% |
| Median Age | 18.8 years (Male: 18.7, Female: 19) |
| Neighborhoods | Al Mayoun |
| Local Time | |
| Timezone | Eastern European Summer Time |
| Lat & Lng | 31.89964, 35.20422 |
Map of Ramallah
Interactive Map
Ramallah Population
Years 1975 to 2030
| Data | 1975 | 1990 | 2000 | 2015 | 2020 | 2025* | 2030* |
|---|---|---|---|---|---|---|---|
| Population | 63 | 80 | 140 | 202 | 1,274 | 1,452 | 1,641 |
| Population Density | 504 / km² | 640 / km² | 1,120 / km² | 1,616 / km² | 10,192 / km² | 11,616 / km² | 13,128 / km² |
Ramallah Population change from 2000 to 2020
Increase of 810% from year 2000 to 2020
| Location | Change since 1975 | Change since 1990 | Change since 2000 |
|---|---|---|---|
| Ramallah | +1922.2% | +1492.5% | +810% |
| West Bank | — | — | — |
| State of Palestine | — | — | — |
Ramallah Median Age
Median Age: 18.8 years
| Location | Median Age | Median Age (Female) | Median Age (Male) |
|---|---|---|---|
| Ramallah | 18.8 yrs | 19 yrs | 18.7 yrs |
| West Bank | 19 yrs | 19.2 yrs | 18.8 yrs |
| State of Palestine | 17.8 yrs | 18 yrs | 17.7 yrs |
Ramallah Population Density
Population Density: 10,192 / km²
| Location | Population | Area | Density |
|---|---|---|---|
| Ramallah | 1,274 | 0.125 km² | 10,192 / km² |
| West Bank | 2.7 million | 5,739.7 km² | 466 / km² |
| State of Palestine | 4.4 million | 6,106.7 km² | 722 / km² |
Ramallah Historical and Projected Population
Estimated Population from 1930 to 2100
- JRC (European Commission's Joint Research Centre) work on the GHS built-up grid
- CIESIN (Center for International Earth Science Information Network)
- [Link] Klein Goldewijk, K., Beusen, A., Doelman, J., and Stehfest, E.: Anthropogenic land use estimates for the Holocene – HYDE 3.2, Earth Syst. Sci. Data, 9, 927–953, https://doi.org/10.5194/essd-9-927-2017, 2017.
Area Codes
Percentage Area Codes used by businesses in Ramallah
Price Distribution
Business distribution by price for Ramallah
Ramallah CO2 Emissions
Carbon Dioxide (CO2) Emissions Per Capita in Tonnes Per Year
| Location | CO2 Emissions | CO2 Emissions Per Capita | CO2 Emissions Intensity |
|---|---|---|---|
| Ramallah | 1,390 tn | 1.09 tn | 11,120 tons/km² |
| West Bank | 3,371,935 tn | 1.26 tn | 587.5 tons/km² |
| State of Palestine | 5,551,278 tn | 1.26 tn | 909.1 tons/km² |
| 2013 CO2 emissions (tonnes/year) | 1,390 tn |
| 2013 CO2 emissions (tonnes/year) per capita | 1.09 tn |
| 2013 CO2 emissions intensity (tonnes/km²/year) | 11,120 tons/km² |
Natural Hazards Risk
Relative risk out of 10
| Hazard | Risk Level |
|---|---|
| Drought | High (9) |
| Earthquake | Medium (7) |
* Risk, particularly concerning flood or landslide, may not be for the entire area.
- Dilley, M., R.S. Chen, U. Deichmann, A.L. Lerner-Lam, M. Arnold, J. Agwe, P. Buys, O. Kjekstad, B. Lyon, and G. Yetman. 2005. Natural Disaster Hotspots: A Global Risk Analysis. Washington, D.C.: World Bank. https://doi.org/10.1596/0-8213-5930-4.
- Center for Hazards and Risk Research - CHRR - Columbia University, Center for International Earth Science Information Network - CIESIN - Columbia University, and International Research Institute for Climate and Society - IRI - Columbia University. 2005. Global Drought Hazard Frequency and Distribution. Palisades, NY: NASA Socioeconomic Data and Applications Center (SEDAC). https://doi.org/10.7927/H4VX0DFT.
- Center for Hazards and Risk Research - CHRR - Columbia University, Center for International Earth Science Information Network - CIESIN - Columbia University. 2005. Global Earthquake Hazard Distribution - Peak Ground Acceleration. Palisades, NY: NASA Socioeconomic Data and Applications Center (SEDAC). https://doi.org/10.7927/H4BZ63ZS.
Recent Nearby Earthquakes
Magnitude 3.0 and greater
| Date▼ | Time↕ | Magnitude↕ | Distance↕ | Depth↕ | Location↕ | Link |
|---|---|---|---|---|---|---|
| 7/30/15 | 2:39 AM | 4.2 | 61.5 km | 13,000 m | 24km NNE of `En Boqeq, Israel | usgs.gov |
| 12/2/07 | 7:38 AM | 4 | 41.1 km | 10,000 m | Dead Sea region | usgs.gov |
| 11/23/07 | 10:19 PM | 4.4 | 25.4 km | 11,000 m | Dead Sea region | usgs.gov |
| 11/20/07 | 11:21 PM | 3.2 | 43.9 km | 5,000 m | Dead Sea region | usgs.gov |
| 11/20/07 | 9:18 AM | 4.6 | 41.1 km | 10,000 m | Dead Sea region | usgs.gov |
| 2/9/07 | 10:14 PM | 4.5 | 90.9 km | 15,000 m | Dead Sea region | usgs.gov |
| 2/9/07 | 10:12 PM | 4 | 99 km | 2,000 m | Dead Sea region | usgs.gov |
| 11/18/06 | 2:57 AM | 3.1 | 34 km | 10,000 m | Dead Sea region | usgs.gov |
| 9/17/06 | 8:22 AM | 4 | 28.5 km | 1,000 m | Dead Sea region | usgs.gov |
| 9/9/06 | 4:58 AM | 4.5 | 30.1 km | 1,000 m | Dead Sea region | usgs.gov |
Ramallah
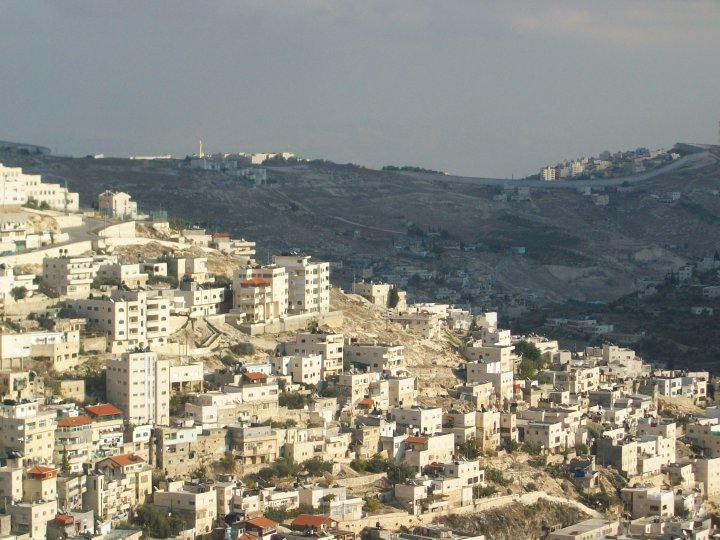
Ramallah (Arabic: رام الله, pronounced Rāmallāh ) is a Palestinian city in the central West Bank located 10 km (6 miles) north of Jerusalem at an average elevation of 880 meters above sea level, adjacent to al-Bireh. It currently serves as the de..
Ramallah Wikipedia Page


About Our Data
The data on this page is estimated using a number of publicly available tools and resources. It is provided without warranty, and could contain inaccuracies. Use at your own risk.