Bogdand Facts
| Area | 0.9 km² |
| Population | 218 |
| Male Population | 107 (49.0%) |
| Female Population | 111 (51.0%) |
| Population change (1975 to 2020) | -59.5% |
| Population change (2000 to 2020) | -64.5% |
| Median Age | 39.7 years (Male: 38, Female: 42.7) |
| GDP per capita (PPP) | $17,034 (2022) |
| Local Time | |
| Timezone | Eastern European Summer Time |
| Lat & Lng | 47.41667, 22.93333 |
| Postal Codes | 447060 |
Map of Bogdand
Interactive Map
Bogdand Population
Years 1975 to 2030
| Data | 1975 | 1990 | 2000 | 2015 | 2020 | 2025* | 2030* |
|---|---|---|---|---|---|---|---|
| Population | 538 | 623 | 614 | 437 | 218 | 223 | 213 |
| Population Density | 573.9 / km² | 664.5 / km² | 654.9 / km² | 466.1 / km² | 232.5 / km² | 237.9 / km² | 227.2 / km² |
Bogdand Population change from 2000 to 2020
Decrease of 64.5% from year 2000 to 2020
| Location | Change since 1975 | Change since 1990 | Change since 2000 |
|---|---|---|---|
| Bogdand | -59.5% | -65% | -64.5% |
| Satu Mare County | — | — | — |
| Romania | — | — | — |
Bogdand Median Age
Median Age: 39.7 years
| Location | Median Age | Median Age (Female) | Median Age (Male) |
|---|---|---|---|
| Bogdand | 39.7 yrs | 42.7 yrs | 38 yrs |
| Satu Mare County | 38.4 yrs | 40.2 yrs | 36.6 yrs |
| Romania | 40.1 yrs | 41.6 yrs | 38.5 yrs |
Bogdand Population Density
Population Density: 233 / km²
| Location | Population | Area | Density |
|---|---|---|---|
| Bogdand | 218 | 0.938 km² | 233 / km² |
| Satu Mare County | 310,292 | 4,421.4 km² | 70.2 / km² |
| Romania | 19.5 million | 238,387.8 km² | 81.8 / km² |
Bogdand Historical and Projected Population
Estimated Population from 0 to 2100
- JRC (European Commission's Joint Research Centre) work on the GHS built-up grid
- CIESIN (Center for International Earth Science Information Network)
- [Link] Klein Goldewijk, K., Beusen, A., Doelman, J., and Stehfest, E.: Anthropogenic land use estimates for the Holocene – HYDE 3.2, Earth Syst. Sci. Data, 9, 927–953, https://doi.org/10.5194/essd-9-927-2017, 2017.
Human Development Index (HDI)
Statistic composite index of life expectancy, education, and per capita income.
Bogdand Gross Domestic Product (GDP)
GDP per capita, PPP (constant 2017 international $)
| Data | 1990 | 1995 | 2000 | 2005 | 2010 | 2015 | 2020 | 2022 |
|---|---|---|---|---|---|---|---|---|
| GDP per capita | $5,397 | $5,009 | $5,065 | $7,516 | $9,565 | $13,155 | $15,797 | $17,034 |
| Total GDP | $37.8M | $34.8M | $34.5M | $48.7M | $59.2M | $81.1M | $93.6M | $100.4M |
Bogdand CO2 Emissions
Carbon Dioxide (CO2) Emissions Per Capita in Tonnes Per Year
| Location | CO2 Emissions | CO2 Emissions Per Capita | CO2 Emissions Intensity |
|---|---|---|---|
| Bogdand | 1,042 tn | 4.78 tn | 1,111.2 tons/km² |
| Satu Mare County | 1,484,155 tn | 4.78 tn | 335.7 tons/km² |
| Romania | 86,961,323 tn | 4.46 tn | 364.8 tons/km² |
| 2013 CO2 emissions (tonnes/year) | 1,042 tn |
| 2013 CO2 emissions (tonnes/year) per capita | 4.78 tn |
| 2013 CO2 emissions intensity (tonnes/km²/year) | 1,111.2 tons/km² |
Natural Hazards Risk
Relative risk out of 10
| Hazard | Risk Level |
|---|---|
| Flood | High (10) |
| Earthquake | Medium (4) |
* Risk, particularly concerning flood or landslide, may not be for the entire area.
- Dilley, M., R.S. Chen, U. Deichmann, A.L. Lerner-Lam, M. Arnold, J. Agwe, P. Buys, O. Kjekstad, B. Lyon, and G. Yetman. 2005. Natural Disaster Hotspots: A Global Risk Analysis. Washington, D.C.: World Bank. https://doi.org/10.1596/0-8213-5930-4.
- Center for Hazards and Risk Research - CHRR - Columbia University, Center for International Earth Science Information Network - CIESIN - Columbia University. 2005. Global Flood Hazard Frequency and Distribution. Palisades, NY: NASA Socioeconomic Data and Applications Center (SEDAC). https://doi.org/10.7927/H4668B3D.
- Center for Hazards and Risk Research - CHRR - Columbia University, Center for International Earth Science Information Network - CIESIN - Columbia University. 2005. Global Earthquake Hazard Distribution - Peak Ground Acceleration. Palisades, NY: NASA Socioeconomic Data and Applications Center (SEDAC). https://doi.org/10.7927/H4BZ63ZS.
Recent Nearby Earthquakes
Magnitude 3.0 and greater
| Date▼ | Time↕ | Magnitude↕ | Distance↕ | Depth↕ | Location↕ | Link |
|---|---|---|---|---|---|---|
| 7/19/15 | 11:30 AM | 4 | 92.9 km | 4,600 m | 8km WSW of Neresnytsya, Ukraine | usgs.gov |
| 11/23/06 | 7:15 AM | 4.8 | 93.5 km | 10,000 m | Hungary | usgs.gov |
| 11/15/06 | 6:09 PM | 3.1 | 75.4 km | 10,000 m | Hungary | usgs.gov |
| 7/14/06 | 11:06 AM | 3 | 74.3 km | 0 m | Romania | usgs.gov |
| 5/17/05 | 2:52 AM | 3.1 | 78.4 km | 33,800 m | Romania | usgs.gov |
| 1/4/99 | 12:30 AM | 4.1 | 81.4 km | 33,000 m | Ukraine | usgs.gov |
| 8/10/94 | 11:06 AM | 3.1 | 77.8 km | 57,800 m | Romania | usgs.gov |
| 11/1/87 | 9:46 PM | 3.3 | 39.3 km | 91,600 m | Romania | usgs.gov |
| 3/30/79 | 3:56 PM | 4.9 | 80.3 km | 33,000 m | Romania | usgs.gov |
| 3/28/79 | 1:02 PM | 4.7 | 79.6 km | 10,000 m | Romania | usgs.gov |
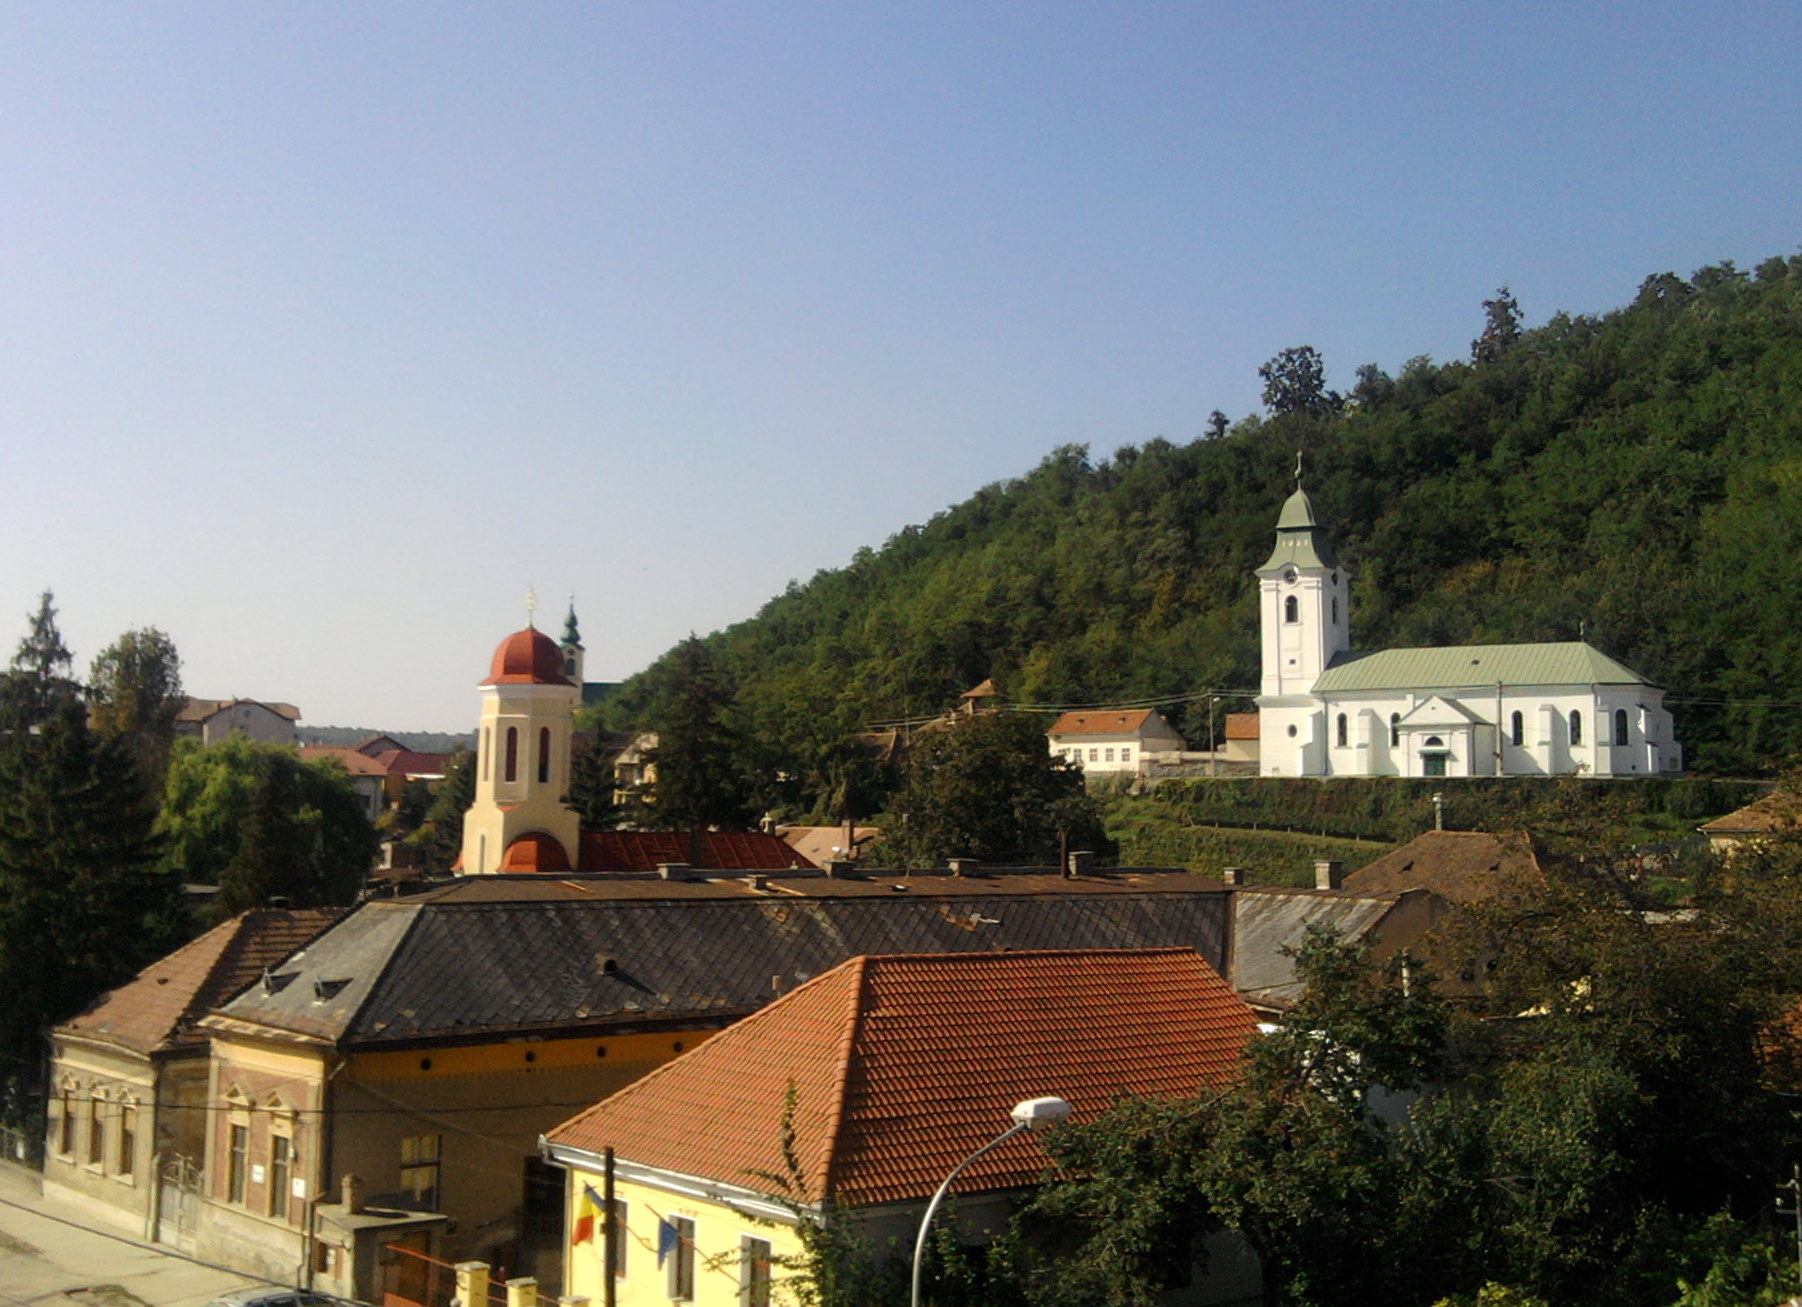
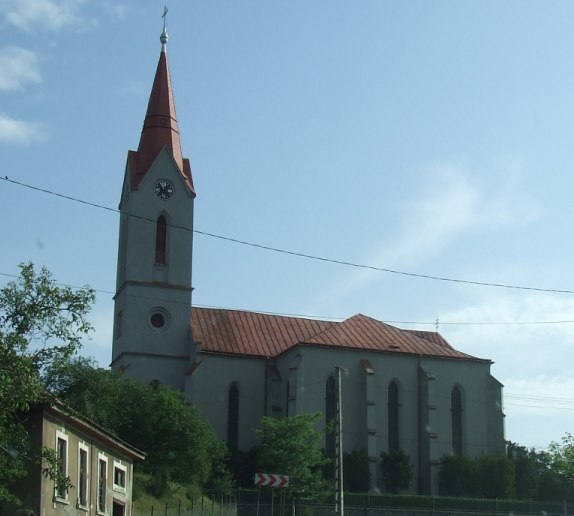
Bogdand
Bogdand (Hungarian: Bogdánd; Hungarian pronunciation: [ˈboɡdaːnd]) is a commune in Satu Mare County in Transylvania, Romania. The total population is 2,865 (2011 census), by nationality: 1668 Hungarians, 1034 Romanians, 161 Roma. commune is composed..
Bogdand Wikipedia Page

About Our Data
The data on this page is estimated using a number of publicly available tools and resources. It is provided without warranty, and could contain inaccuracies. Use at your own risk.