Categories in Cazasu
Cazasu Facts
| Area | 2.8 km² |
| Population | 2,320 |
| Male Population | 1,175 (50.6%) |
| Female Population | 1,145 (49.4%) |
| Population change (1975 to 2020) | -41.9% |
| Population change (2000 to 2020) | -29.2% |
| Median Age | 41.9 years (Male: 40.7, Female: 43.4) |
| Local Time | |
| Timezone | Eastern European Summer Time |
| Lat & Lng | 45.27172, 27.89011 |
| Postal Codes | 817181 |
Map of Cazasu
Interactive Map
Cazasu Population
Years 1975 to 2020
| Data | 1975 | 1990 | 2000 | 2015 | 2020 |
|---|---|---|---|---|---|
| Population | 3,994 | 3,839 | 3,279 | 2,282 | 2,320 |
| Population Density | 1,420.1 / km² | 1,365 / km² | 1,165.9 / km² | 811.4 / km² | 824.9 / km² |
Cazasu Population change from 2000 to 2015
Decrease of 30.4% from year 2000 to 2015
| Location | Change since 1975 | Change since 1990 | Change since 2000 |
|---|---|---|---|
| Cazasu | -42.9% | -40.6% | -30.4% |
| Brăila County | -38.2% | -36.8% | -27.9% |
| Romania | -9.9% | -16.9% | -11.8% |
Cazasu Median Age
Median Age: 41.9 years
| Location | Median Age | Median Age (Female) | Median Age (Male) |
|---|---|---|---|
| Cazasu | 41.9 yrs | 43.4 yrs | 40.7 yrs |
| Brăila County | 42.5 yrs | 44.3 yrs | 40.8 yrs |
| Romania | 40.1 yrs | 41.6 yrs | 38.5 yrs |
Cazasu Population Density
Population Density: 825 / km²
| Location | Population | Area | Density |
|---|---|---|---|
| Cazasu | 2,320 | 2.813 km² | 825 / km² |
| Brăila County | 280,982 | 4,765.7 km² | 59 / km² |
| Romania | 19.5 million | 238,387.8 km² | 81.8 / km² |
Cazasu Historical and Projected Population
Estimated Population from 1700 to 2100
- JRC (European Commission's Joint Research Centre) work on the GHS built-up grid
- CIESIN (Center for International Earth Science Information Network)
- [Link] Klein Goldewijk, K., Beusen, A., Doelman, J., and Stehfest, E.: Anthropogenic land use estimates for the Holocene – HYDE 3.2, Earth Syst. Sci. Data, 9, 927–953, https://doi.org/10.5194/essd-9-927-2017, 2017.
Area Codes
Percentage Area Codes used by businesses in Cazasu
Postal Codes
Percentage of businesses by Postal Codes in Cazasu
Human Development Index (HDI)
Statistic composite index of life expectancy, education, and per capita income.
Cazasu CO2 Emissions
Carbon Dioxide (CO2) Emissions Per Capita in Tonnes Per Year
| Location | CO2 Emissions | CO2 Emissions Per Capita | CO2 Emissions Intensity |
|---|---|---|---|
| Cazasu | 9,970 tn | 4.3 tn | 3,545 tons/km² |
| Brăila County | 1,208,093 tn | 4.3 tn | 253.5 tons/km² |
| Romania | 86,961,323 tn | 4.46 tn | 364.8 tons/km² |
| 2013 CO2 emissions (tonnes/year) | 9,970 tn |
| 2013 CO2 emissions (tonnes/year) per capita | 4.3 tn |
| 2013 CO2 emissions intensity (tonnes/km²/year) | 3,545 tons/km² |
Natural Hazards Risk
Relative risk out of 10
| Hazard | Risk Level |
|---|---|
| Drought | Low (2) |
| Flood | Medium (4) |
| Earthquake | Medium (5.3) |
* Risk, particularly concerning flood or landslide, may not be for the entire area.
- Dilley, M., R.S. Chen, U. Deichmann, A.L. Lerner-Lam, M. Arnold, J. Agwe, P. Buys, O. Kjekstad, B. Lyon, and G. Yetman. 2005. Natural Disaster Hotspots: A Global Risk Analysis. Washington, D.C.: World Bank. https://doi.org/10.1596/0-8213-5930-4.
- Center for Hazards and Risk Research - CHRR - Columbia University, Center for International Earth Science Information Network - CIESIN - Columbia University, and International Research Institute for Climate and Society - IRI - Columbia University. 2005. Global Drought Hazard Frequency and Distribution. Palisades, NY: NASA Socioeconomic Data and Applications Center (SEDAC). https://doi.org/10.7927/H4VX0DFT.
- Center for Hazards and Risk Research - CHRR - Columbia University, Center for International Earth Science Information Network - CIESIN - Columbia University. 2005. Global Flood Hazard Frequency and Distribution. Palisades, NY: NASA Socioeconomic Data and Applications Center (SEDAC). https://doi.org/10.7927/H4668B3D.
- Center for Hazards and Risk Research - CHRR - Columbia University, Center for International Earth Science Information Network - CIESIN - Columbia University. 2005. Global Earthquake Hazard Distribution - Peak Ground Acceleration. Palisades, NY: NASA Socioeconomic Data and Applications Center (SEDAC). https://doi.org/10.7927/H4BZ63ZS.
Recent Nearby Earthquakes
Magnitude 3.0 and greater
| Date▼ | Time↕ | Magnitude↕ | Distance↕ | Depth↕ | Location↕ | Link |
|---|---|---|---|---|---|---|
| 8/16/17 | 3:16 PM | 4.3 | 28.3 km | 12,850 m | 4km NNE of Smirdan, Romania | usgs.gov |
| 3/1/16 | 11:06 AM | 4.3 | 93.6 km | 66,500 m | 6km W of Bolotesti, Romania | usgs.gov |
| 10/7/15 | 9:25 AM | 4.4 | 91.4 km | 129,699 m | 9km W of Poiana Cristei, Romania | usgs.gov |
| 1/19/15 | 11:53 PM | 4 | 88.5 km | 40,000 m | 4km NE of Tifesti, Romania | usgs.gov |
| 1/12/15 | 6:08 AM | 4.2 | 72.5 km | 17,800 m | 1km SSW of Bordesti, Romania | usgs.gov |
| 12/7/14 | 9:04 PM | 4.6 | 90.1 km | 38,300 m | 5km WNW of Marasheshty, Romania | usgs.gov |
| 11/22/14 | 7:14 PM | 5.6 | 90.4 km | 32,000 m | 5km E of Panciu, Romania | usgs.gov |
| 9/30/13 | 5:01 AM | 4.1 | 25.1 km | 4,900 m | 2km SW of Schela, Romania | usgs.gov |
| 9/29/13 | 6:10 PM | 4.1 | 24.6 km | 5,000 m | 2km ESE of Schela, Romania | usgs.gov |
| 12/6/09 | 8:15 PM | 4.5 | 69.3 km | 20,000 m | Romania | usgs.gov |
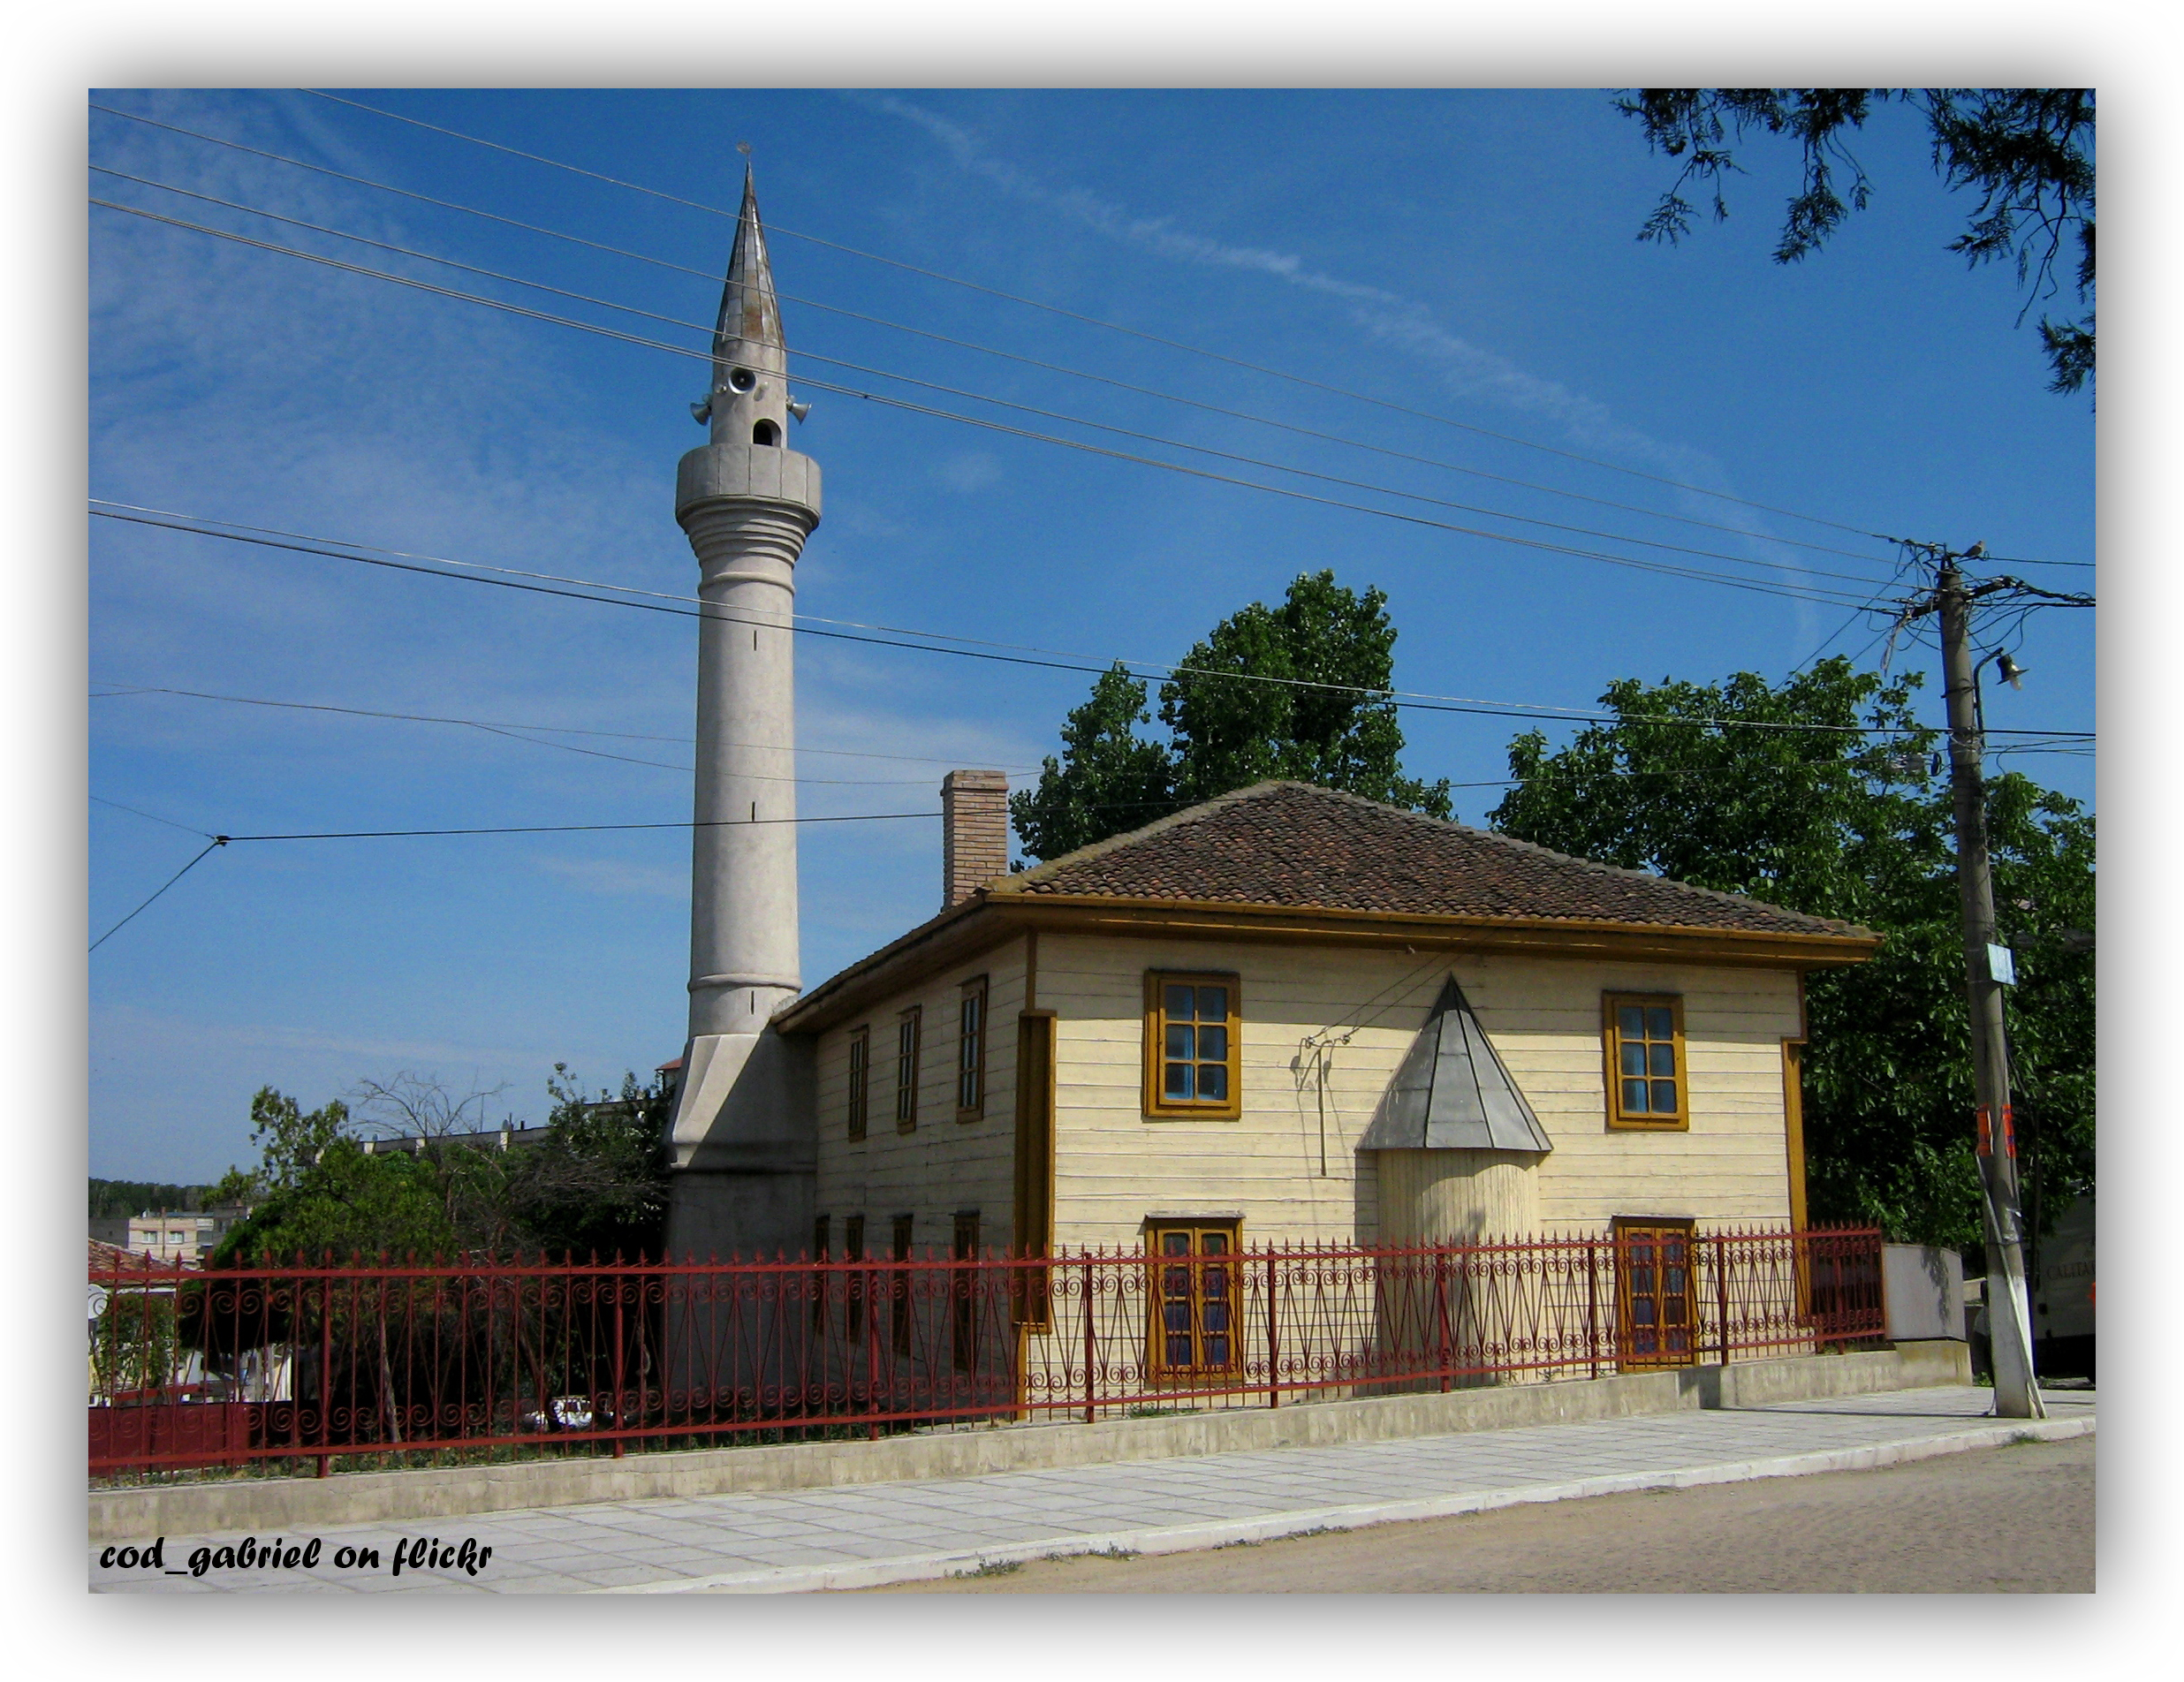
Cazasu
Cazasu is a commune located in Brăila County, Romania. It is composed of a single village, Cazasu. It was part of Tudor Vladimirescu Commune until 2003, when it was split off to form a separate commune.
Cazasu Wikipedia Page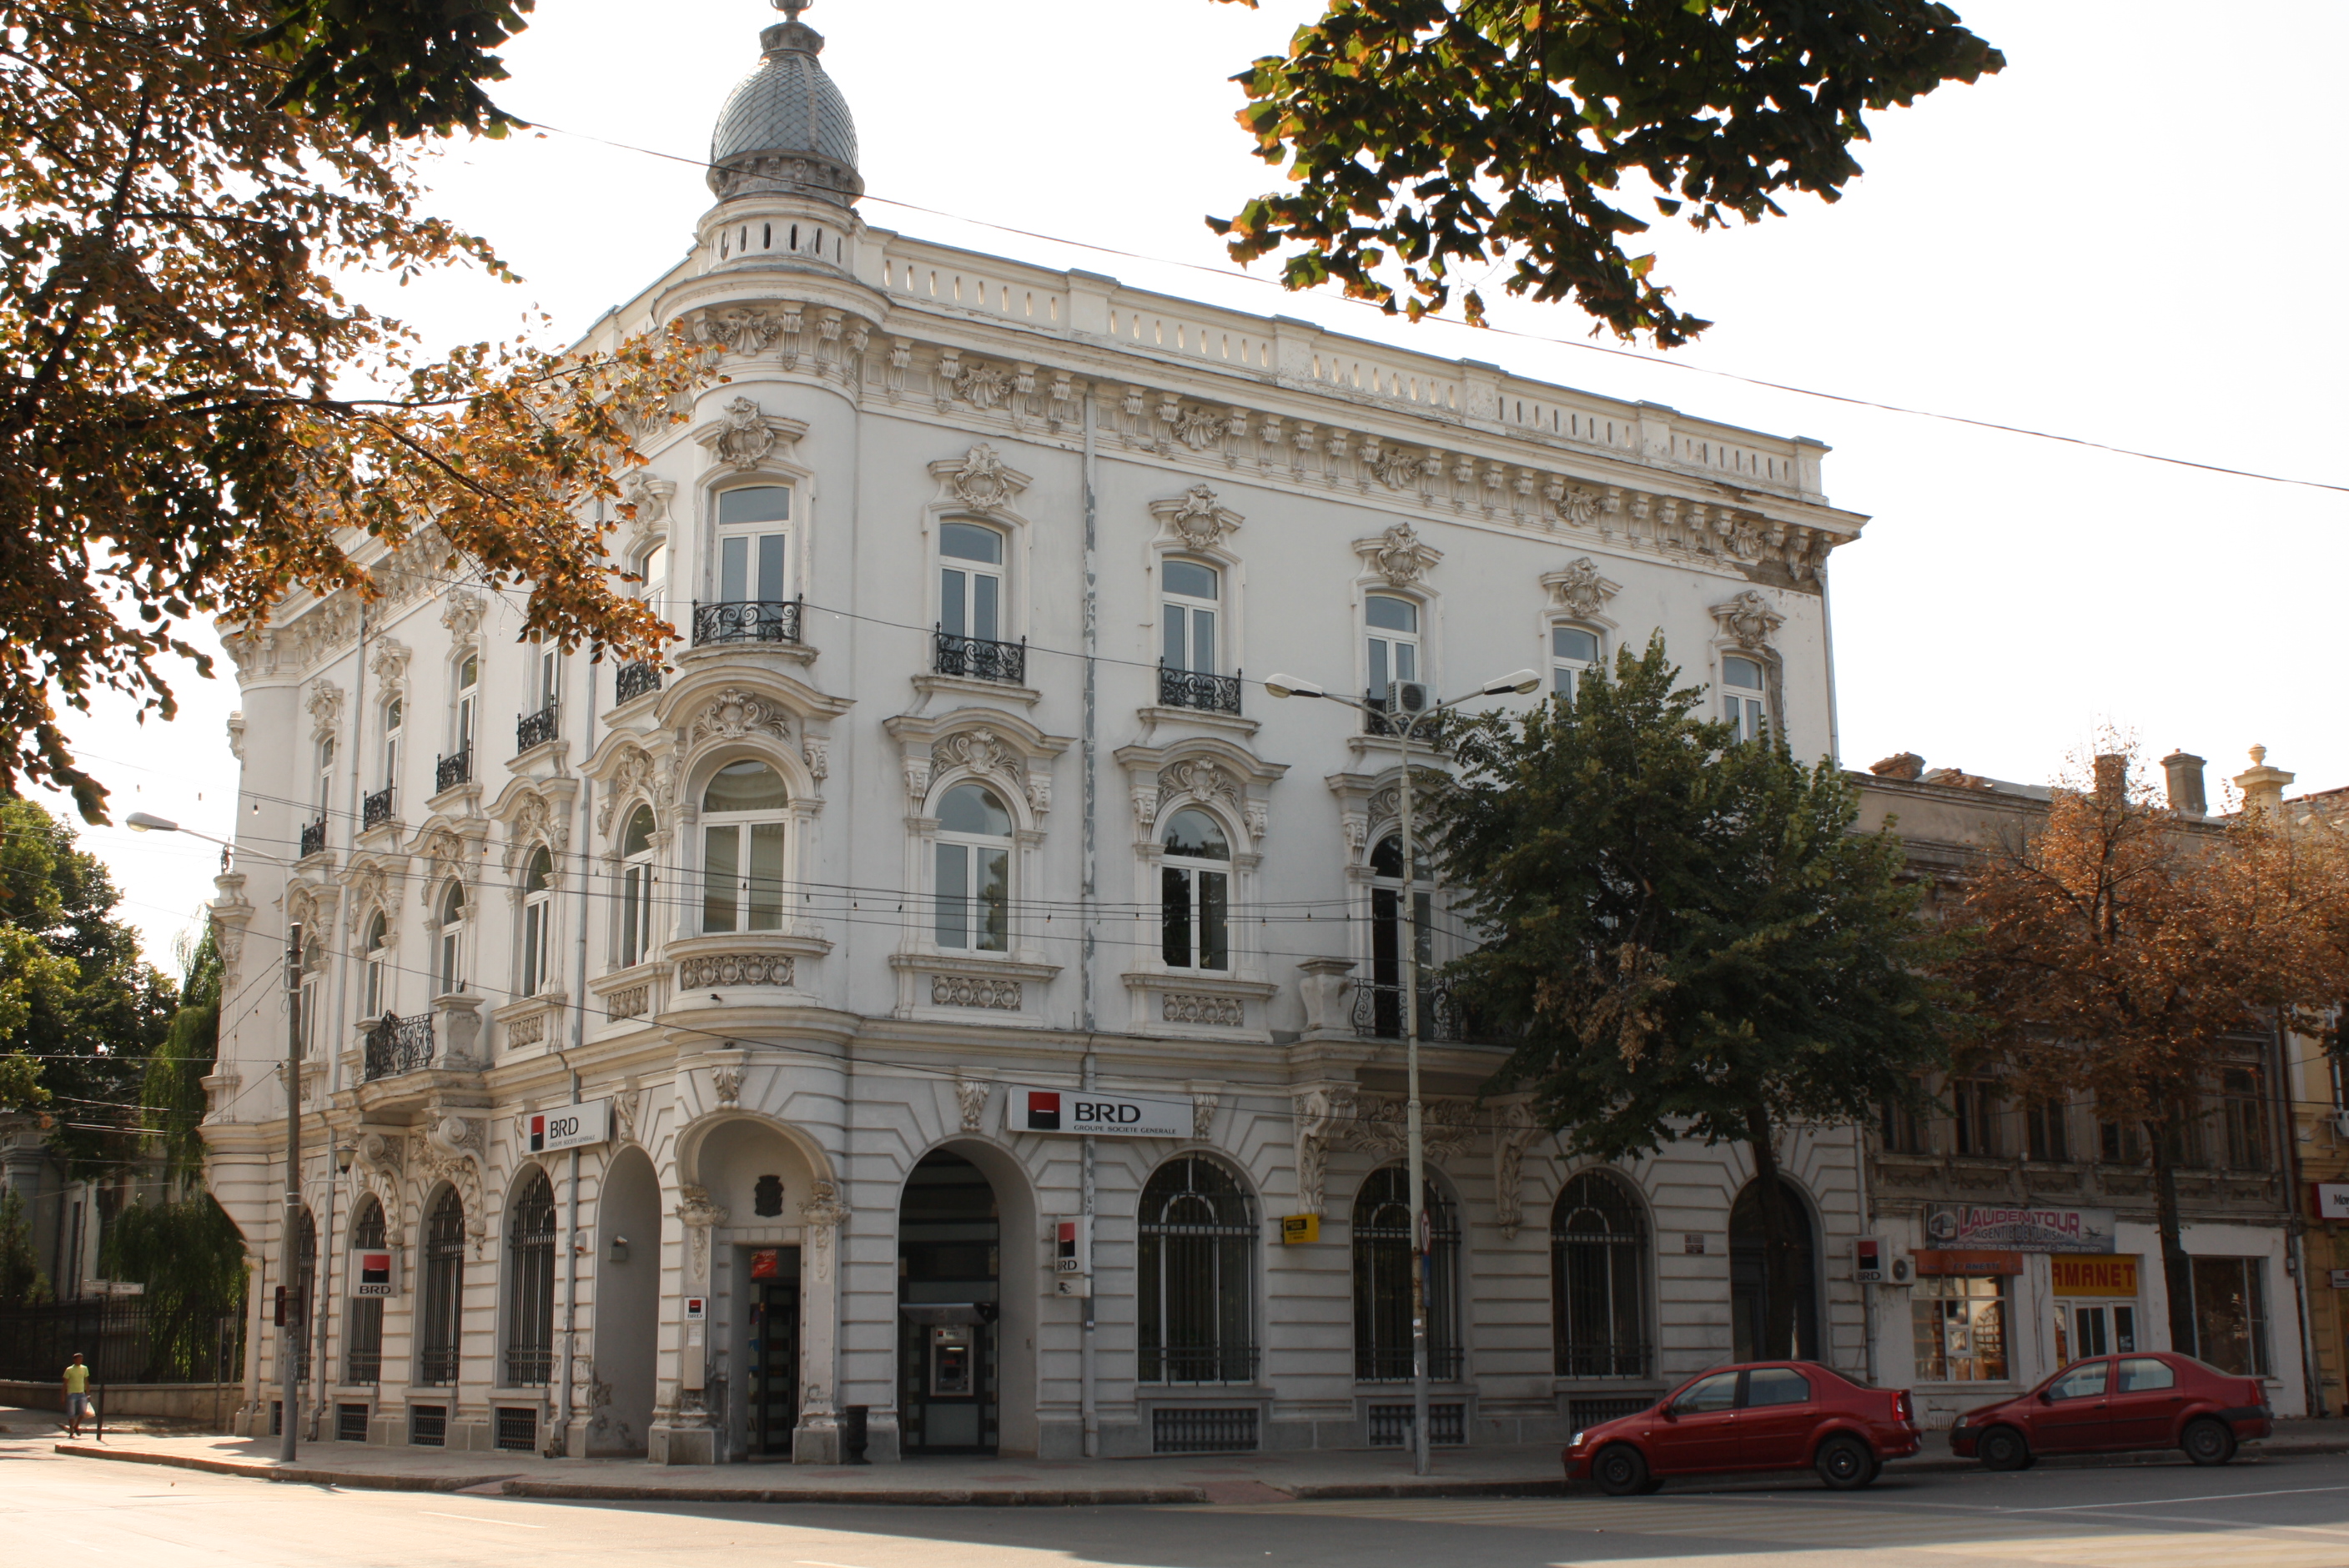

About Our Data
The data on this page is estimated using a number of publicly available tools and resources. It is provided without warranty, and could contain inaccuracies. Use at your own risk.