Doclin Facts
| Area | 139.6 km² |
| Population | 1,494 |
| Male Population | 739 (49.4%) |
| Female Population | 755 (50.6%) |
| Population change (1975 to 2020) | -32.1% |
| Population change (2000 to 2020) | -26.9% |
| Median Age | 42 years (Male: 39.7, Female: 44.3) |
| Local Time | |
| Timezone | Eastern European Summer Time |
| Lat & Lng | 45.29694, 21.65389 |
| Postal Codes | 327175 |
Map of Doclin
Interactive Map
Doclin Population
Years 1975 to 2020
| Data | 1975 | 1990 | 2000 | 2015 | 2020 |
|---|---|---|---|---|---|
| Population | 2,199 | 2,260 | 2,045 | 1,545 | 1,494 |
| Population Density | 15.7 / km² | 16.2 / km² | 14.6 / km² | 11.1 / km² | 10.7 / km² |
Doclin Population change from 2000 to 2015
Decrease of 24.4% from year 2000 to 2015
| Location | Change since 1975 | Change since 1990 | Change since 2000 |
|---|---|---|---|
| Doclin | -29.7% | -31.6% | -24.4% |
| Caraș-Severin County | -29.9% | -31.7% | -24.4% |
| Romania | -9.9% | -16.9% | -11.8% |
Doclin Median Age
Median Age: 42 years
| Location | Median Age | Median Age (Female) | Median Age (Male) |
|---|---|---|---|
| Doclin | 42 yrs | 44.3 yrs | 39.7 yrs |
| Caraș-Severin County | 42 yrs | 43.5 yrs | 40.4 yrs |
| Romania | 40.1 yrs | 41.6 yrs | 38.5 yrs |
Doclin Population Density
Population Density: 10.7 / km²
| Location | Population | Area | Density |
|---|---|---|---|
| Doclin | 1,494 | 139.6 km² | 10.7 / km² |
| Caraș-Severin County | 261,849 | 8,510.6 km² | 30.8 / km² |
| Romania | 19.5 million | 238,387.8 km² | 81.8 / km² |
Doclin Historical and Projected Population
Estimated Population from 0 to 2100
- JRC (European Commission's Joint Research Centre) work on the GHS built-up grid
- CIESIN (Center for International Earth Science Information Network)
- [Link] Klein Goldewijk, K., Beusen, A., Doelman, J., and Stehfest, E.: Anthropogenic land use estimates for the Holocene – HYDE 3.2, Earth Syst. Sci. Data, 9, 927–953, https://doi.org/10.5194/essd-9-927-2017, 2017.
Human Development Index (HDI)
Statistic composite index of life expectancy, education, and per capita income.
Doclin CO2 Emissions
Carbon Dioxide (CO2) Emissions Per Capita in Tonnes Per Year
| Location | CO2 Emissions | CO2 Emissions Per Capita | CO2 Emissions Intensity |
|---|---|---|---|
| Doclin | 7,744 tn | 5.18 tn | 55.5 tons/km² |
| Caraș-Severin County | 1,359,330 tn | 5.19 tn | 159.7 tons/km² |
| Romania | 86,961,323 tn | 4.46 tn | 364.8 tons/km² |
| 2013 CO2 emissions (tonnes/year) | 7,744 tn |
| 2013 CO2 emissions (tonnes/year) per capita | 5.18 tn |
| 2013 CO2 emissions intensity (tonnes/km²/year) | 55.5 tons/km² |
Natural Hazards Risk
Relative risk out of 10
| Hazard | Risk Level |
|---|---|
| Drought | Low (2) |
| Flood | High (8) |
| Earthquake | Medium (5.3) |
* Risk, particularly concerning flood or landslide, may not be for the entire area.
- Dilley, M., R.S. Chen, U. Deichmann, A.L. Lerner-Lam, M. Arnold, J. Agwe, P. Buys, O. Kjekstad, B. Lyon, and G. Yetman. 2005. Natural Disaster Hotspots: A Global Risk Analysis. Washington, D.C.: World Bank. https://doi.org/10.1596/0-8213-5930-4.
- Center for Hazards and Risk Research - CHRR - Columbia University, Center for International Earth Science Information Network - CIESIN - Columbia University, and International Research Institute for Climate and Society - IRI - Columbia University. 2005. Global Drought Hazard Frequency and Distribution. Palisades, NY: NASA Socioeconomic Data and Applications Center (SEDAC). https://doi.org/10.7927/H4VX0DFT.
- Center for Hazards and Risk Research - CHRR - Columbia University, Center for International Earth Science Information Network - CIESIN - Columbia University. 2005. Global Flood Hazard Frequency and Distribution. Palisades, NY: NASA Socioeconomic Data and Applications Center (SEDAC). https://doi.org/10.7927/H4668B3D.
- Center for Hazards and Risk Research - CHRR - Columbia University, Center for International Earth Science Information Network - CIESIN - Columbia University. 2005. Global Earthquake Hazard Distribution - Peak Ground Acceleration. Palisades, NY: NASA Socioeconomic Data and Applications Center (SEDAC). https://doi.org/10.7927/H4BZ63ZS.
Recent Nearby Earthquakes
Magnitude 3.0 and greater
| Date▼ | Time↕ | Magnitude↕ | Distance↕ | Depth↕ | Location↕ | Link |
|---|---|---|---|---|---|---|
| 12/23/18 | 6:33 AM | 4.1 | 56.4 km | 10,000 m | 2km NW of Hajducica, Serbia | usgs.gov |
| 6/9/16 | 2:05 AM | 4.2 | 92.7 km | 2,000 m | 6km S of Turija, Serbia | usgs.gov |
| 10/31/14 | 11:00 PM | 4.1 | 52.2 km | 4,100 m | 1km NNE of Teregova, Romania | usgs.gov |
| 6/22/08 | 1:35 PM | 3.4 | 77.2 km | 5,000 m | Serbia | usgs.gov |
| 9/20/07 | 10:46 PM | 3.3 | 91.3 km | 14,900 m | Serbia | usgs.gov |
| 7/30/07 | 8:51 PM | 3.1 | 88 km | 10,000 m | Serbia | usgs.gov |
| 7/2/06 | 9:07 PM | 3 | 83.5 km | 15,000 m | Serbia | usgs.gov |
| 6/28/06 | 5:25 PM | 3.4 | 89.9 km | 10,000 m | Serbia | usgs.gov |
| 4/20/05 | 8:17 AM | 3.3 | 52 km | 18,700 m | Romania | usgs.gov |
| 3/20/05 | 9:51 AM | 3 | 88 km | 20,500 m | Romania | usgs.gov |
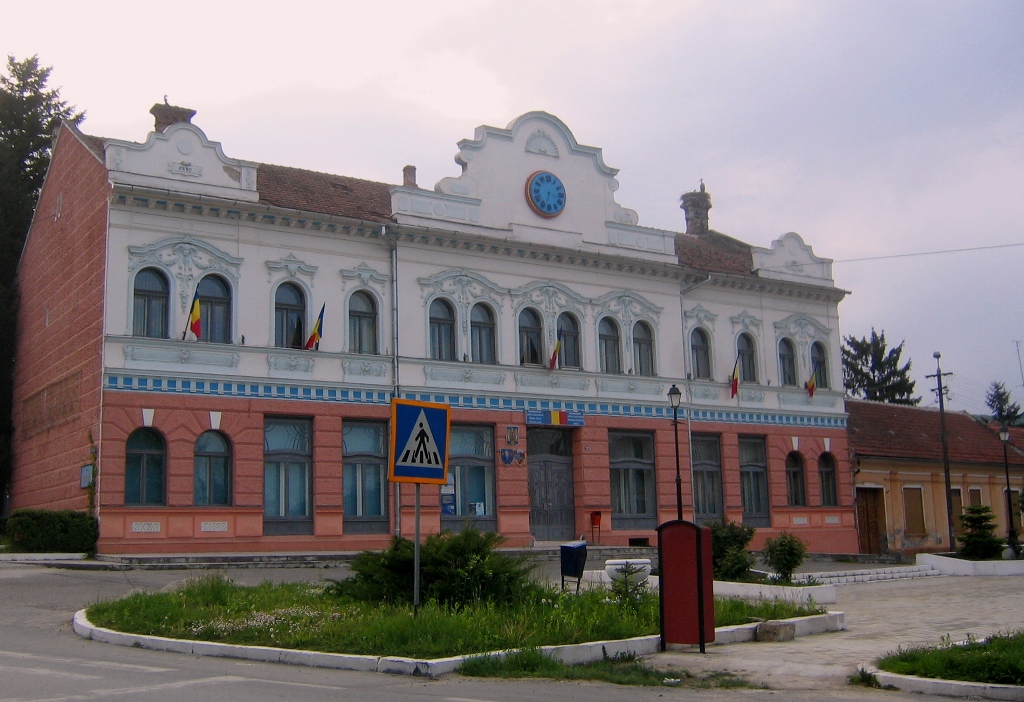
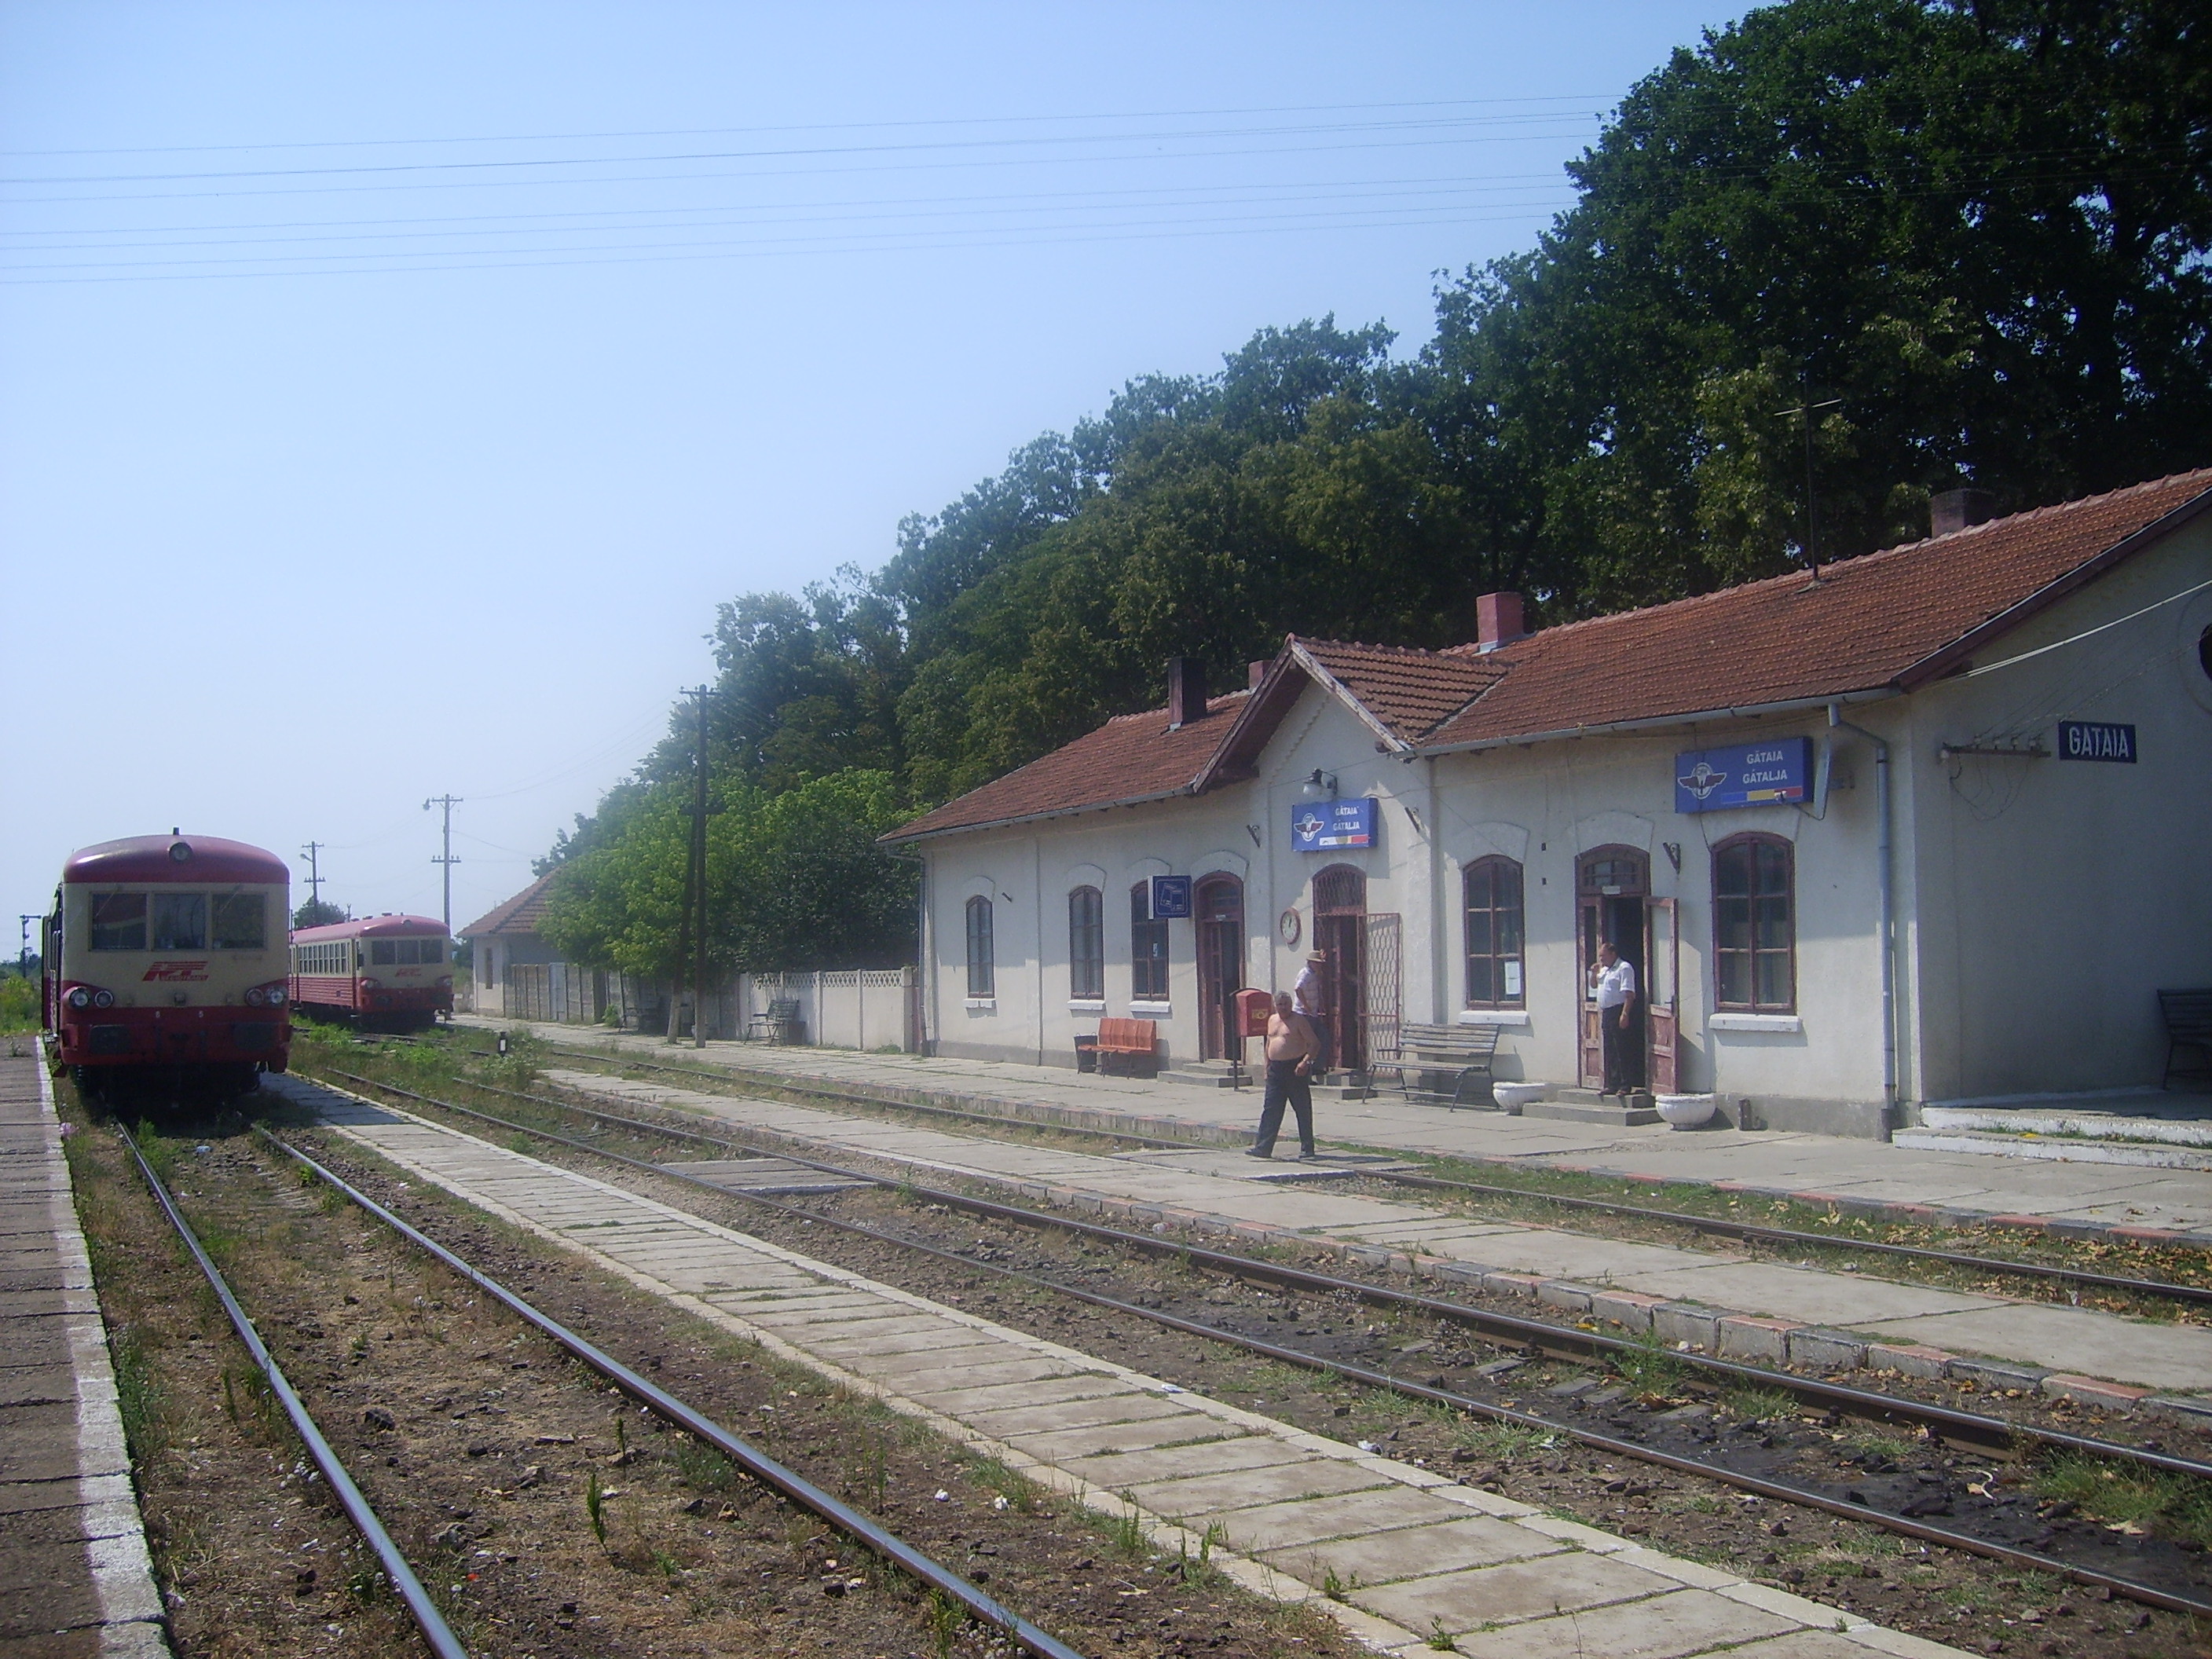
Doclin
Doclin (Hungarian: Doklény) is a commune in Caraş-Severin County, western Romania with a population of 2.047 people. It is composed of three villages: Biniș (Bényes), Doclin and Tirol (Királykegye; German: Königsgnad).
Doclin Wikipedia Page
About Our Data
The data on this page is estimated using a number of publicly available tools and resources. It is provided without warranty, and could contain inaccuracies. Use at your own risk.