Categories in Jijila
Jijila Facts
| Area | 2.8 km² |
| Population | 2,768 |
| Male Population | 1,391 (50.3%) |
| Female Population | 1,377 (49.7%) |
| Population change (1975 to 2020) | -54.1% |
| Population change (2000 to 2020) | -35.9% |
| Median Age | 40.8 years (Male: 39.8, Female: 41.9) |
| Local Time | |
| Timezone | Eastern European Summer Time |
| Lat & Lng | 45.30000, 28.15000 |
| Postal Codes | 827110 |
Map of Jijila
Interactive Map
Jijila Population
Years 1975 to 2020
| Data | 1975 | 1990 | 2000 | 2015 | 2020 |
|---|---|---|---|---|---|
| Population | 6,030 | 5,260 | 4,318 | 2,873 | 2,768 |
| Population Density | 2,144 / km² | 1,870.2 / km² | 1,535.3 / km² | 1,021.5 / km² | 984.2 / km² |
Sources: JRC (European Commission's Joint Research Centre) work on the GHS built-up grid
Jijila Population change from 2000 to 2015
Decrease of 33.5% from year 2000 to 2015
| Location | Change since 1975 | Change since 1990 | Change since 2000 |
|---|---|---|---|
| Jijila | -52.4% | -45.4% | -33.5% |
| Tulcea County | -47.5% | -42.9% | -32.1% |
| Romania | -9.9% | -16.9% | -11.8% |
Sources: JRC (European Commission's Joint Research Centre) work on the GHS built-up grid
Jijila Median Age
Median Age: 40.8 years
| Location | Median Age | Median Age (Female) | Median Age (Male) |
|---|---|---|---|
| Jijila | 40.8 yrs | 41.9 yrs | 39.8 yrs |
| Tulcea County | 41.3 yrs | 42.7 yrs | 39.9 yrs |
| Romania | 40.1 yrs | 41.6 yrs | 38.5 yrs |
Sources: CIESIN (Center for International Earth Science Information Network)
Jijila Population Density
Population Density: 984 / km²
| Location | Population | Area | Density |
|---|---|---|---|
| Jijila | 2,768 | 2.813 km² | 984 / km² |
| Tulcea County | 185,186 | 8,499.3 km² | 21.8 / km² |
| Romania | 19.5 million | 238,387.8 km² | 81.8 / km² |
Sources: JRC (European Commission's Joint Research Centre) work on the GHS built-up grid
Jijila Historical and Projected Population
Estimated Population from 0 to 2100
Sources:
- JRC (European Commission's Joint Research Centre) work on the GHS built-up grid
- CIESIN (Center for International Earth Science Information Network)
- [Link] Klein Goldewijk, K., Beusen, A., Doelman, J., and Stehfest, E.: Anthropogenic land use estimates for the Holocene – HYDE 3.2, Earth Syst. Sci. Data, 9, 927–953, https://doi.org/10.5194/essd-9-927-2017, 2017.
Human Development Index (HDI)
Statistic composite index of life expectancy, education, and per capita income.
Source: [Link] Kummu, M., Taka, M. &Guillaume, J. Gridded global datasets for Gross Domestic Product and Human Development Index over 1990–2015. Sci Data 5, 180004 (2018) doi:10.1038/sdata.2018.4
Jijila CO2 Emissions
Carbon Dioxide (CO2) Emissions Per Capita in Tonnes Per Year
| Location | CO2 Emissions | CO2 Emissions Per Capita | CO2 Emissions Intensity |
|---|---|---|---|
| Jijila | 12,092 tn | 4.37 tn | 4,299.5 tons/km² |
| Tulcea County | 809,240 tn | 4.37 tn | 95.2 tons/km² |
| Romania | 86,961,323 tn | 4.46 tn | 364.8 tons/km² |
Sources: [Link] Moran, D., Kanemoto K; Jiborn, M., Wood, R., Többen, J., and Seto, K.C. (2018) Carbon footprints of 13,000 cities. Environmental Research Letters DOI: 10.1088/1748-9326/aac72a
Jijila CO2 Emissions
| 2013 CO2 emissions (tonnes/year) | 12,092 tn |
| 2013 CO2 emissions (tonnes/year) per capita | 4.37 tn |
| 2013 CO2 emissions intensity (tonnes/km²/year) | 4,299.5 tons/km² |
Natural Hazards Risk
Relative risk out of 10
| Hazard | Risk Level |
|---|---|
| Drought | Low (2) |
| Flood | Medium (4) |
| Earthquake | Medium (6) |
* Risk, particularly concerning flood or landslide, may not be for the entire area.
Sources:
- Dilley, M., R.S. Chen, U. Deichmann, A.L. Lerner-Lam, M. Arnold, J. Agwe, P. Buys, O. Kjekstad, B. Lyon, and G. Yetman. 2005. Natural Disaster Hotspots: A Global Risk Analysis. Washington, D.C.: World Bank. https://doi.org/10.1596/0-8213-5930-4.
- Center for Hazards and Risk Research - CHRR - Columbia University, Center for International Earth Science Information Network - CIESIN - Columbia University, and International Research Institute for Climate and Society - IRI - Columbia University. 2005. Global Drought Hazard Frequency and Distribution. Palisades, NY: NASA Socioeconomic Data and Applications Center (SEDAC). https://doi.org/10.7927/H4VX0DFT.
- Center for Hazards and Risk Research - CHRR - Columbia University, Center for International Earth Science Information Network - CIESIN - Columbia University. 2005. Global Flood Hazard Frequency and Distribution. Palisades, NY: NASA Socioeconomic Data and Applications Center (SEDAC). https://doi.org/10.7927/H4668B3D.
- Center for Hazards and Risk Research - CHRR - Columbia University, Center for International Earth Science Information Network - CIESIN - Columbia University. 2005. Global Earthquake Hazard Distribution - Peak Ground Acceleration. Palisades, NY: NASA Socioeconomic Data and Applications Center (SEDAC). https://doi.org/10.7927/H4BZ63ZS.
Recent Nearby Earthquakes
Magnitude 3.0 and greater
| Date▼ | Time↕ | Magnitude↕ | Distance↕ | Depth↕ | Location↕ | Link |
|---|---|---|---|---|---|---|
| 8/16/17 | 3:16 PM | 4.3 | 29.3 km | 12,850 m | 4km NNE of Smirdan, Romania | usgs.gov |
| 1/12/15 | 6:08 AM | 4.2 | 90.5 km | 17,800 m | 1km SSW of Bordesti, Romania | usgs.gov |
| 9/30/13 | 5:01 AM | 4.1 | 34.8 km | 4,900 m | 2km SW of Schela, Romania | usgs.gov |
| 9/29/13 | 6:10 PM | 4.1 | 32.2 km | 5,000 m | 2km ESE of Schela, Romania | usgs.gov |
| 12/6/09 | 8:15 PM | 4.5 | 88.6 km | 20,000 m | Romania | usgs.gov |
| 3/21/08 | 4:19 PM | 4.1 | 96.8 km | 23,000 m | Romania | usgs.gov |
| 12/11/07 | 3:18 PM | 3.2 | 89.6 km | 5,000 m | Romania | usgs.gov |
| 11/29/07 | 6:50 PM | 4 | 92 km | 7,100 m | Romania | usgs.gov |
| 10/30/07 | 5:56 PM | 4.1 | 46.6 km | 50,000 m | Romania | usgs.gov |
| 1/7/07 | 2:25 PM | 3.2 | 69.2 km | 15,000 m | Romania | usgs.gov |
Source: U.S. Geological Survey (USGS)
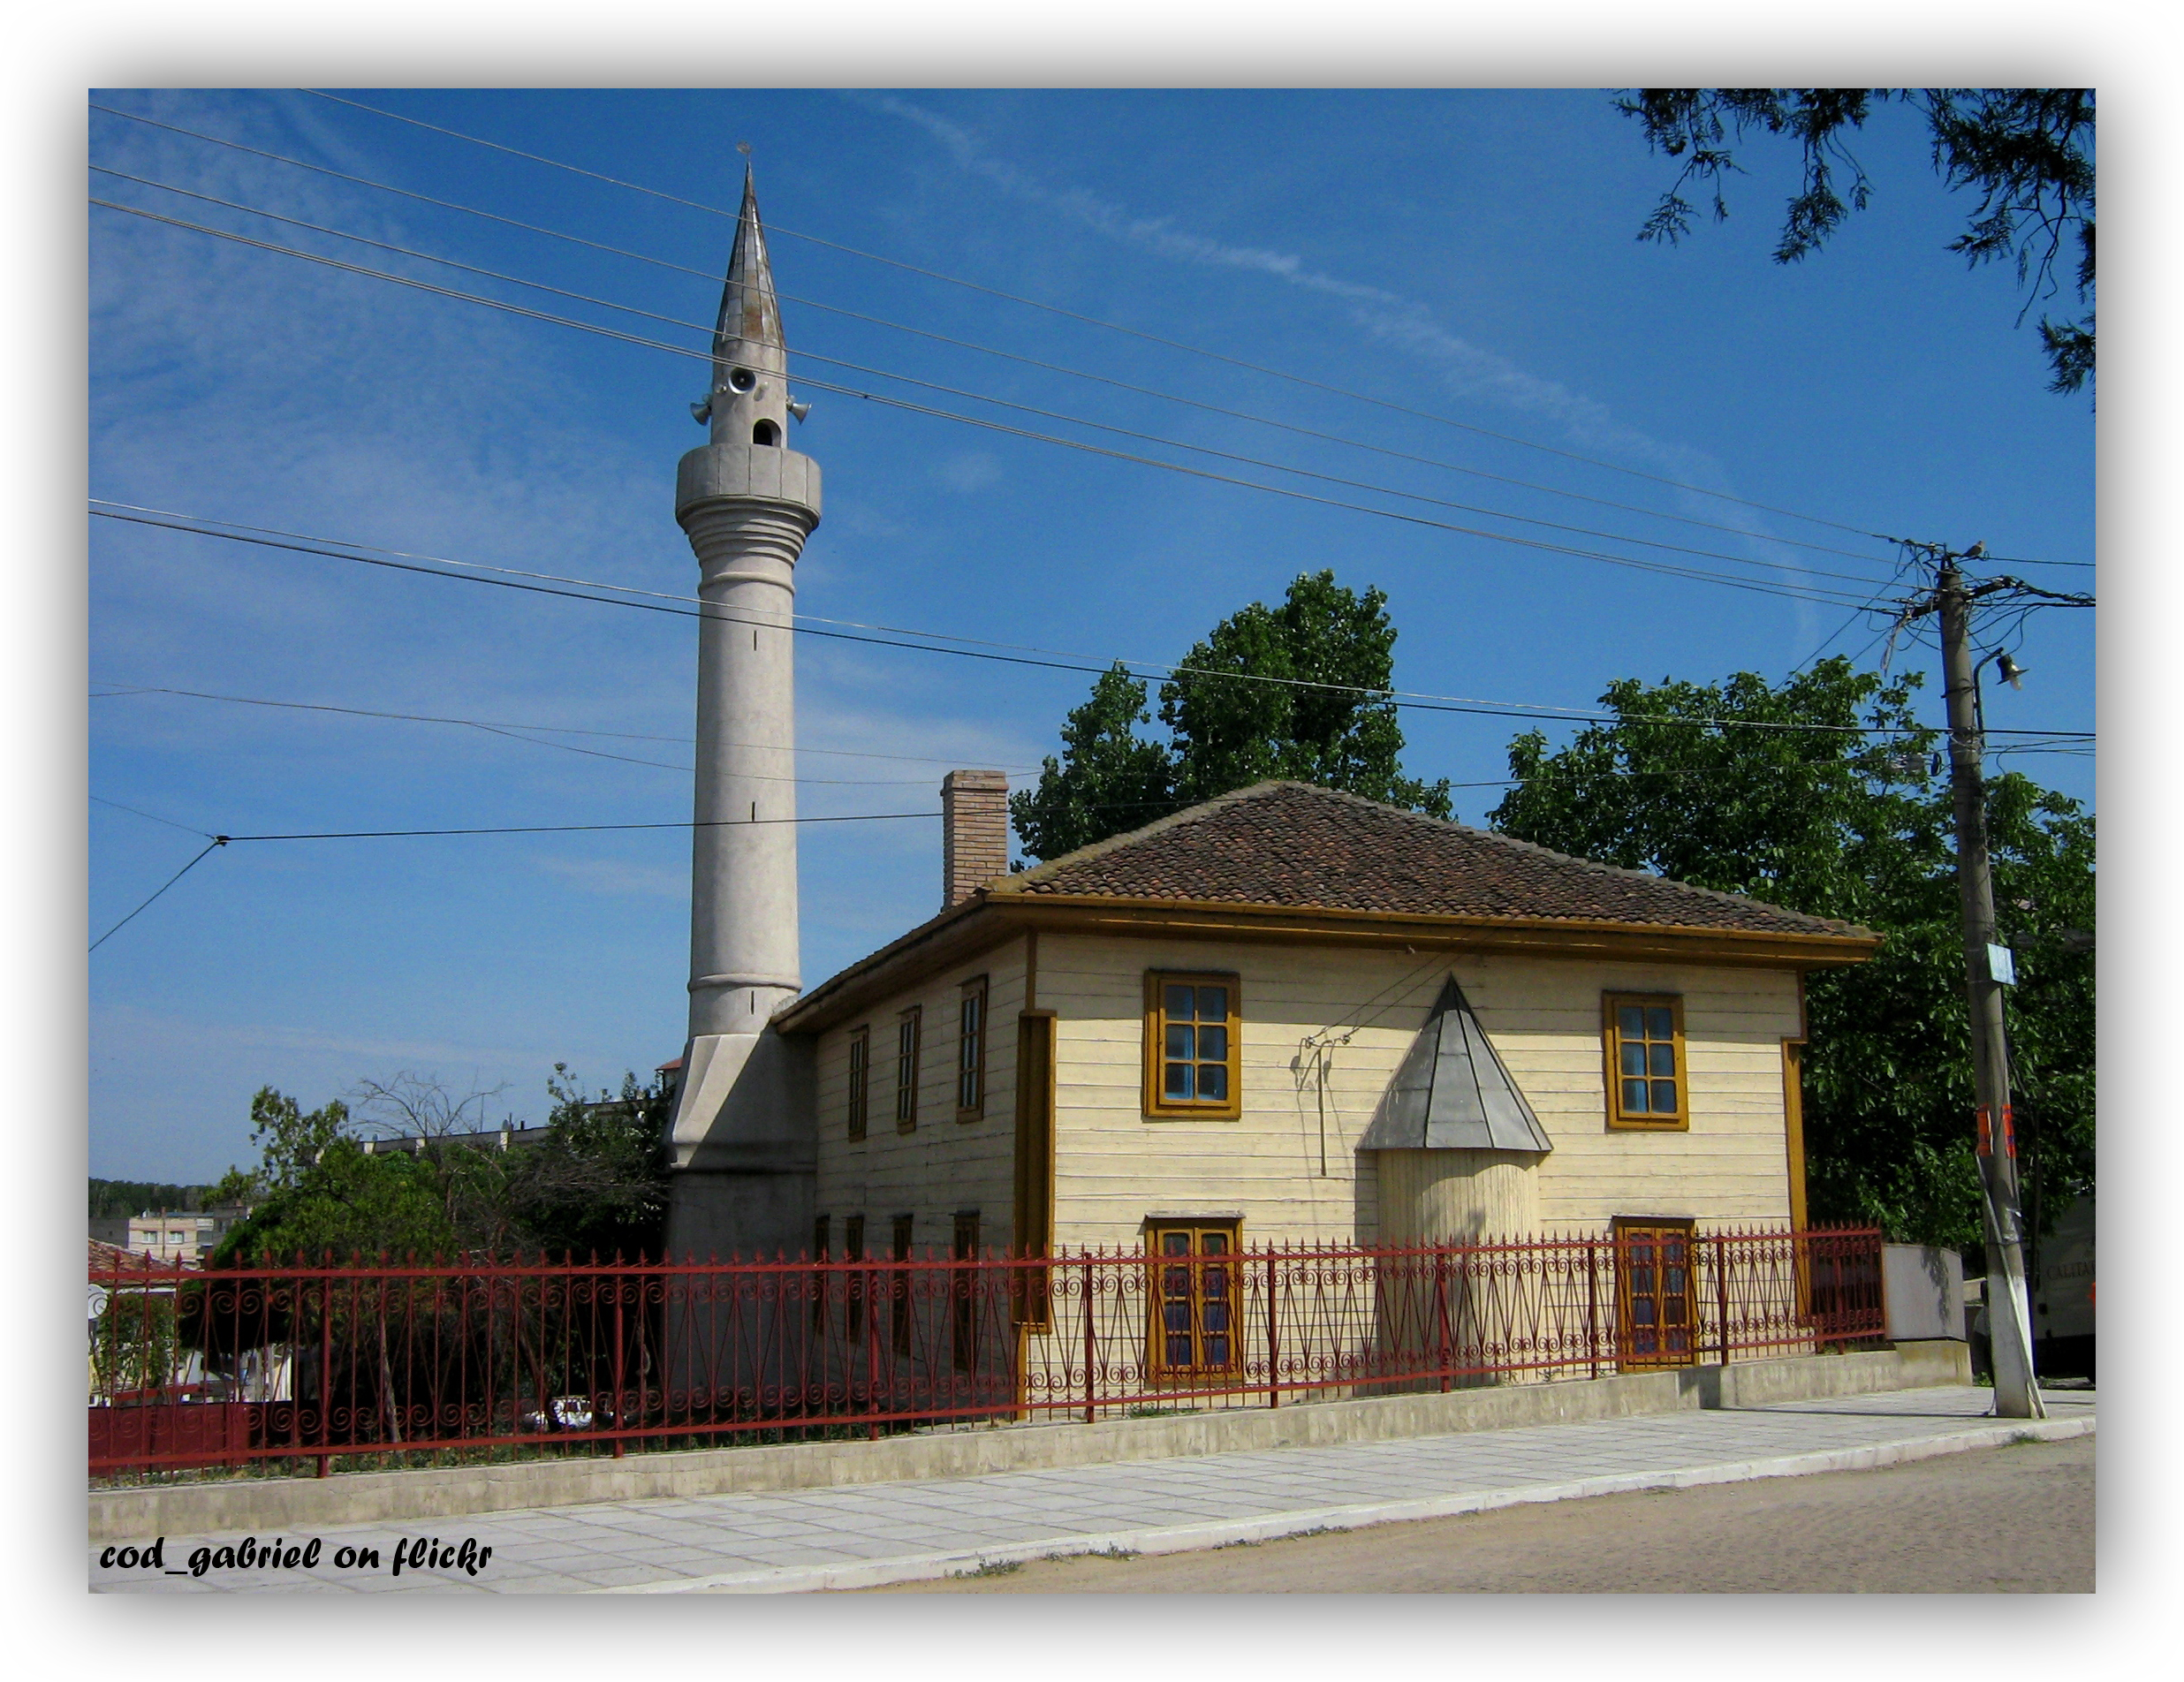
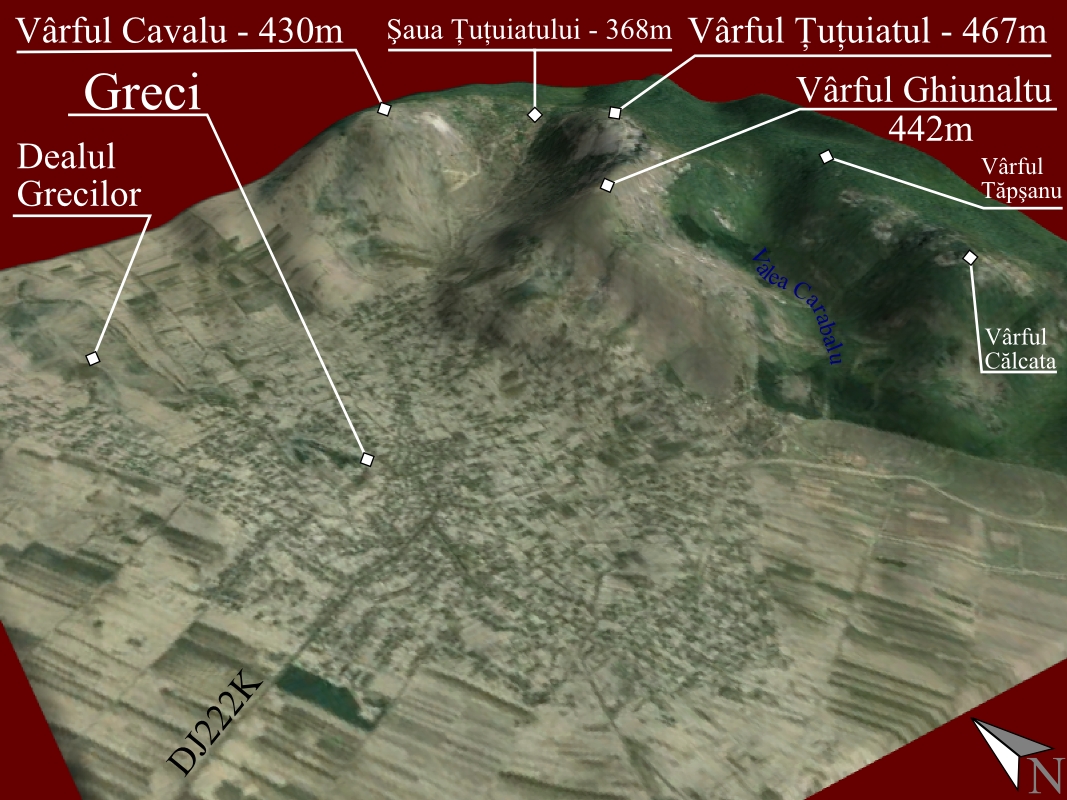
Jijila
Jijila is a commune in Tulcea County, Romania. It is composed of two villages, Garvăn and Jijila.
Jijila Wikipedia Page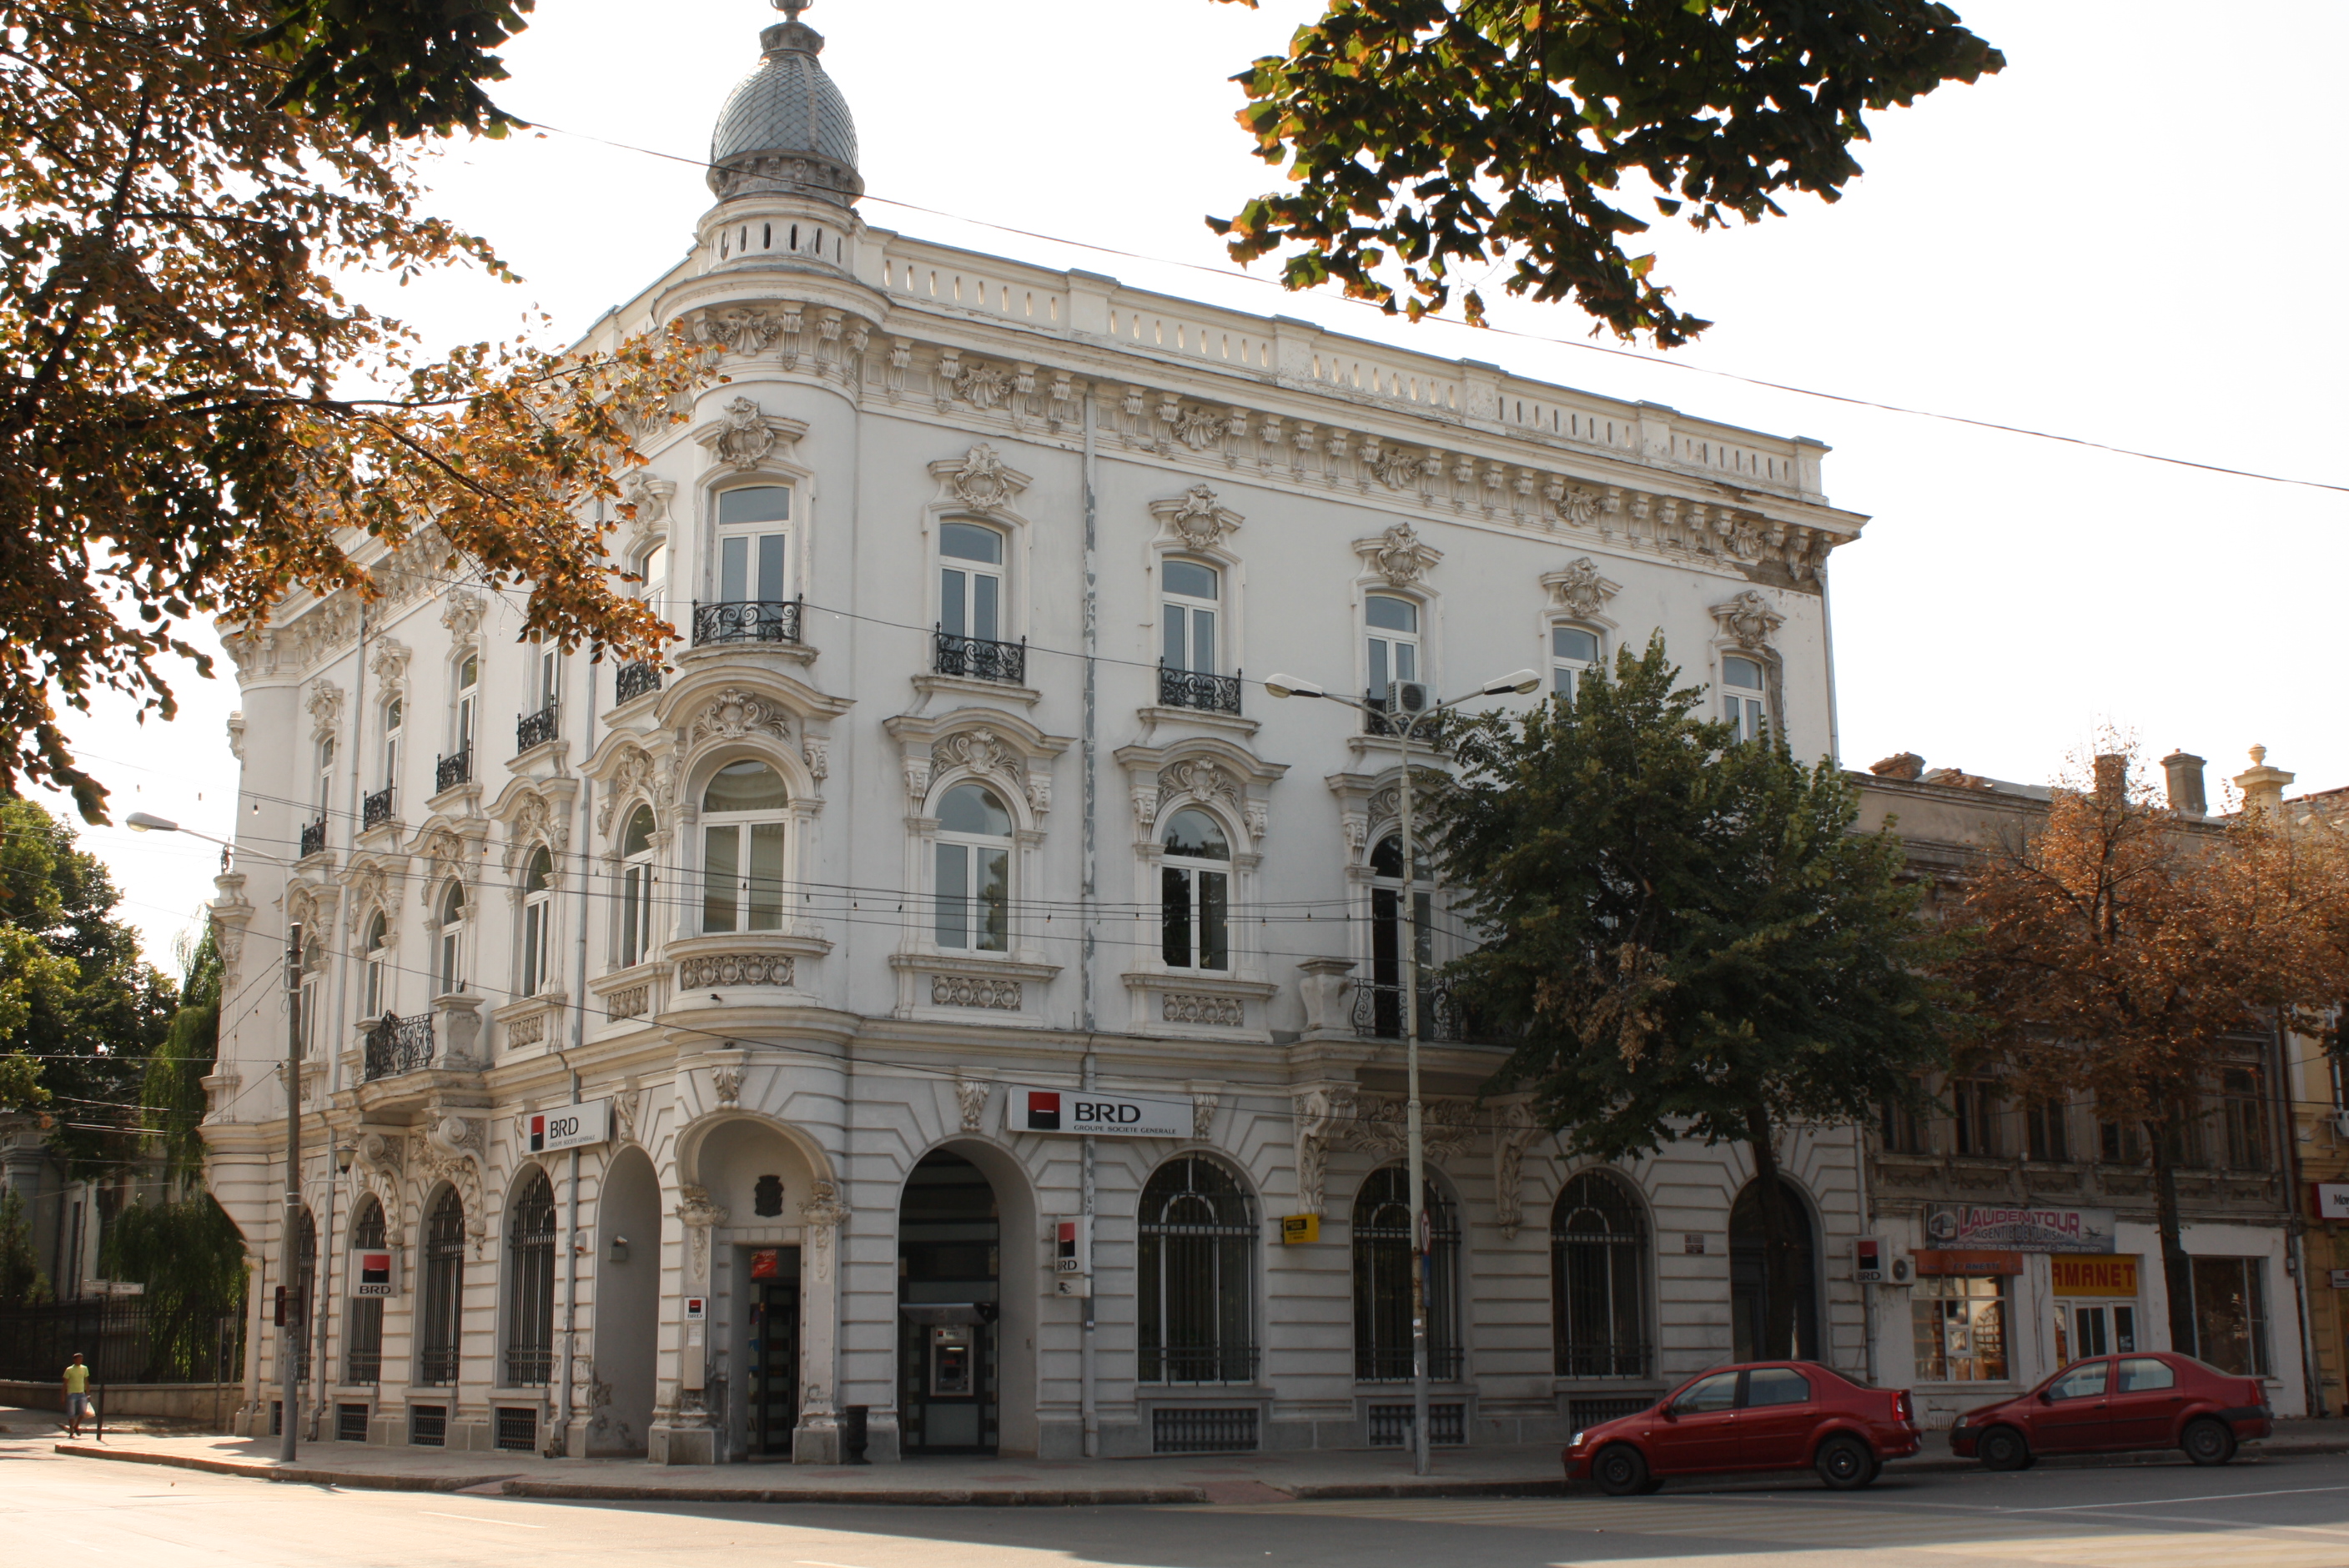
About Our Data
The data on this page is estimated using a number of publicly available tools and resources. It is provided without warranty, and could contain inaccuracies. Use at your own risk.